

Pgiam/iStock via Getty Images
Prospect Capital Corporation (NASDAQ:PSEC) is a large business development corporation with a relatively long and very interesting history.
YCharts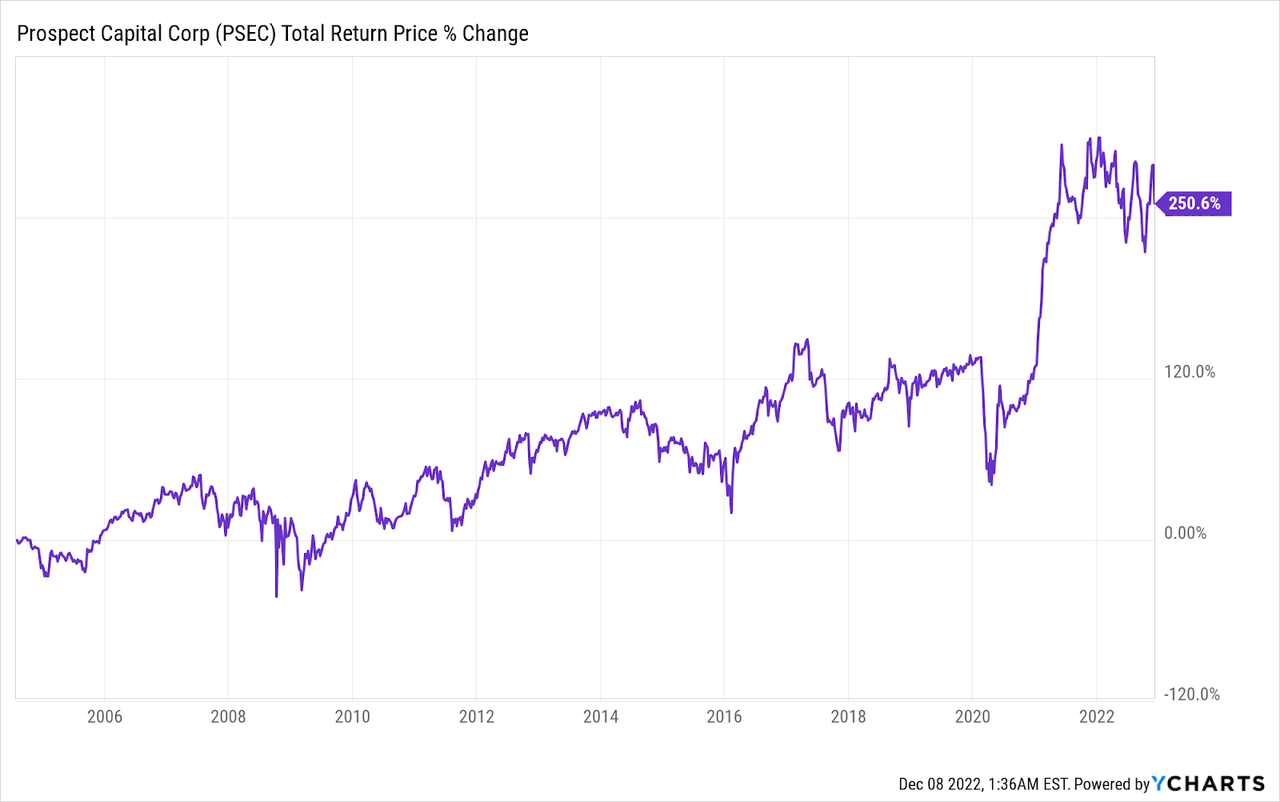
Until the pandemic, PSEC clocked in a meager 5.7% total return that underperformed the competition (see below) as well as the broader stock market by a substantial margin.
YCharts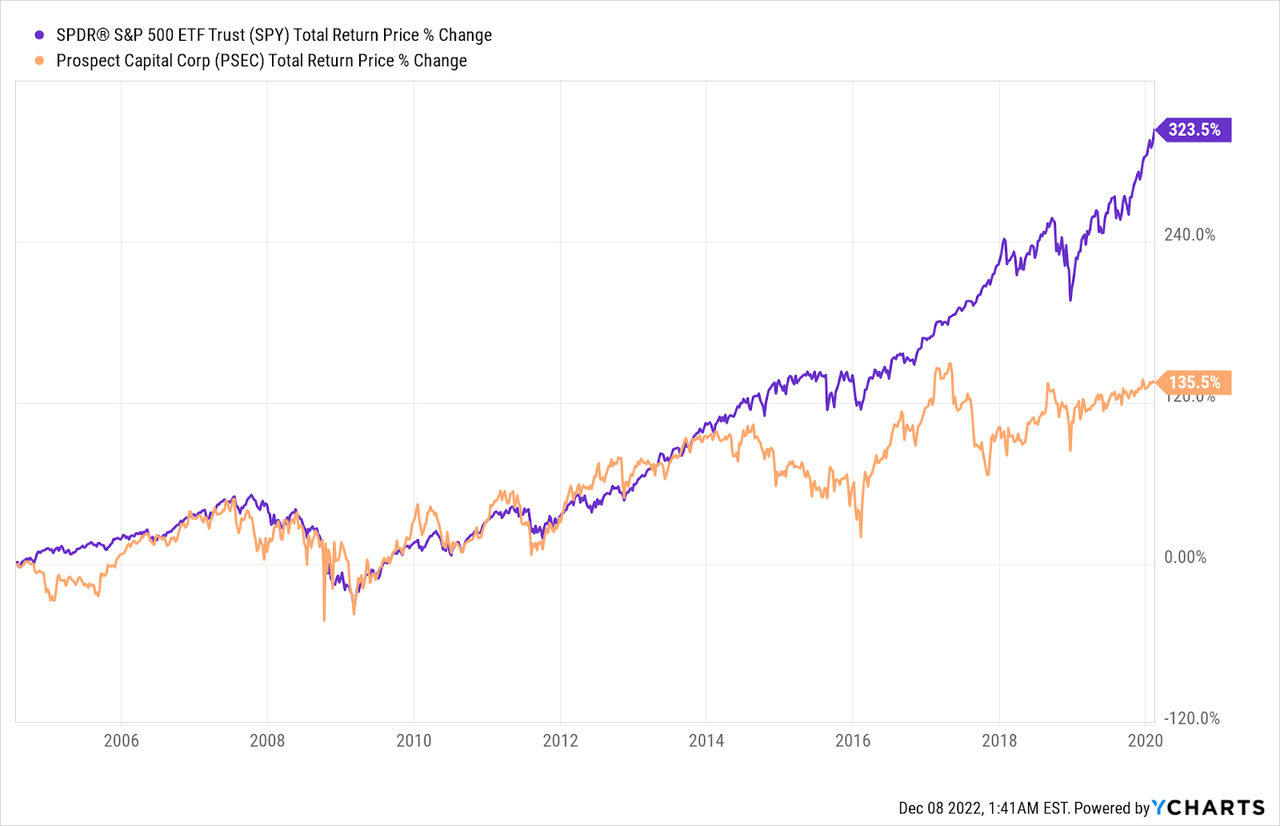
Income investors might defend this underperformance as acceptable given its larger yield, but that debate is more academic and less interesting now, because PSEC is absolutely crushing the market.
YCharts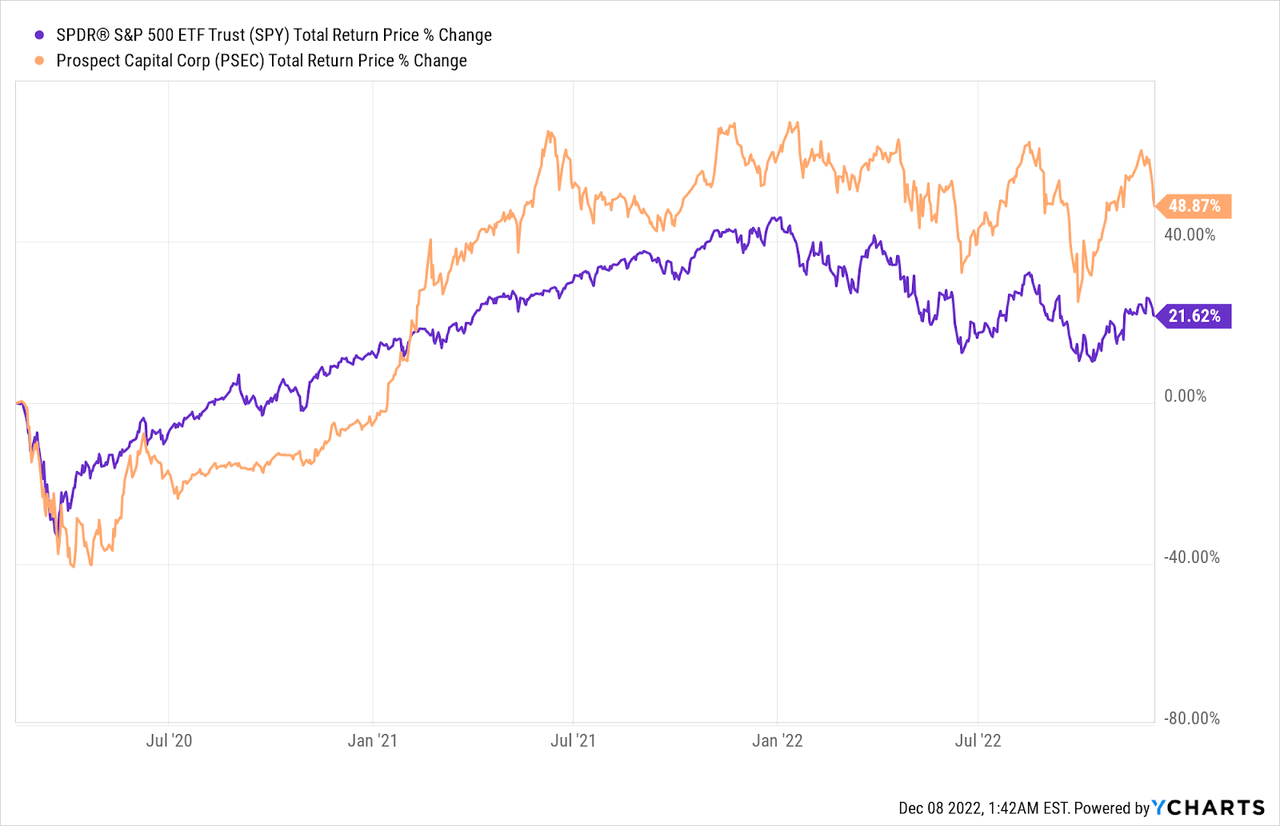
With a sustained gain limited to the 50% ceiling achieved in early 2021, PSEC’s sideways trading isn’t delightful, but it’s certainly better than the market itself.
YCharts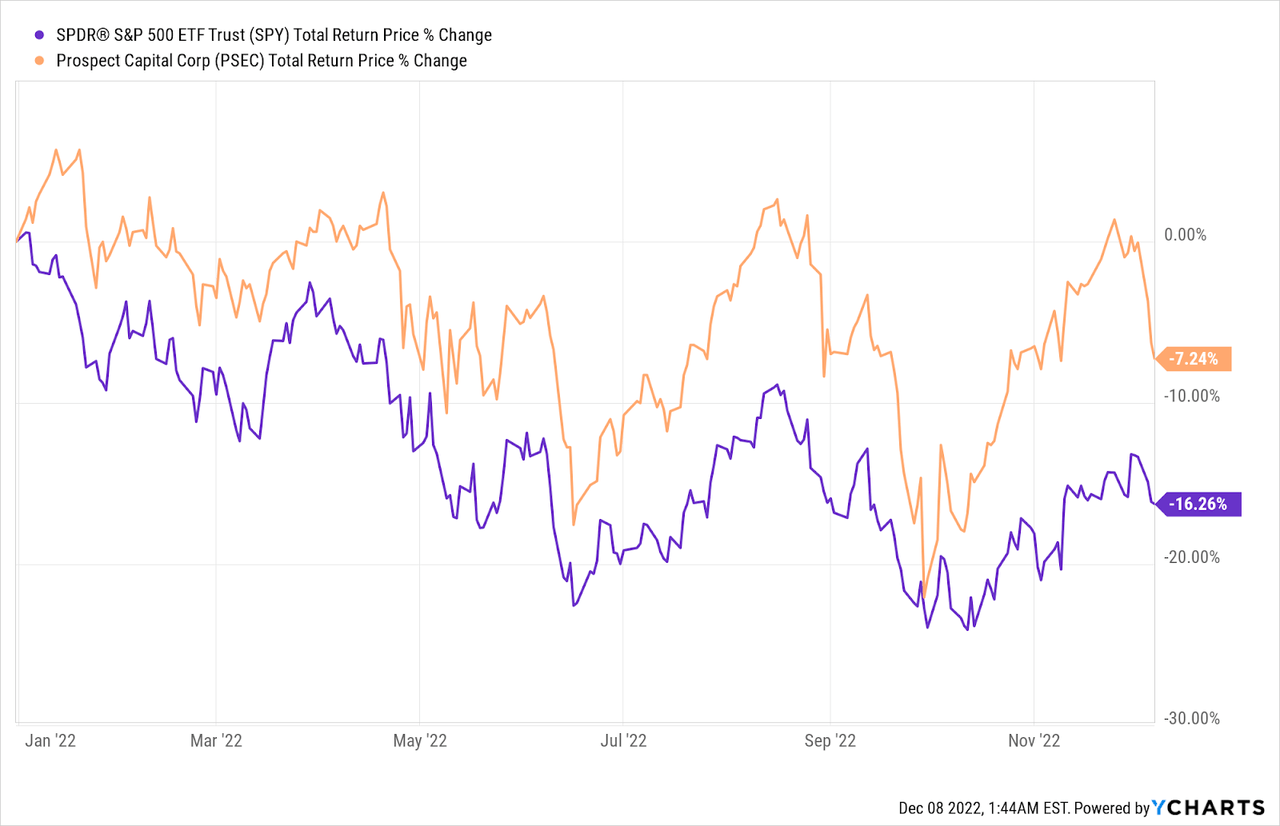
While the market has struggled to avoid a bear market, PSEC’s losses have remained about half that of the market’s for most of the year on a YTD basis, indicating renewed market interest in the company despite cooling interest in high yield from income investors as higher yields push less volatile alternatives to offer competitive interest rates.
BDC vs Bond Yields
In the low interest rate environment we saw before 2022, yields on all BDCs were appealing compared to the alternatives. For many income investors, that has changed, putting strain on BDC share demand.
Author, SEC, Yahoo Finance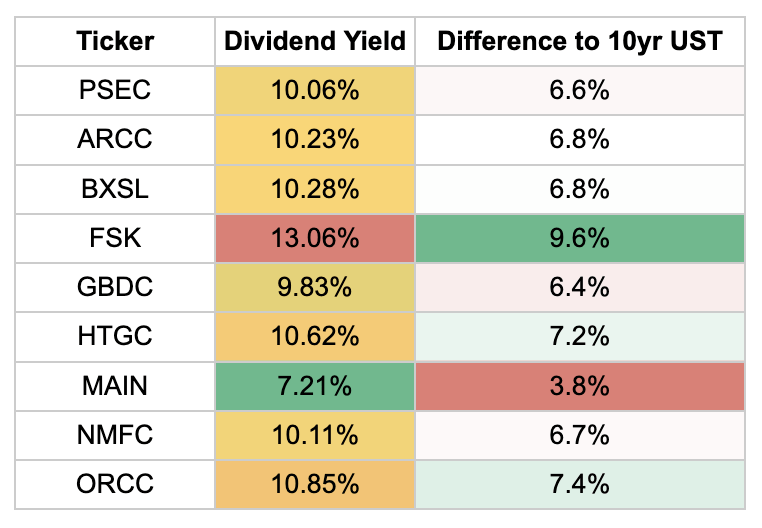
For the most aggressive yield chasers, a 10-year yield of 3.45% is hardly a real competitor to BDCs. However, not all income investors seek the highest yield, and a large spread between a BDC yield and Treasuries is necessary to compensate for the risk one takes on by investing in BDCs instead of a U.S. Treasury.
On this metric, FSK and ORCC are the most compelling options, particularly considering the 35.4% discount to NAV for the former and ORCC trades at an 18% discount to NAV (PSEC, at a 28.5% discount to NAV, is in between these two).
While PSEC is not the most compelling yield from this metric, it is definitely middle of the pack and much more compelling than Main Street Capital (MAIN). However, that smaller delta is well justified.
Past Performance Versus BDC Peers
PSEC is heavily discounted versus MAIN’s 38.8% premium to NAV, indicating market confidence in the latter exceeds that of the former. Past performance justifies this.
YCharts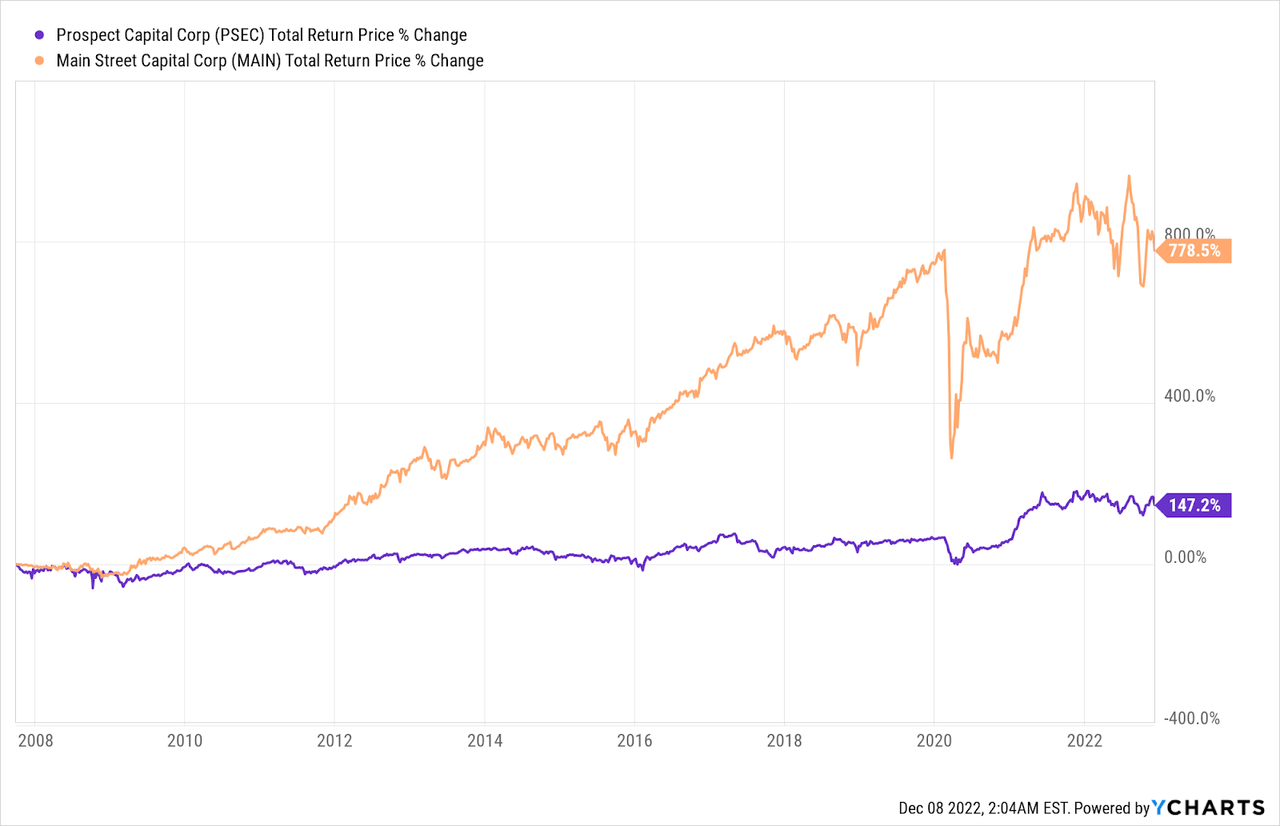
However, that massive outperformance is old news; PSEC has been beating MAIN at the market for years.
YCharts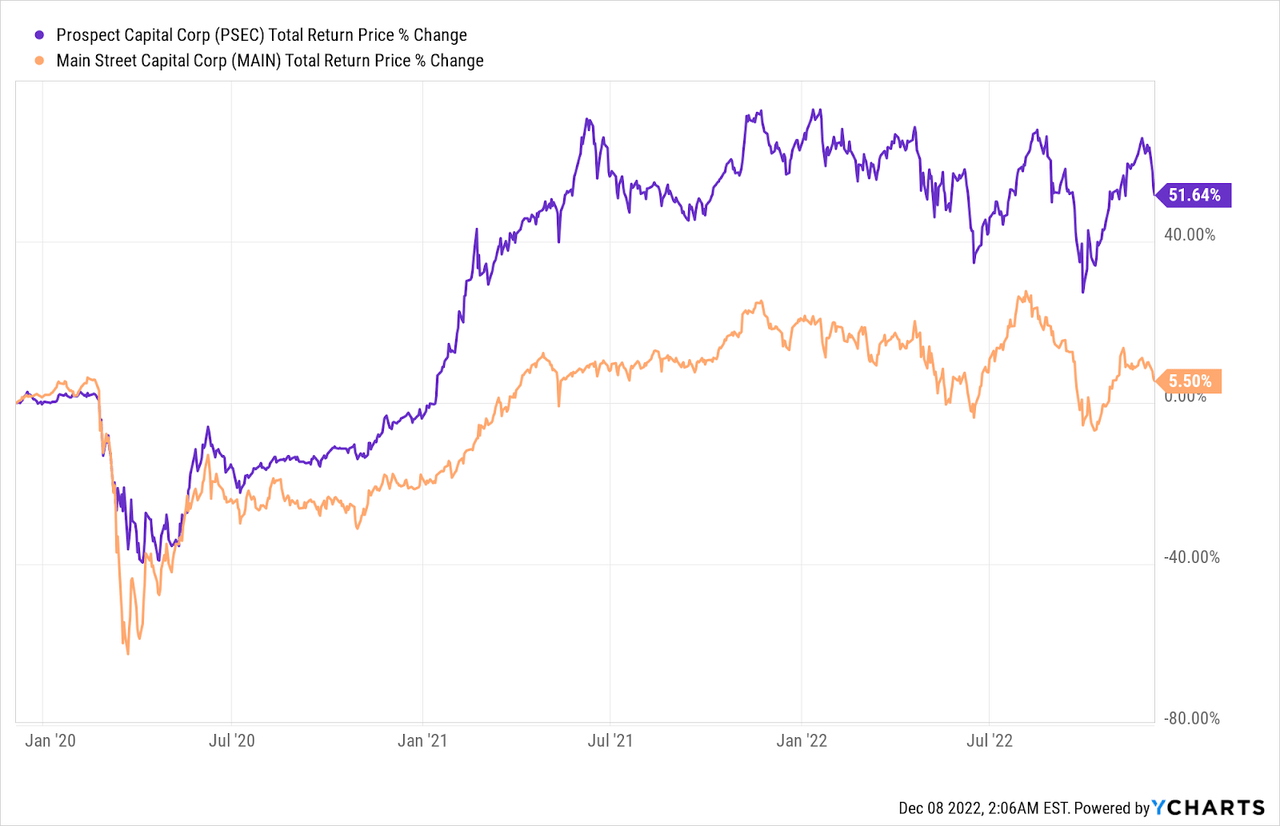
MAIN has also struggled more than PSEC in 2022 in the market despite MAIN’s YTD growth of NAV by 2.6% and PSEC’s 5.6% NAV decline. This indicates that the majority of PSEC’s recent strength has to do with its discount bottoming out (see “NAV and Valuation Trends” below for further discussion).
PSEC’s long-term underperformance is not limited to just MAIN, the best-performing BDC for long stretches of its history. Similarly, all of the large BDCs that have existed for a decade or more have outperformed PSEC, except for Golub Capital BDC (GBDC), which has very slightly underperformed PSEC.
YCharts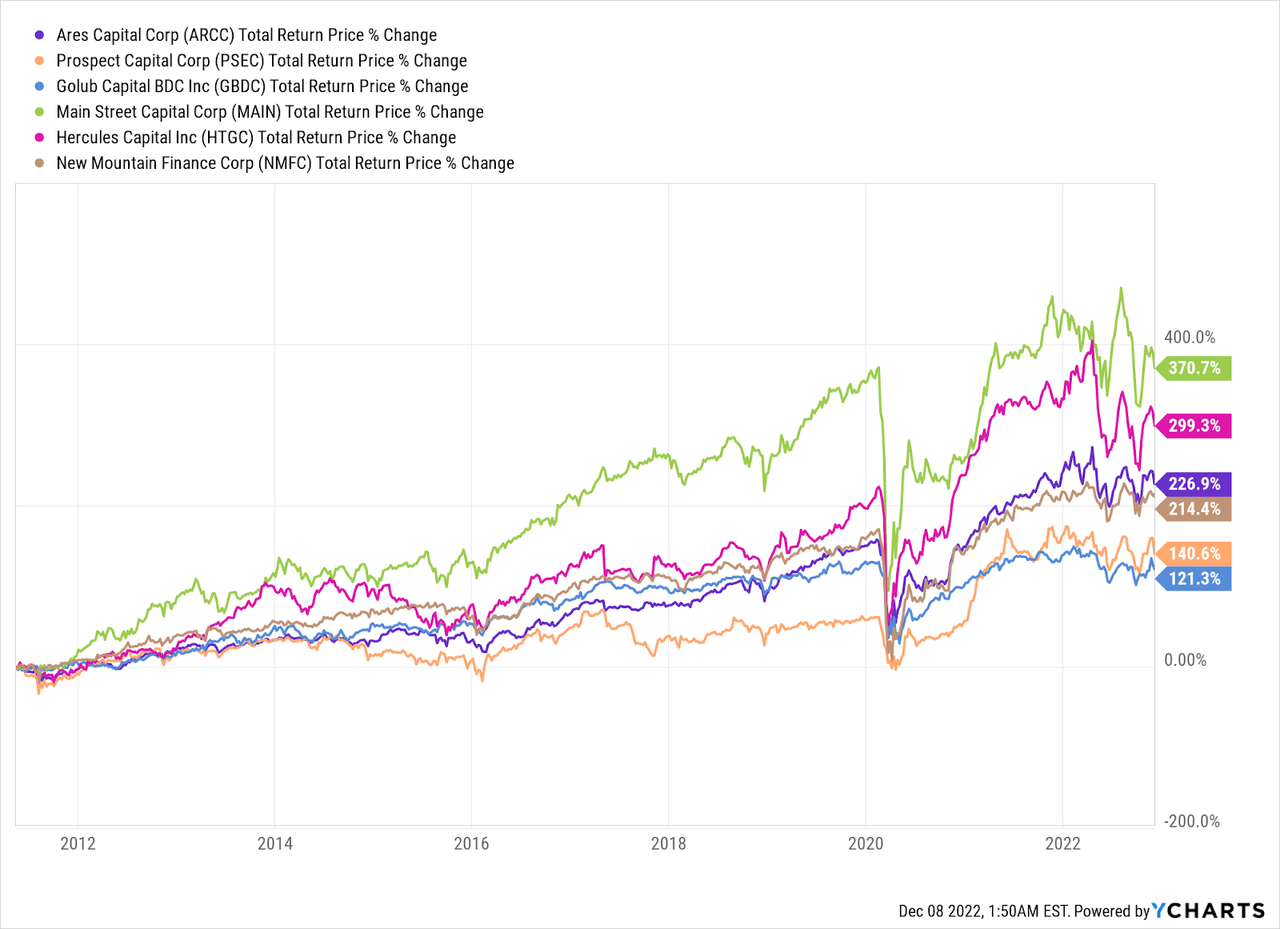
Newer funds are harder to compare, as they lack the data for us to see how they would perform in either a non-pandemic or non-rising-rate environment. However, comparing them indicates that either the new crop is less competitive, PSEC’s fundamentals are improving, or PSEC is benefitting from the large discount being closed more than the competition.
YCharts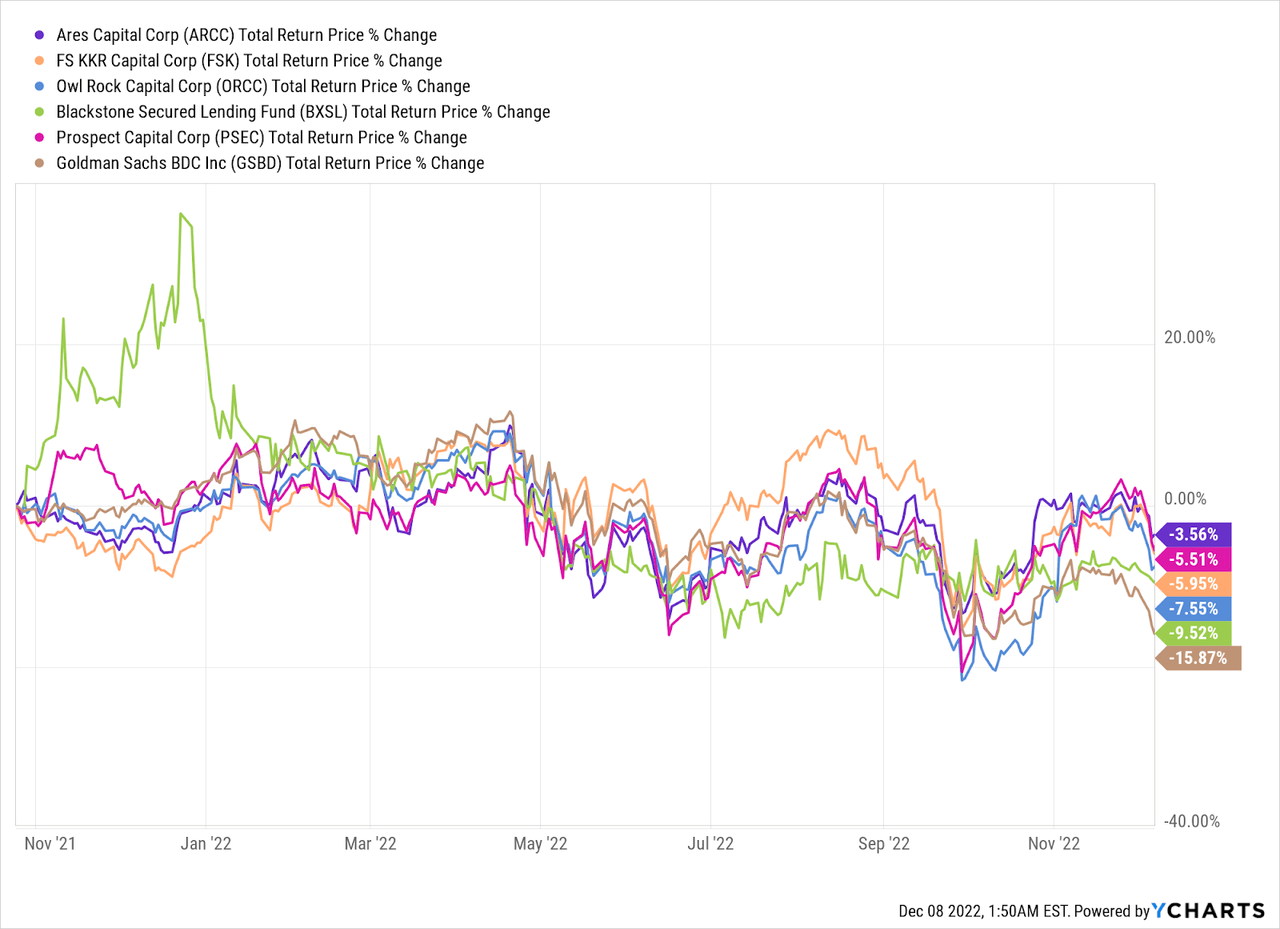
In any case, a quick look at past performance indicates PSEC’s inferiority and the justification of a large and sustained discount to NAV in the future.
Investment Makeup and NII Trends
New buyers to PSEC may be depending on a change in management or investment strategy to help boost performance.
PSEC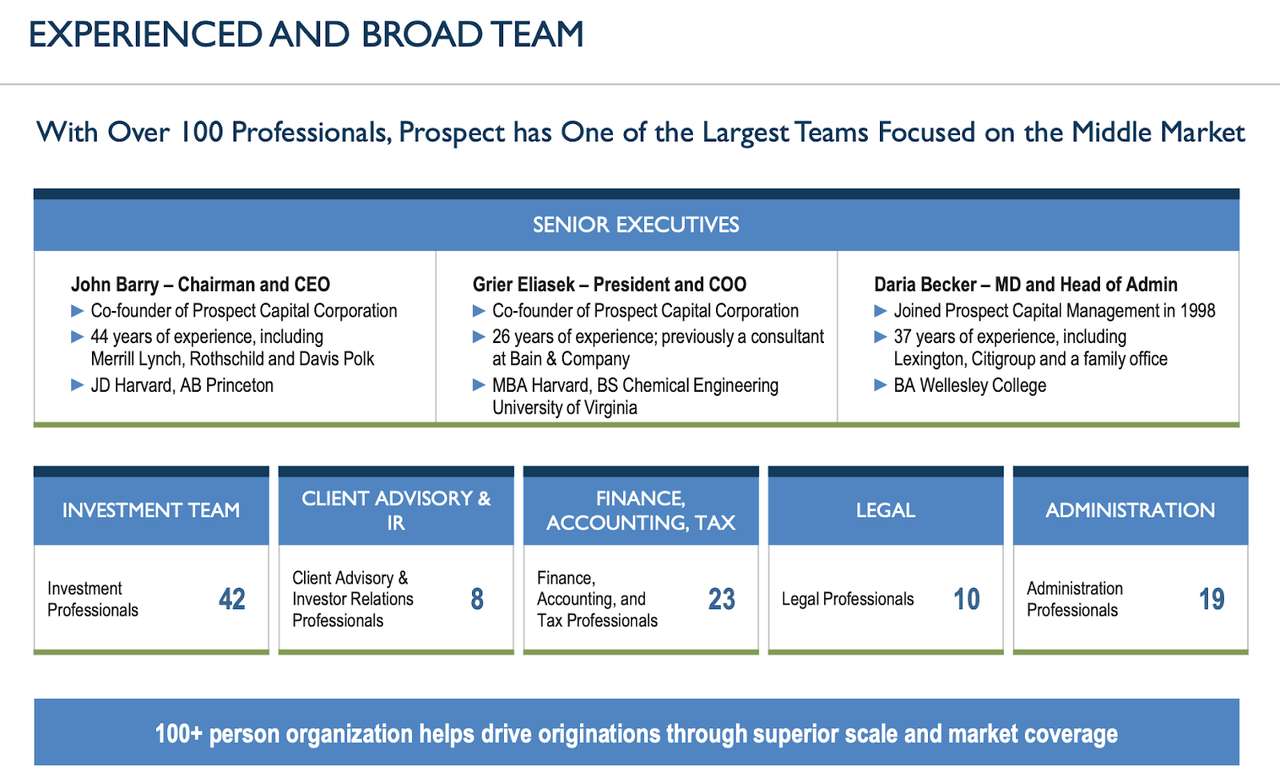
However, PSEC’s management and investments haven’t changed over the years; John Barry and Grief Eliasek remain at the helm and, despite significant growth in managed assets and headcount, there’s little to suggest much has changed in the firm’s focus and philosophy.
One of the biggest developments in PSEC, and one that makes it stand apart from other BDCs, is its growth of an internally managed private REIT: NPRC (National Property REIT Corp.), which is a heavily leveraged portfolio of $4 billion worth of “multifamily, senior living, and student housing properties”, although this is mostly multifamily houses. It is also heavily levered; PSEC’s equity stake in NPRC (and its other real estate holdings) is worth $1.2b.
That heavy concentration is a worry, and further due diligence is necessary, particularly since NPRC’s disclosures are light on detail – a luxury it has as a private firm, but also a risk that deserves discounting by PSEC shareholders.
NAV and Valuation Trends
Prospect Capital has been able to boost NAV significantly throughout 2020 and 2021, thanks to low borrowing costs helping the firm ramp up originations and its real estate investments:
Author, SEC, PSEC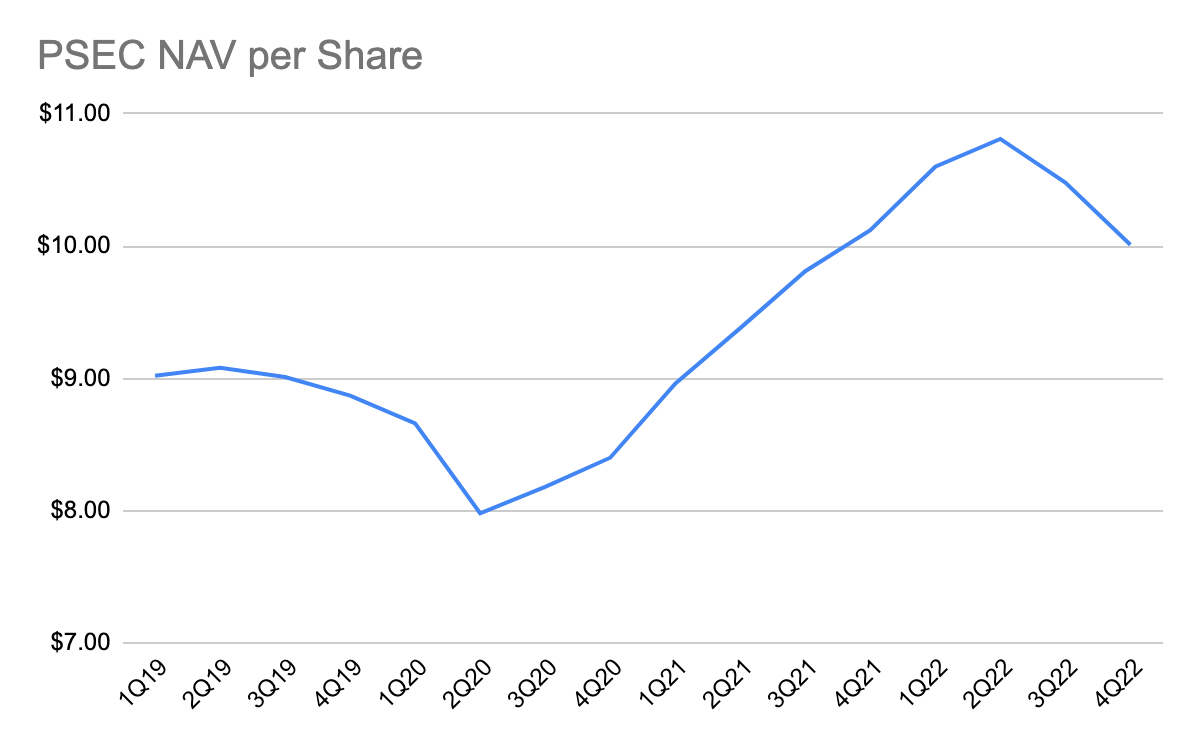
There are two ways to think of this; on the one hand, PSEC had very low borrowing costs during this period, such as when PSEC issued $300 million in seven-year notes (due 2028) at 3.437%; PSEC has used this money to expand its middle-market financing and real estate investments. For the latter, a boom in MTM valuations partly explains the chart above, and the future value of multifamily real estate is essential to determine whether this NAV is at risk of a real estate downturn due to high rates in the near term – or at risk of greater vacancies due to weak demand as real estate prices fall.
Similarly, PSEC has $1.7 billion in the CLO market, which is larger than its real estate holdings and even more than its middle-market lending/buyout arm, which has $1.5 billion in equity and debt in various private firms. CLOs have had a great 2022 thanks to rising interest rates, so this is another factor in the chart above.
However, real estate market prognostication and CLO tea leaf reading is not all that is needed to determine PSEC’s future growth potential. PSEC has been gorging on debt to grow, and higher rates are a significant risk. PSEC recently celebrated over $1 billion in total preferred stock offerings while its revolving debt on SOFR+2.05% has soared in costliness.
YCharts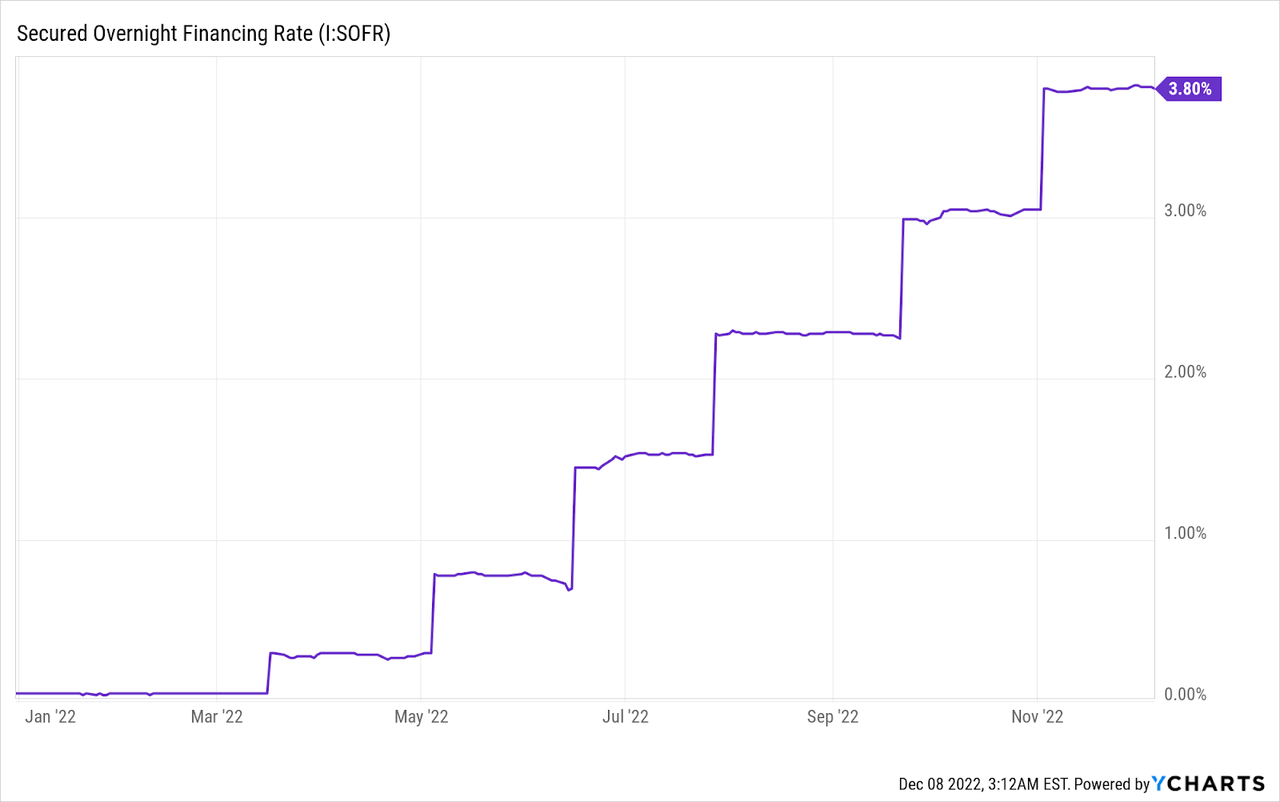
With $800m in outstanding debts on the revolving credit facility, this line item alone is now a $46.8m annual expense with a 5.85% cost of capital, and more aggressive preferred issuances could negatively impact NII even further. We have already seen NII/NAV per share slowly decline over the years despite lower borrowing costs in 2020 and 2021 which could have theoretically boosted this metric significantly.
Author, SEC, PSEC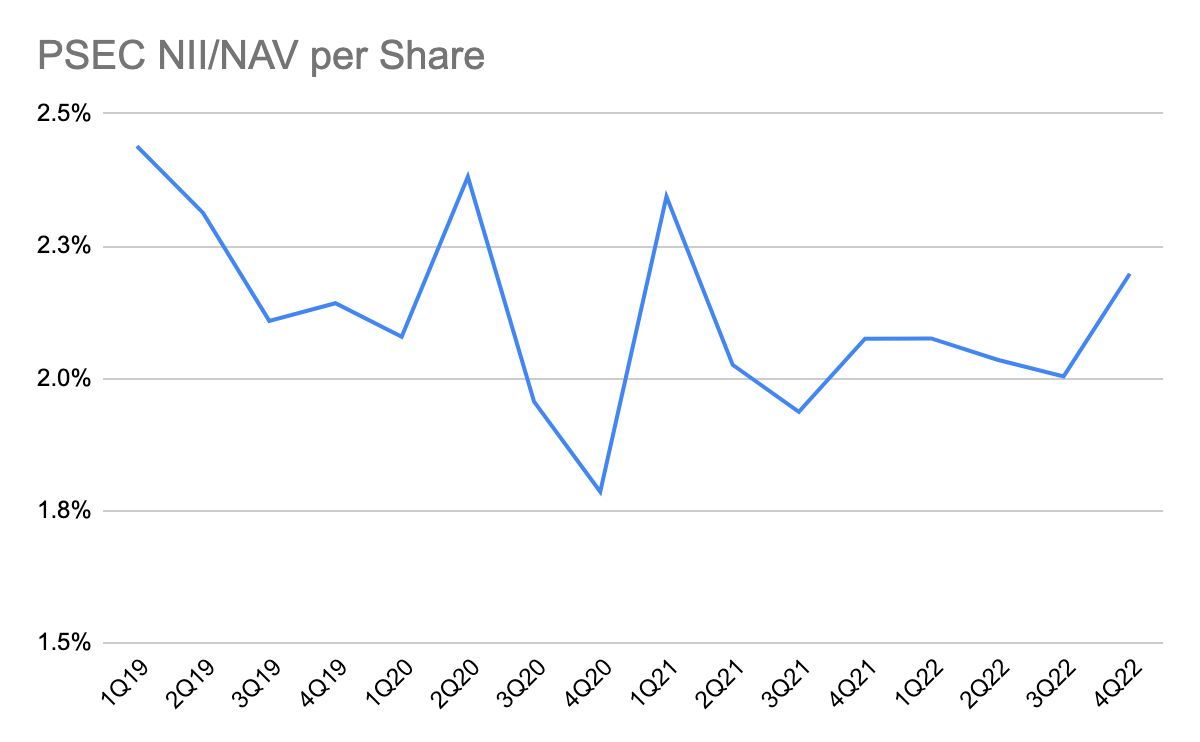
A growing NAV, particularly if this is driven by larger real estate investment, should see a rising NII as a result. This is particularly the case if NPRC’s IRR is 25.2%, as Eliasek said in the firm’s most recent earnings call. That IRR has been rising (good for NPRC) as NPRC’s assets under management has risen (good for PSEC’s management), but payouts to investors (NII/NAV and NII per share) have not improved.
Author, SEC, PSEC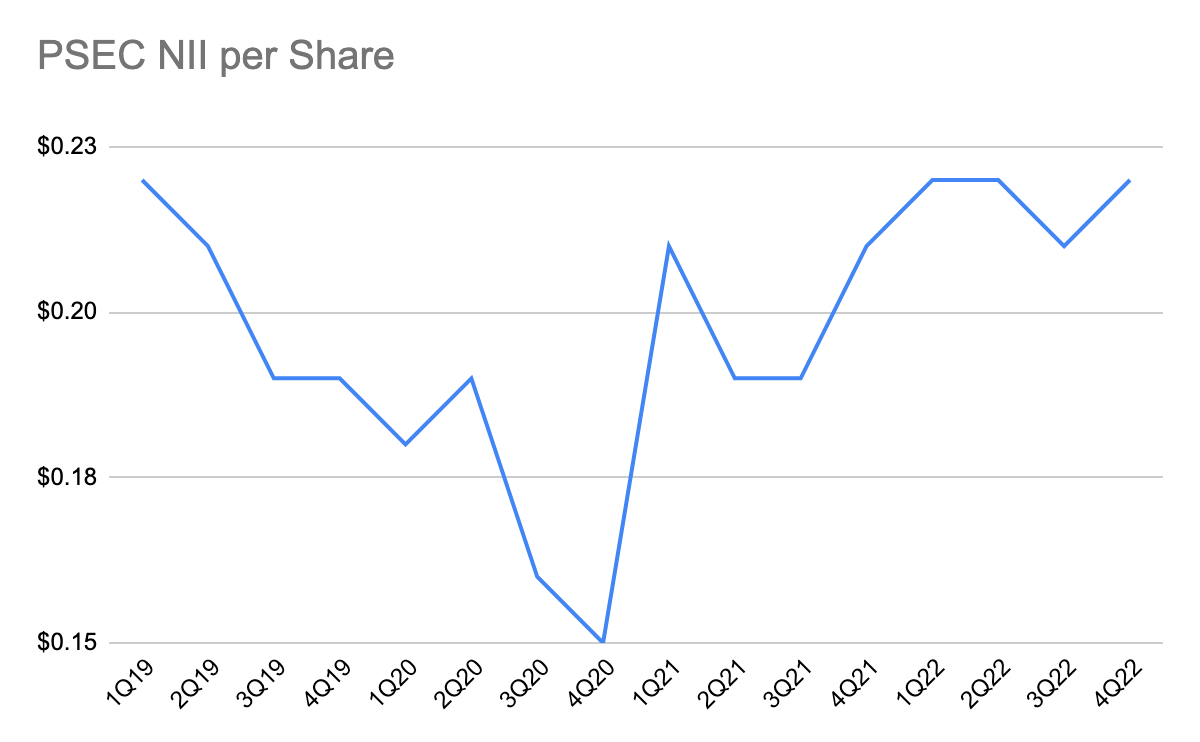
In late 2020, investors had to tolerate a declining NII on the theory that PSEC’s expansion would help NII per share exceed 2019 levels. In reality, NII per share has remained stagnant over the last four years.
Further Issues for Consideration
Lest this get too long and detailed, there are other issues to consider before dipping into PSEC. The most important for me would be:
Debt-Asset Ratio
PSEC has spent a very long time aggressively expanding AUM to boost fees for management and achieve economies of scale to boost overall IRR and, thus, NII to shareholders. NII hasn’t improved in four years, so a better question to ask is whether PSEC’s very aggressive expansion has hurt the balance sheet. With a 35.9% D:A ratio at the moment this seems like a minor issue, but keep in mind that a significant amount of PSEC’s assets are hard to value. Furthermore, a breakdown of PSEC’s long/short-term debt ratios could push an investor to be more lenient here; PSEC’s use of revolving and long-term debt has provided it time and space to maintain payments throughout its history and through several black swan events like the pandemic, but PSEC has also not faced interest rates as high as today.
Cost of debt and WACC
PSEC looks like it is expanding as aggressively and swiftly as the last time I looked at this company in 2015, but then its low cost of debt allowed that expansion to continue, and the rising rate environment was not as difficult as today. To make profitable investments, PSEC will need to find IRRs about 6% and that IRR needs to materialize in the form of cash, not capital gains. As PSEC gets more dependent on NPRC, a breakdown of income flowthrough and of rental potential from this large and growing investment is essential.
NPRC and its Exposure
With an 89% focus on multifamily housing, PSEC is quietly turning into a landlord. Further insight into the types of properties and their target audience is essential. NPRC says it has “equity investments in 62 properties in 51 cities, across 21 states, aggregating more than 20.9 million rentable square feet and more than 23,000 units”.
NPRC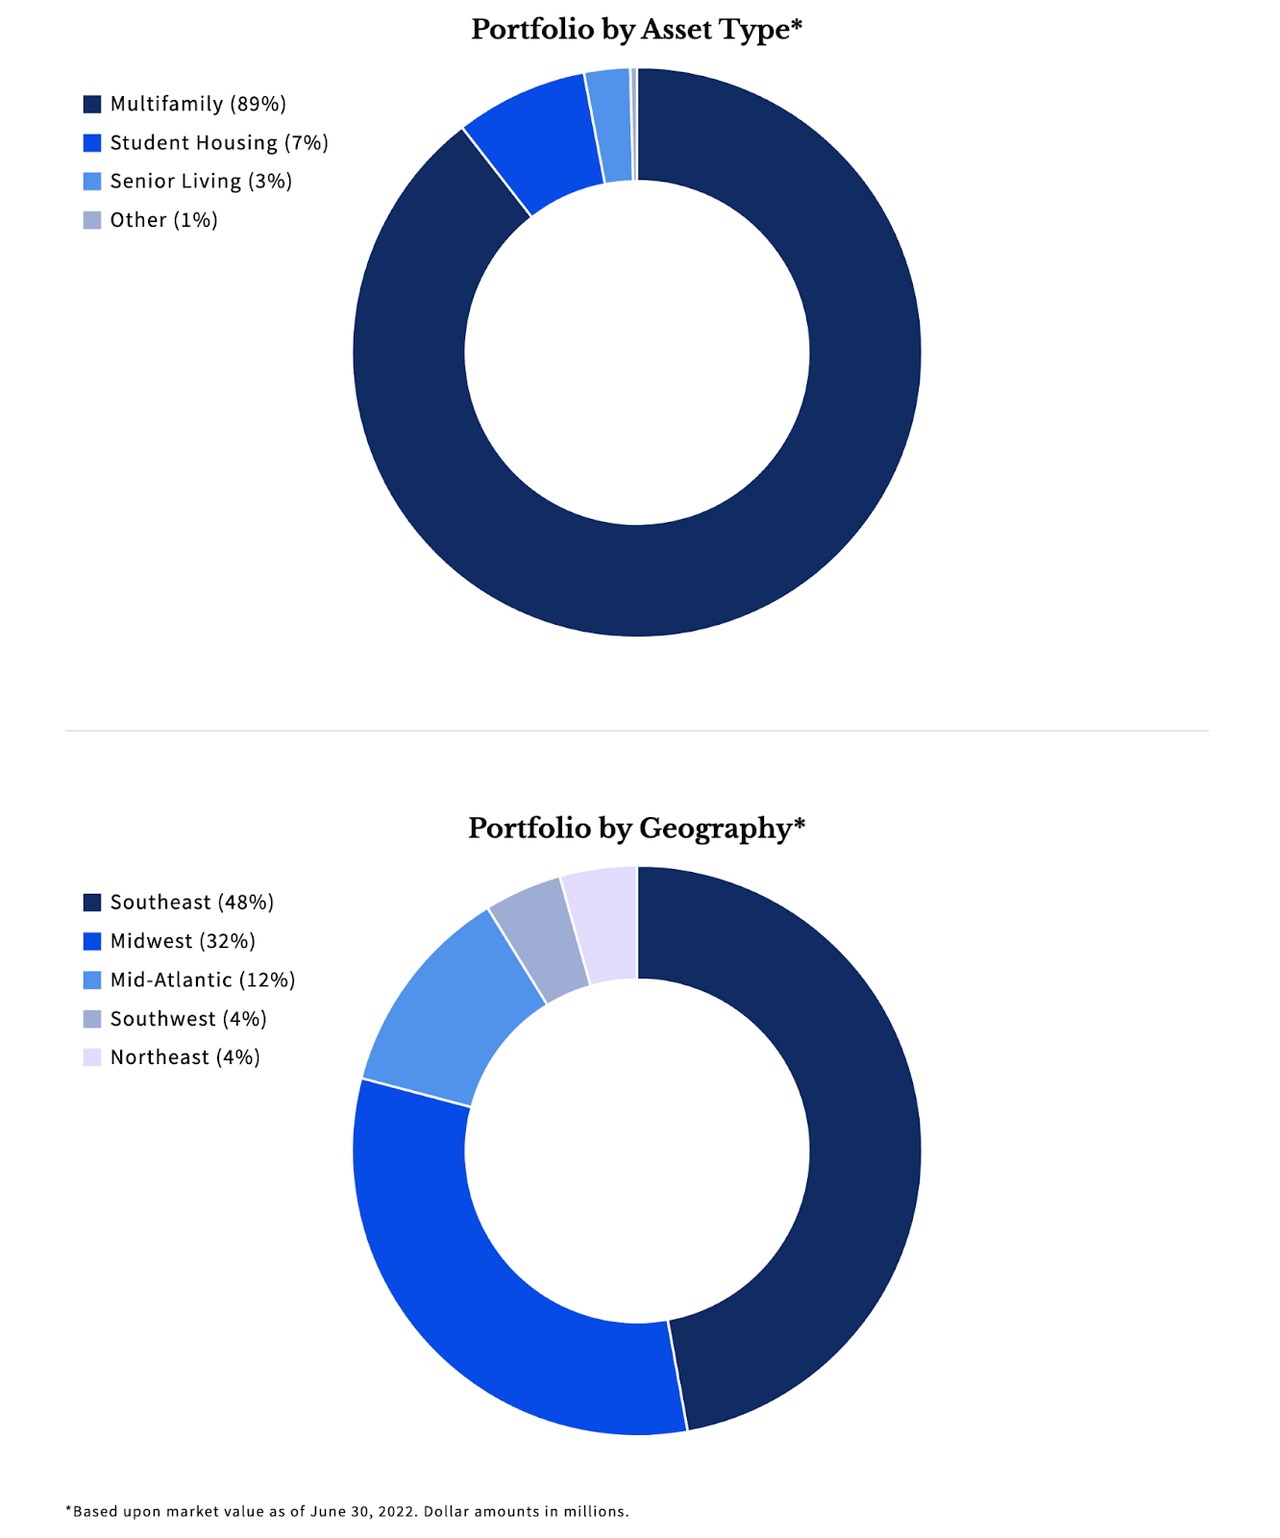
Determining the cap rates for those properties and their local exposure is essential for determining whether this REIT makes PSEC over or undervalued.
Opex and Capex
In their last earnings statement, PSEC boasted it had one “of the largest teams in the industry focused on middle market lending,” including over a hundred professionals. Headcount, particularly in finance, is expensive, and a deep dive into PSEC’s organizational structure and dealmaking pipeline could possibly help predict future NAV and IRR trends.
Conclusion
An initial look at PSEC says that, despite its large discount to NAV, it is seeing a bit of a short-term revival because of improvements to NAV that are opaque and dependent upon an increasingly risky real estate and apartment rental market. To jump into PSEC, one would need to dig into its financials further, but this current snapshot indicates that PSEC remains uninvestable until further clarity about its real estate holdings and how much of its future returns can be realized in NII-and how much of those future returns depend on MTM valuations as opposed to actual realized gains.
Be the first to comment