

sefa ozel
Recently, I reviewed the ProShares UltraPro Short 20+ Year Treasury ETF (TTT), recommending investors take profits as long-term yields appear to be heading lower. This article looks at TTT’s larger sibling, the ProShares UltraShort 20+ Year Treasury ETF (NYSEARCA:TBT), with $1.1 billion in assets.
While betting on rising long-term yields have been the right trade for most of 2022, I believe it is time to exit the short-bonds trade. Long-term interest rates appear to be inflecting lower as investors bet on an impending recession. Holding inverse levered ETFs like the TBT for the long-term is a recipe for disaster, as demonstrated by the fund’s poor long-term return history.
Fund Overview & Strategy
The ProShares UltraShort Short 20+ Year Treasury ETF seeks daily returns that are -2x the return of the ICE U.S. Treasury 20+ Year Bond Index (“Index”). The index measures the performance of U.S. dollar-denominated, fixed rate treasury bonds with minimum term to maturity greater than 20 years. TBT aims to generate positive returns when long-term interest rates rise, and treasury bond prices fall.
The TBT ETF achieves its -2x daily exposure target through total return swaps with investment banks that are reset nightly.
Readers interested in the mechanics of levered ETFs are encouraged to take a look at some of the other articles I have written. The two key concepts to understand are that levered ETFs have “positive convexity” in the direction of their bet, and “negative decay” from volatility and the daily reset of exposures.
Portfolio Holdings
TBT’s holdings consist of total return swaps with major investment banks like Goldman Sachs and Bank of America. The fund holds -200% of assets in total return swaps, and own treasury bills (i.e. cash) to settle accounts with the banks (Figure 1).
Figure 1 – TBT ETF holdings (proshares.com)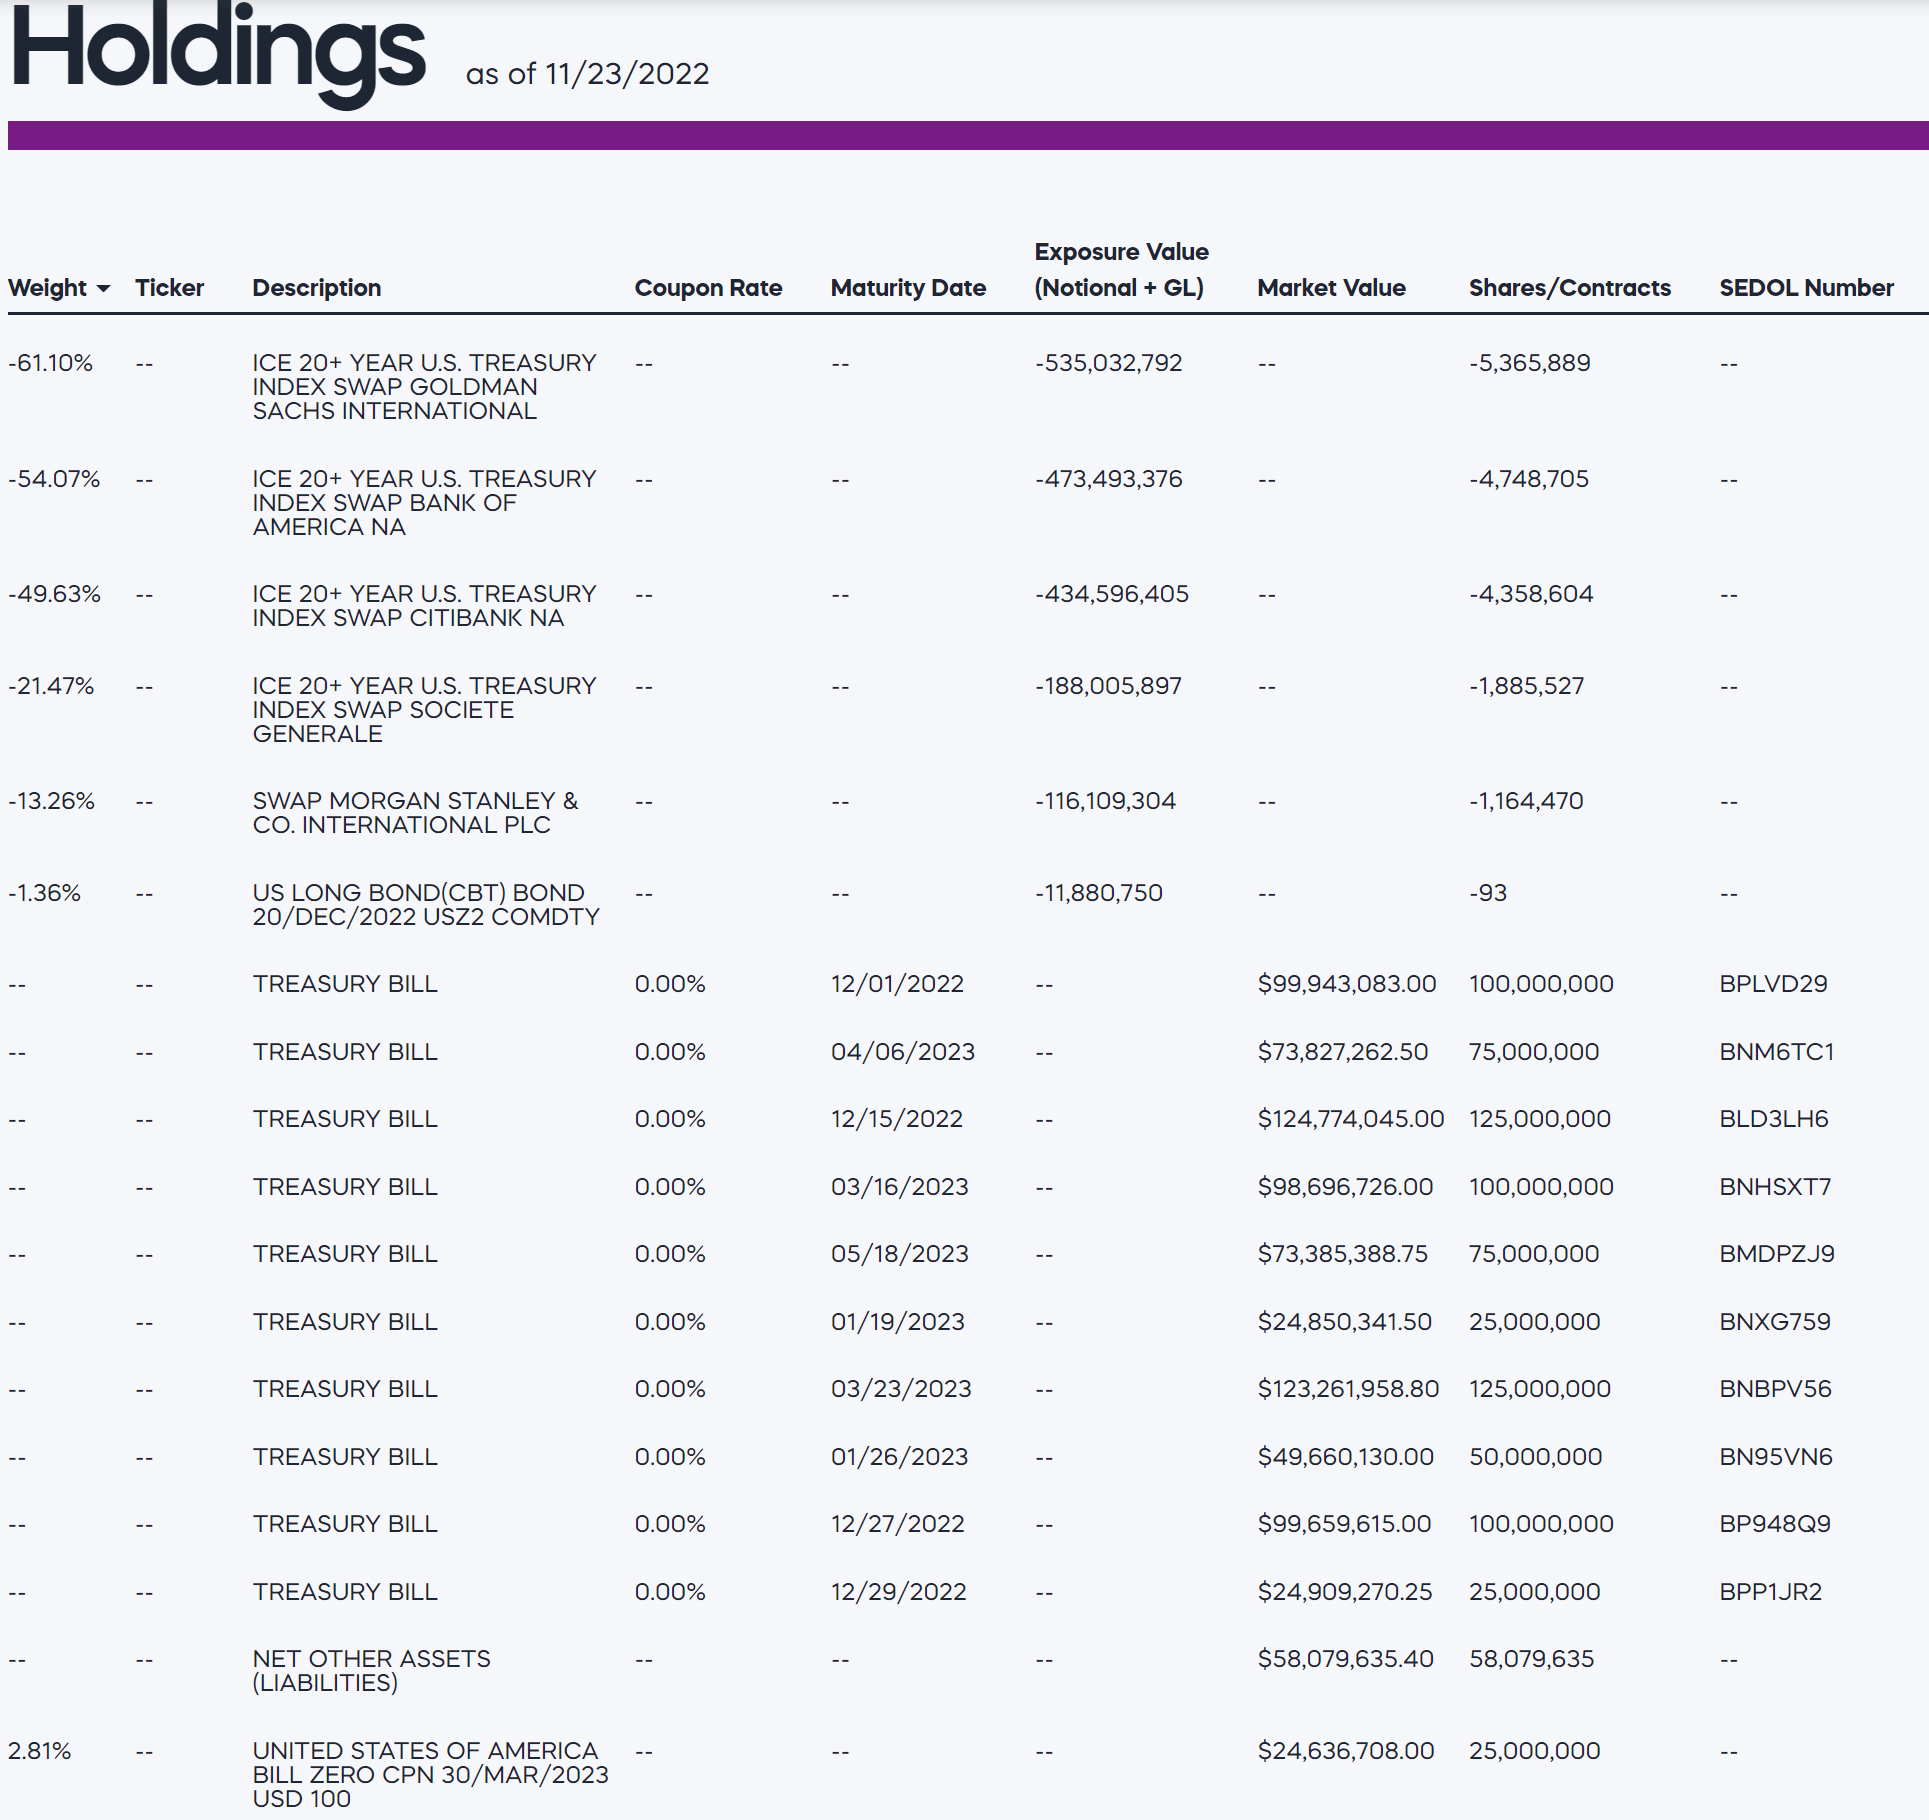
Returns
TBT has had a good 2022 so far, with YTD returns of 113.0% to October 31, 2022 as long-term interest rates have risen in response to soaring inflation and Federal Reserve rate hikes (Figure 2).
Figure 2 – TBT ETF returns (proshares.com)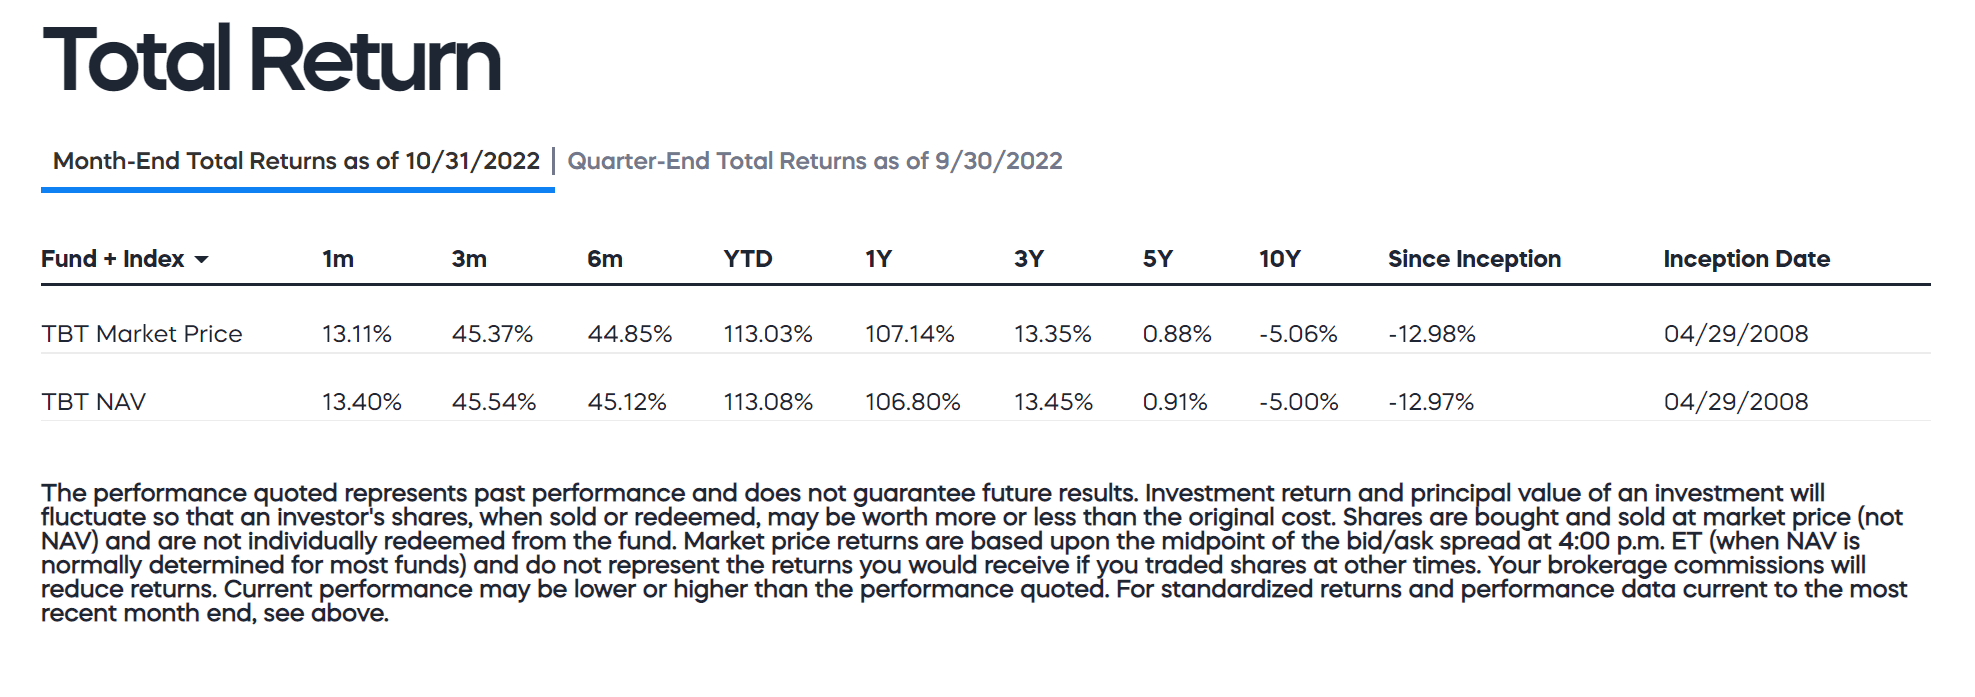
Similar to the TTT ETF, TBT’s YTD return have outperformed the inverse of the underlying index, due to the ‘positive convexity’ effect. YTD, the TBT ETF has returned 82.7% to November 25th, 2022 more than -2x the -30.3% return of the underlying index, as represented by the iShares 20+ Year Treasury Bond ETF (TLT) (Figure 3).
Figure 3 – TBT returns vs. TLT and TTT (Seeking Alpha)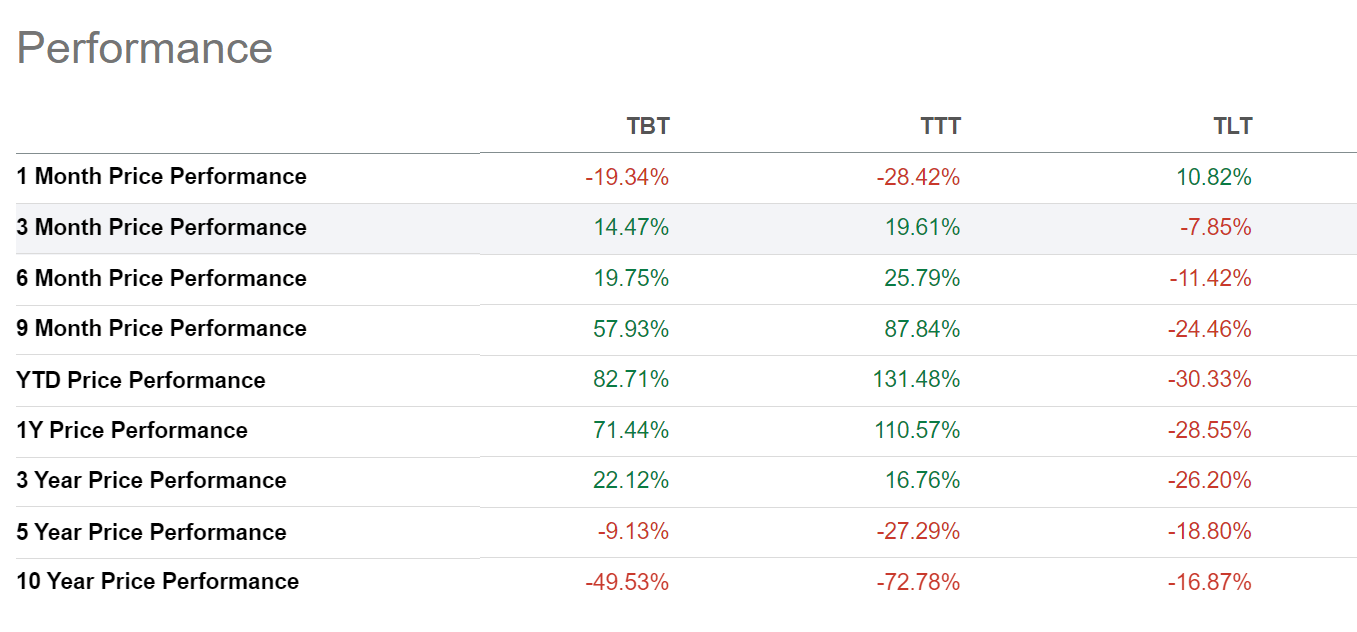
Also similar to the TTT, the TBT ETF have terrible long-term performance due to ‘negative decay’, with 10 year cumulative price return of -49.5% while the TLT has lost 16.9%.
Distribution & Yield
The TBT ETF does not pay a distribution.
Fees
The TBT ETF charges a 0.89% expense ratio.
Why Long-term Treasury Yields May Be Peaking
Figure 4 shows the U.S. 10 year treasury yields, which has a bearish ascending wedge pattern.
Figure 4 – US 10 Year treasury yields have a bearish ascending wedge pattern (Author created with price chart from stockcharts.com)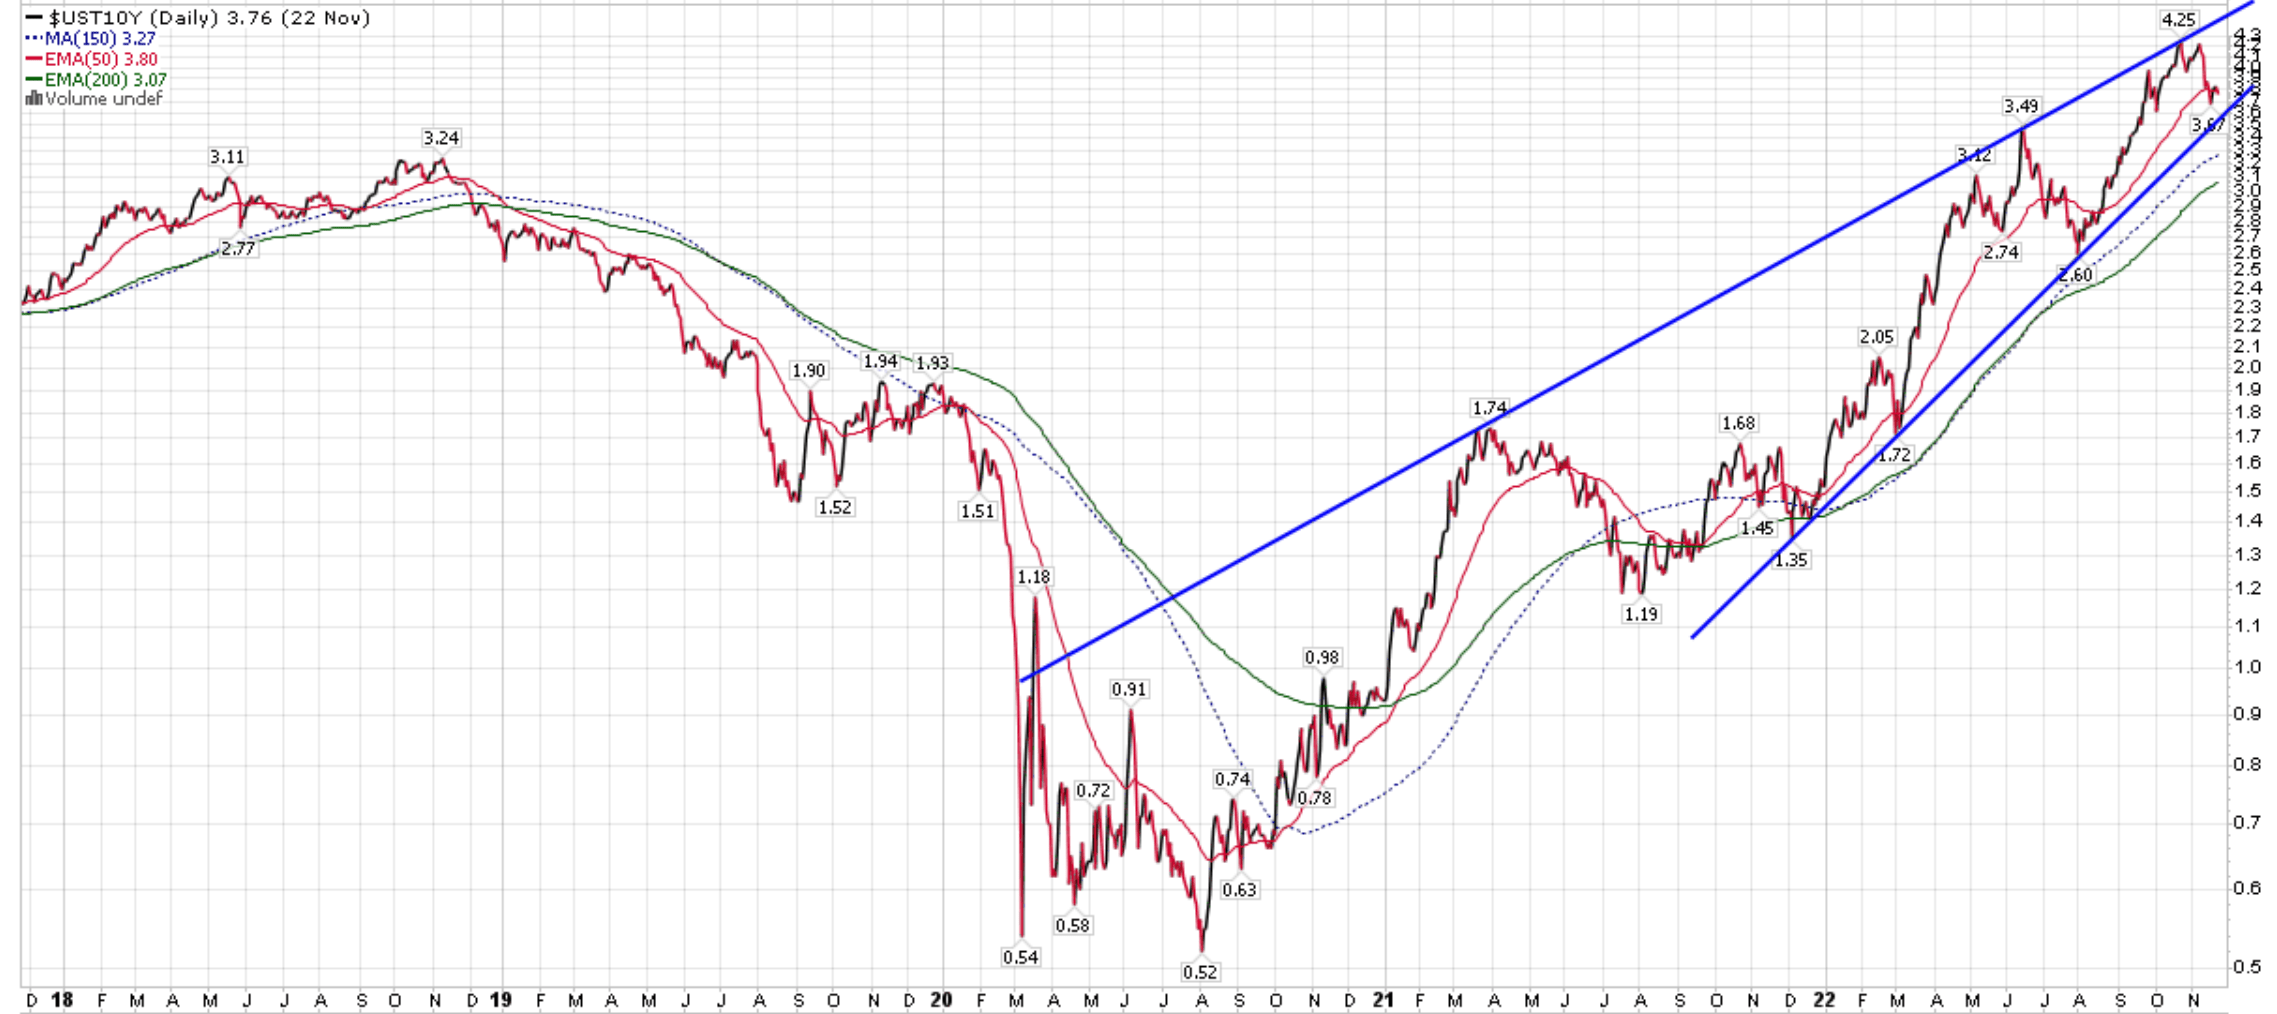
In my TTT article, I wrote:
While TTT’s performance had been outstanding YTD to October 31, the fly in the ointment is that the fund has suffered a 30%+ drawdown in the last few weeks, as long-term interest rates have backed off their highs.
Long-term yields have eased in recent days because economic conditions continue to deteriorate, with many signs pointing to a potential recession in 2023. For example, the recent S&P Global Flash U.S. Composite PMI readings of 46.3 was a big miss to consensus and is “consistent with the economy contracting at an annualised rate of 1%”, according to S&P Global Market Intelligence’s Chief Business Economist.
I realize some readers may not be familiar with relationship between interest rates and recession probabilities and may be wondering what the fuss is all about. To understand the concepts, let’s take a step back and think about interest rates and what they represent.
Yield Curve Inversions Portend Recessions
Short-term interest rates represent what investors believe will happen to central bank monetary policies in the near future; i.e., when investors expect the Federal Reserve to tighten monetary policy and raise the Fed Funds rate, they increase short-term treasury yields like the 3-month and 1-year tenors.
Longer-dated treasury yields represent investors’ best guess of where interest rates are headed over the medium to long-term, driven by inflation and growth expectations.
When an economy is slowing and inflation expectations decline, yields on long-term bonds tend to fall, as investors bet that that central banks will have to lower borrowing costs in the future to spur growth. In extreme cases, long-term interest rates can even fall below short-term interest rates, in a phenomenon called ‘yield curve inversion’.
Recently, the yield curve on U.S. treasuries has been flashing a giant warning signal, with the 3M-10Yr yield curve inverting, as investors have bid up long-term bonds (lowering their yields), while near-term Federal Reserve rate hike expectations keep increasing short-term bond yields (Figure 5).
Figure 5 – 3M-10Yr yield curve inverted (Axios)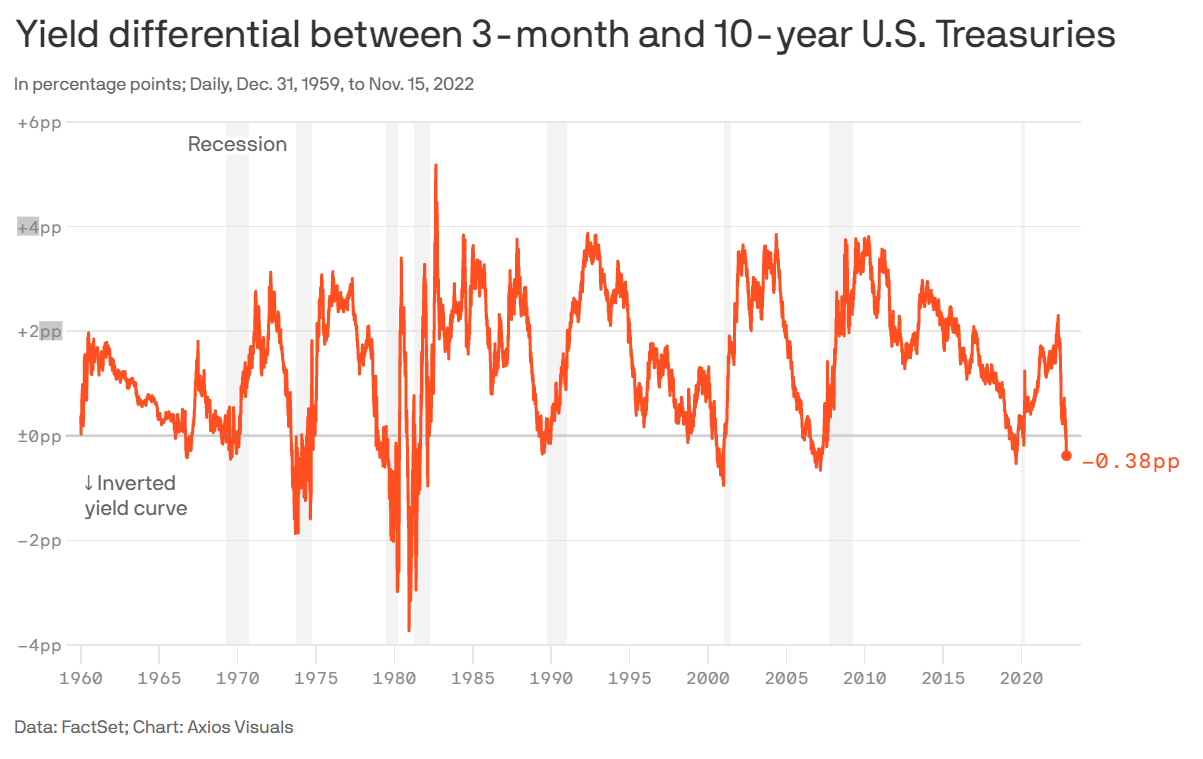
Importantly, if we look at Figure 5, 3M-10Yr yield curve inversions have a strong correlation with recessions, dating back to the 1970s. According to a Bank of International Settlements research paper, the current level of 3M-10Yr yield curve inversion (-70 bps) suggests a 40-50% probability of a recession in the next 4 quarters.
The Conference Board, using a combination of indicators and factors, predict a 96% probability of a U.S. recession in the next year (Figure 6).
Figure 6 – Conference Board predicts a 96% probability of a recession (Conference Board)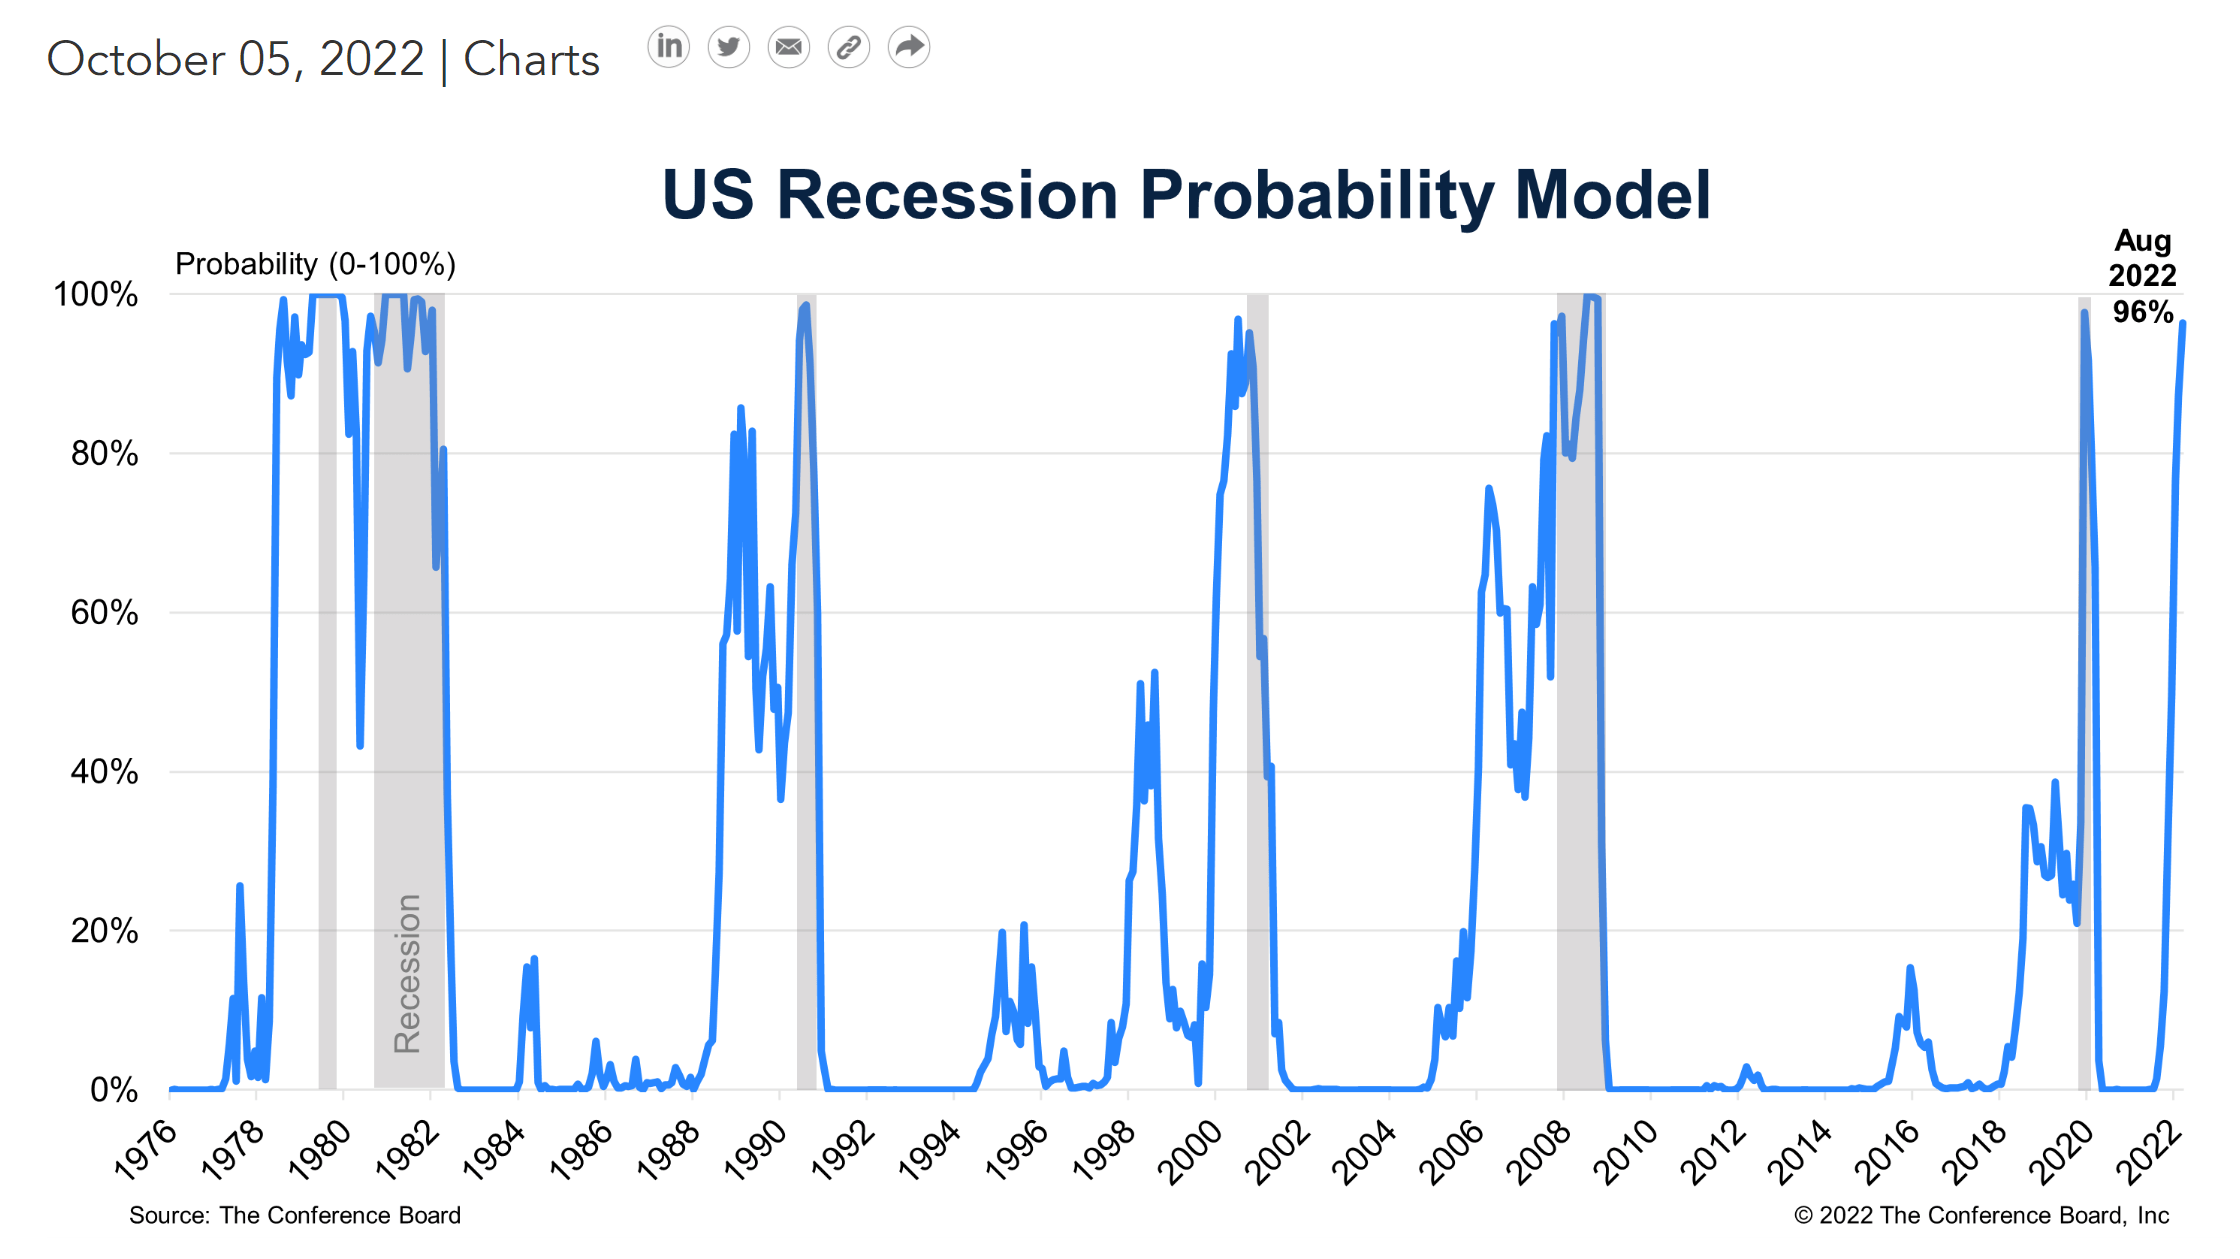
Conclusion
While betting on rising long-term yields have been the right trade for most of 2022, I believe it is time to exit. Long-term interest rates appear to be inflecting lower as investors start to price in an impending recession. Holding inverse levered ETFs like the TBT for the long-term is a recipe for disaster, as demonstrated by the fund’s poor long-term return history.
Be the first to comment