

Laser1987/iStock Editorial via Getty Images
Introduction
This is the fifth episode of a series that I introduced in this article: “Learning From Buffett About Investing In Railroads: The BNSF Case Study“.
Many have read it, but if you still haven’t I highly recommend reading it because it explains thoroughly what I have found out about the way Warren Buffett thinks about the railroad Berkshire owns. I have outlined the general mind-frame Mr. Buffett had developed to understand and assess the railroad business. Since through Berkshire he owns BNSF, we can learn from him as we assess the publicly traded railroad companies to see if we can find an opportunity that will lead to results similar to the ones he is achieving with his investment.
A key point is that through this series we take into account a certain number of factors that are not always the first ones to think about when looking at a company’s financials.
Now, it is finally time to go West and look at Union Pacific Corporation (NYSE:UNP).
The company
Network and sources of revenues
Union Pacific Corporation owns and operates Union Pacific Railroad Corporation that connects 23 states west of the ideal line that connects Chicago to New Orleans and that, for most of its course, runs along the Mississippi River. This area sees many of the fastest-growing U.S. population centers. As we know, in fact, there is a major trend that see American population shift from the east towards the west. Union Pacific operates from all major West Coast and Gulf Coast ports to eastern gateways and connects with Canada’s rail systems. It is also the only railroad serving all six major Mexico gateways, which is key advantage as we see Mexico becoming a new manufacturing hub for the North-American continent. We can see all this from the map that I report below.
Union Pacific Website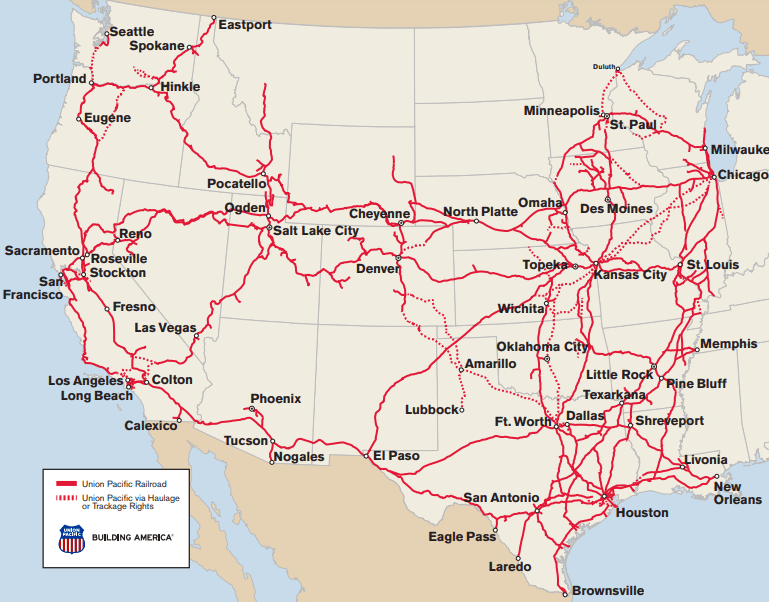
The company divides its freight revenues into three groups: premium, bulk and industrial. Bulk consists of grain and grain products, fertilizer, food and refrigerated, and coal and renewables. In 2021 bulk generated 31% of total freight revenues.
The industrial group consists of categories such as construction, industrial chemicals, plastics, forest products, specialized products (primarily waste, salt, and roofing), metals and ores, petroleum, liquid petroleum gases (LPG), soda ash, and sand. Transportation of these products accounted for 36% of Union Pacific freight revenues in 2021.
The last group is premium that includes finished cars, automotive parts, and merchandise in intermodal containers, both domestic and international. It accounted for 31% of 2021 total freight revenues. Now, regarding the shipments on finished cars, the company declares in its annual report the following words:
We are the largest automotive carrier west of the Mississippi River and operate or access 38 vehicle distribution centers. The Railroad’s extensive franchise serves five vehicle assembly plants and connects to West Coast ports, all six major Mexico gateways, and the Port of Houston to accommodate both import and export shipments. In addition to transporting finished vehicles, the Company provides expedited handling of automotive parts in both boxcars and intermodal containers destined for Mexico, the U.S., and Canada.
For Union Pacific, the main railroad competitor is Burlington Northern Santa Fe LLC, whose primary subsidiary, BNSF Railway Company (BNSF), operates parallel routes in many of the same main traffic corridors Union Pacific operates in. We will have to look at Berkshire to see how BNSF is performing and assess who is doing better in this area of the country.
Let’s look at a few numbers from the last fiscal year, just to get an idea of what the company has been up to in recent years. In the image below the top-line data is missing: in 2021 the company’s total operating revenues came in at $21.8 billion, up 11.6% versus 2020 and about 0.5% more versus 2019.
Let’s move now to the graphs shown below. As we can see, all its main financial results are moving in the right direction, starting from the operating ratio which makes the company rank in second place after CSX, which, at the end of 2021 reported an operating ratio of 55.3% at the end of 2021. Norfolk Southern performs worse with a 60.1% operating ratio, close to Canadian Pacific’s 59.5% and Canadian National’s 59.3%. As a consequence, operating and net income are moving upwards, coming in at $9.3 billion and $6.5 billion respectively. This leads to increasing EPS and room to grow the dividend while returning cash to shareholders through growing share repurchases as well. Overall, in 2021 the company returned $10.1 billion to its shareholders. Regarding its past ROIC, Union Pacific scores a 16.4% in 2021 against 15.4% of CSX, which was above Norfolk’s 14% and Canadian National’s 14.1% but below Canadian Pacific’s 16.7% (prior to the Kansas City Southern acquisition, which brought the ROIC down to 8.2%).
Union Pacific 2021 Fact Book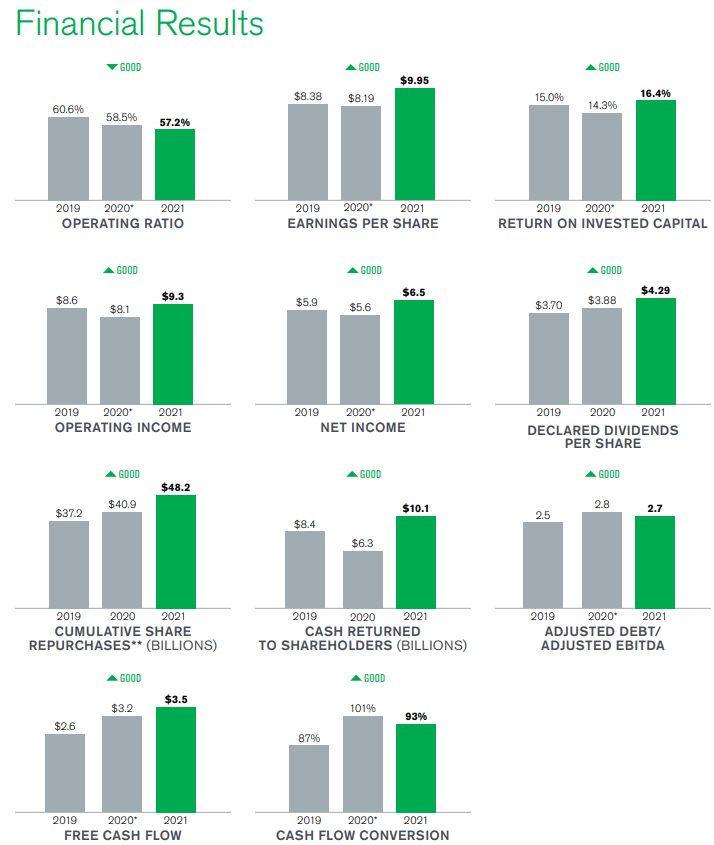
Its debt/EBITDA ratio seems a bit high, but still within the 3 limit. As per free cash flow and cash flow conversion there is nothing to say but applaud the company for its strong performance: $3.5 billion of FCF is a solid result, considering that its capital plan for 2022 was to spend $3.3 billion.
The company owned at the end of 2021 6,204 locomotives and leased another 1,038. The average age is 22.5 which is reasonable; it is in line with CSX and much better than Norfolk’s 27.
Year to date results
Now, in order to know how the company has performed overall, let’s take advantage from the YtD results reported in the Q3 financial report and presented in the quarterly presentation.
Here are some highlights:
Union Pacific Investor Relations Web page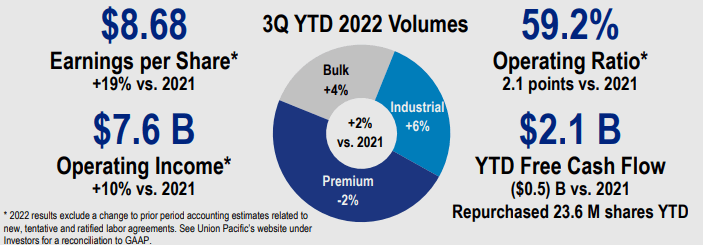
The operating revenue of $17.4 billion is up 16%. No surprise, as we have seen that other railroad operators have achieved similar results thanks to higher fuel surcharge revenue, volume growth, and core pricing gains.
What is interesting is that business volumes were up 3%, while we saw that other companies lost a bit of volumes.
However, Union Pacific’s reported operating ratio was 59.9%, which shows that no one is immune from inflationary pressure led by fuel costs and wage hikes. Adjusted operating income of $2.7 billion was up 13%.
Free cash flow generation, though a bit lower compared to last year, remains strong and allowed the company to repurchase 9.5 million shares in third quarter 2022 at an aggregate cost of $2.1 billion. YtD, the company has repurchased a total of $5.5 billion, which is about a 3.6% of the current market cap.
Earning power
Railroads are capital-intensive businesses. I already pointed out a few times how, at first, Mr. Buffett shunned these companies thinking that they could not provide good returns. However, he changed his mind later on when he realized that the point was not the capex required, but the return earned through this money that is deployed. If the return on the invested capital is decent or even good, then the investment can be worthy of further attention. But before looking at the possible returns, Mr. Buffett makes sure that the company can withstand any economic downturn, no matter how harsh it may be. He does so by looking at the earning power of a company. Since capital-intensive businesses often carry a big debt load, Mr. Buffett looks at how well a company can meet its interest requirements through the money it usually earns. He calculates the earning power with the ratio pre-tax earnings/interest. Pre-tax earnings is calculated by subtracting the operating and interest costs from the gross profit. If we use the TTM data, we get that Union Pacific scores a 7.2. It is above the 6 that Norfolk, CSX, and Canadian Pacific have, but below the outstanding 10.4 that Canadian National is able to achieve last year and that is actually a 13 when we use the TTM data. Nonetheless, it is a ratio that provides quite a bit of safety in case of severe economic slowdowns because it shows that the company has an earning power 7 times greater than its current interest requirements. Only a major disaster that blocked the whole company from operating would lead to bankruptcy.
Efficiency
We have already seen that when we look at the operating ratio, Union Pacific performs rather well as it was able to stay below 60% even in a tough environment for margins as the one we have seen this year.
Let’s then look at fuel efficiency which is a key metric for Mr. Buffett. Here, Union Pacific places itself a bit away from the best performers. While Canadian National consumes on average 0.84 gallons of fuel per 1,000 GTMs, Union Pacific, YtD has a 1.08. However, in the third quarter, the fuel consumption rate decreased to 1.056, an improvement of 1% YoY and 2.2% QoQ. We could be before an improving trend when we consider that in 2020 the rate was 1.11. For comparison’s sake, let’s recall that CSX scores a 0.97, in line with Canadian Pacific, and better than Norfolk’s reported 1.11.
Use of capital: ROIC and shareholder return
In the article that introduced the series, we spent some time understanding how Mr. Buffett is aware that a key point to assess railroads is the return on invested capital. At the end of 2021, Union Pacific reported a ROIC of 16.4% which is currently the best return rate within the industry since Canadian National is at 14.1%, CSX is at 15.4%, Norfolk at 14% while Canadian Pacific is currently at 8.2% due to the Kansas City Southern acquisition (prior to this, Canadian Pacific had a 16.7% ROIC).
With capex under control since it is kept under 14% of total revenues and a borrowing rate at the end of last year at 3.2%, Union Pacific is clearly creating value through its employed capital.
This has allowed Union Pacific to remain with a lot of free cash available, which has made the company very active on share repurchases which went from $1.5 billion in 2012 to $7.3 billion at the end of 2021. Now, the company let investors know during the earnings call that for this year, it expects to buy back roughly $6.5 billion in 2022 in order to preserve some cash in a challenging environment. However, dividends are being increased and they should amount for the full year to something around $3.8 billion so that the company, overall, could return to its shareholder just a little over $10 billion.
I like the fact that share buy backs are slowing down because I think a company has to be cautious with its balance sheet as the economy doesn’t seem to be headed toward a quick expansion. Furthermore, share repurchases add a lot of value when the stock is worth less than it should be. YtD, the stock is down almost 14% but we are still relatively close to its peak reached this past March. At a 19 PE, and a 13.6 EV/EBITDA the stock is neither that cheap nor that expensive so the company can for sure wait for better situations when the stock is down more than just 14% and take advantage from those possible dips.
Present and future cash flows
As we learned from Mr. Buffett, a business is worth what it is able to earn during its lifetime. In conclusion of this article, I want to share below a simple discounted cash flow model that projects the future cash flows of the company and sets three possible scenarios based on price/free cash flow multiple exits. I am using the ratio between the free cash flow and the market cap to reach a valuation so that it is expressed in percentage points.
I assumed that the company will grow its revenue at a yearly average of 3%, which takes into account that there may be downturns but also years of strong recovery. The other data are pretty straight forward as they just replicate the current situation: EBIT margin at 45%, capex around 16% of revenues and taxes around 22%. The result is that Union Pacific seems a bit overvalued now. However, the model doesn’t take into account a premium for a moat or for other qualitative aspects that are not directly turned into numbers but that do have a big impact on numbers as well. Therefore, while the model suggests that we are before a sell, I actually consider Union Pacific to be a hold at the moment. The company, as we have seen, performs really well in some of the key metrics, it has a huge network that is exposed to very dynamic areas of the country. In addition, its bond with finished car shipping makes me think that it will perform well all throughout 2023 as supply chain bottlenecks are solved and automakers can deliver all the cars sold in their order books.
Author, with data from own estimates based on UNP’s guidance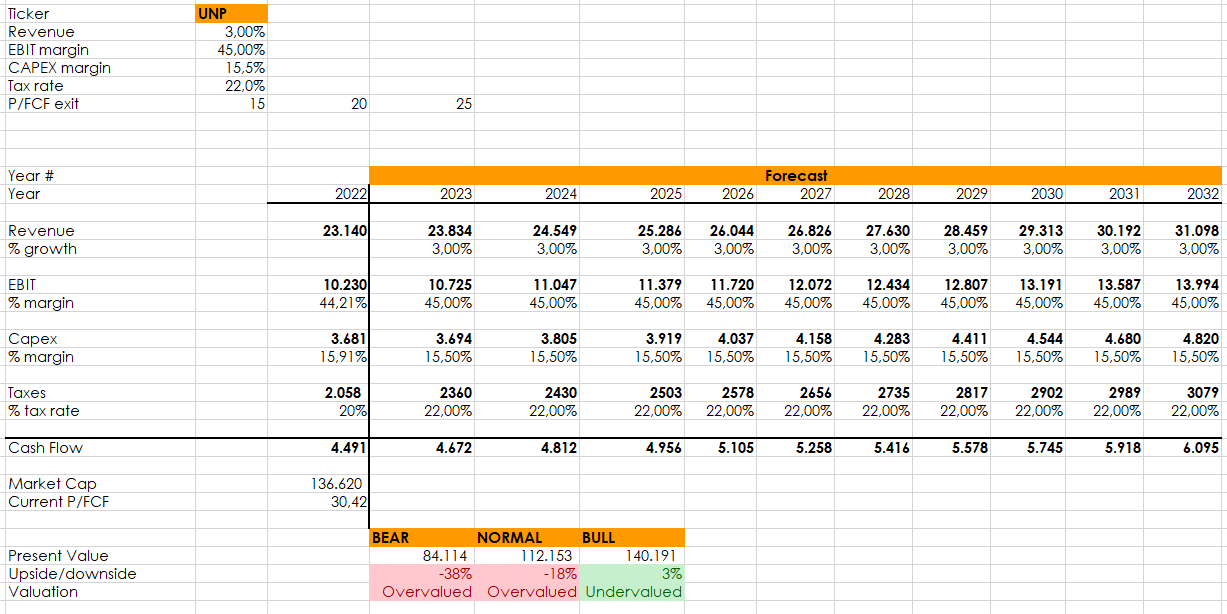
Let me know in the comments what you think and whether or not you are invested in UNP and at what price you would consider it a buy.
For those interested in reading the previous episodes, here are the links:
- Looking At Railroads As Mr. Buffett Does: Canadian National Railway
- Looking At Railroads As Mr. Buffett Does: Canadian Pacific
- Looking At Railroads As Mr. Buffett Does: Norfolk Southern
- Looking At Railroads As Mr. Buffett Does: CSX Corporation
- Why I Want To Buy Canadian National Railways Company
- CSX: When Traditional Metrics and Buffett Metrics Diverge
Be the first to comment