

Raycat/iStock via Getty Images
Investment Summary
Longs of Profound Medical Corp. (NASDAQ:PROF) have endured a 54% markdown in their positions over the past 12 months. Those buying into the weakness will have recognised even larger paper losses. After running PROF through a series of fundamental, simulative and statistical tests, findings suggest that it lacks conviction to overthrow various macroeconomic headwinds looming on the horizon.
Exhibit 1.
PROF 12-month price action. Price action has been bearish since July 2021 with shares trading below its EMA across the period
Crosses above the EMA have been accurate sell signal for PROF since July 21′ with strong base (hit) rate on backtesting, per HB Insights data.
Image: HB Insights. Data: Updata Analytics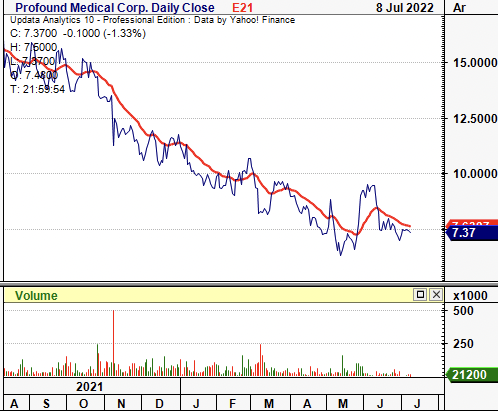
Things were boiling up well for PROF back in FY20 when we had sized into the stock [note– Entry: $12.13, 12/6/20′; Profit: $20.05, 24/3/21′]. Its TULSA-PRO procedure looked to penetrate an underexploited segment, and clinical trial data held up extremely well at the time. Make no mistake, PROF is a TULSA-PRO story. We firmly stress: the TULSA-PRO procedure is effective and potentially offers patients a better quality of life after prostate surgery – that’s not up for debate.
The incision-free ablation procedure has stacked up well in numerous clinical trials, and it’s received strong surgeon support per management. It is a step up from the previous standard of care by removing targeted prostate tissue, as opposed to the entire prostate itself. If you know anything about prostate cancer/surgery, it’s fraught with negative outcomes. These extend to urinary/bowel control, pain, and sexual dysfunction. But the removing the prostate has a 90%+ success rate of survival past 10-years, and is therefore offered as 1 of 3 standards of care. So it’s a catch-22. Hence, a big sell for TULSA-PRO is the quality of life for patients post-op. It is improved due to the lower risk of urinary and faecal incontinence, plus all of the other issues associated with prostate cancer surgery.
However, the tide has shifted in 2022, and there are new themes dictating equity returns – not just growth narratives. Indeed, the macro-thematic has turned to that of inflation, central bank tightening, geopolitical instability and numerous supply-chain shortages. Contrast this to the past two years, where the focus has been on top-line growth, rapid expansion and ‘innovation’ across all sectors. Now, the distribution of outcomes for the economy includes the probability we’ll enter a recessionary world within the next 2 years. Investors have increasingly begun to price in these risks accordingly.
In that vein, this analysis demonstrates why PROF fails to meet the criteria needed to justify its inclusion into a long-only, equity-focused portfolio. We illustrate that investors have shifted away from unprofitable names in medtech. The premia driving forward equity returns has also re-shaped. Alas, PROF is a high beta, low quality name that opposes our current investment strategy to identity long-term cash compounders with high degree of operating and earnings leverage. Without a directional view on the market, we rate PROF neutral on a $4.91/share valuation.
Macro-headwinds underline the case
In order to illustrate our thesis, we first need to grasp the current investment landscape. The valuation spread traditionally enjoyed by value strategies returned in FY22, with value stocks exhibiting pricing premium to growth into June. However, after the June roll-down, both value and growth premia have caught a bid and have curled back to May levels. With US nonfarm payrolls printing at 372,000 in June, well ahead of an estimated 268,000, yields at the long-end of the UST curve crept back up above 3% overnight. This brings nonfarm employment to just 0.3% below pre-pandemic levels, and yields back to a crucial level. How the value-growth spread pans out for here is integral to gauging equity allocation for H2 FY22.
Exhibit 2.
Valuation spread for value-strategies returned, but short-duration curling up amid spike in yields as well
With the market agreeing with the value factor, PROF should ideally provide some evidence of ‘value’ in the investment proposition.
Image: HB Insights. Data: Updata Analytics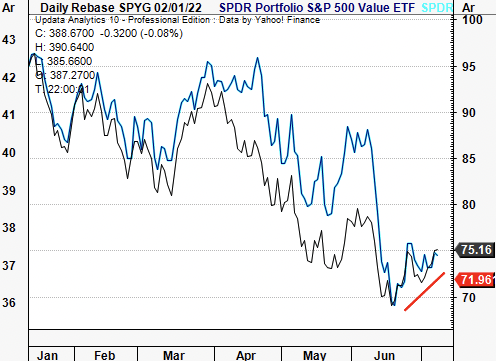
Essentially what’s happened in FY22 is investors have shifted focus away from top-line growth onto bottom-line fundamentals. Factors of profitability are paramount as investors have stepped up in quality and liquidity in search for defensibility and resilience throughout their portfolios. The market’s rewarding of these factors corroborates with the data above and in Exhibit 3. Investors have shifted away from high-beta growth to low-beta quality, seeking tangible value instead of future cash flows. As such, correlation structures between risk-assets and defensible asset classes have shifted up, compounding losses.
Exhibit 3.
Investors have shifted focus away from top-line growth onto bottom-line fundamentals, looks set to continue
This is key to our PROF thesis as it fails the litmus test on profitability and fundamental momentum. We can’t expect to rate higher if the market isn’t rewarding ‘the narrative’ but looking to earnings/cash flow quality instead.
HB Insights quantitative equity premia model [medtech], June FY22′
Image & Data: HB Insights Investment Strategy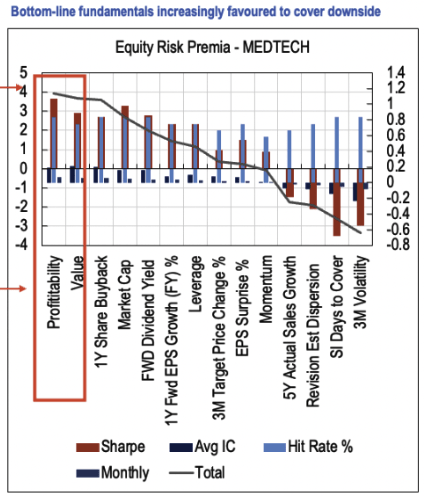
For PROF, this is best seen in its performance alongside long-duration UST’s. It was incumbent on the market continually rewarding the growth trade. When this reversed in late 2021, it was no surprise to see PROF retrace most of its prior year’s gains. The long-end of the curve has caught a bid lately, probably as investors weigh up the future economic outlook versus the near-term (future looks brighter). The PROF share price has followed suit. With inflation pressures still well in situ, the rate-hiking trajectory likely to remain in situ as well, by estimate. Hence, there’s higher probability PROF will de-rate further.
Exhibit 4.
Covariance structures between risk-assets and UST’s continues to shift up, a key risk to PROF
High-beta names continue to get punished and offer little upside premium as long as Fed looks to 75bps next cycle.
PROF correlation to long-dated treasuries – price, inversion of yield
Image: HB Insights. Data: Updata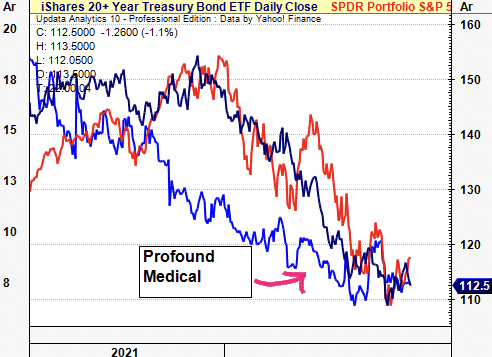
And what of inflation? With S&P earnings set to print higher in FY22 this suggests some pricing elasticity within most markets. Nevertheless, the debate on inflation is central to equity returns looking ahead. Both Brent Crude and Copper (Sep 22 Futures) have retraced from March highs at pace. Copper in particular has faltered to trade well below 2021 levels.
Meanwhile, Brent Crude recently broke trend having tested resistance in an ascending wedge. Around the same time, US TIPS also underwent a reversal and are at 52-week lows, as seen in Exhibit 5, to trade at 2018 levels. These are all key indicators of industrial and consumer pricing activity and suggest expectations for inflation are lower. Moreover, the US 5y5y breakevens are priced at ~2.6%, in line with historical averages.
Exhibit 5.
Brent Crude and Copper each consolidating off March highs
Key indicators of industrial/consumer pricing activity, suggesting inflation expectations are lower.
Image: HB Insights. Data: Updata Analytics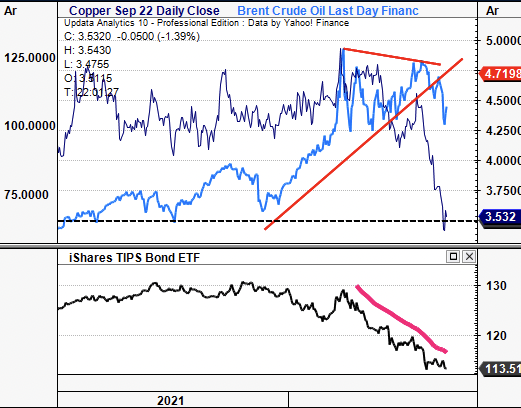
It is no surprise therefore to see low-beta, quality names flourishing in FY22 as the market rewards idiosyncratic risk once again. In other words, the market is no longer the sole driver of equity returns – factor premia and company-specific drivers are. Balanced portfolios have therefore outperformed in FY22 by capturing upside in commodities and alternatives. Empirical evidence tells us why.
Traditionally, there’s a diversification benefit offered by holding equities and fixed income. However, historical data shows that in times of inflation, this relationship breaks down and correlations between the 2 asset classes head to 1. When equities are down and in times of inflation, commodities tend to outperform, being the cause of and most reasonable hedge against inflation risk. Alternatives have emerged onto the scene as a way to capture this premia, and/or maintaining equity exposure, albeit with uncorrelated equity returns.
As seen in Exhibit 6., balanced portfolios constructed with an alternatives and commodity weighting have offered wide diversification benefits to traditional stock/bond portfolios in 2022. Losses incurred by the latter’s correlations have been more than offset by positioning in the former.
Exhibit 6.
A weighting to alternatives and commodities has been key differential for capturing risk-adjusted alpha and minimising drawdown in FY22
Skew and kurtosis improved too. Hammers in the point that low equity beta continues to outperform in 2022.
Note: GSG (black); DBMF (red); IEI (sky blue); 60/40 (green/blue)
Image: HB Insights. Data: Updata Analytics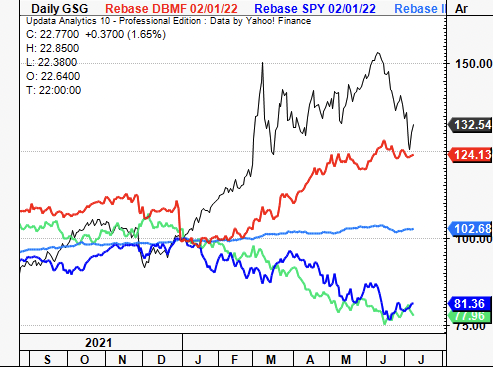
For PROF, it doesn’t lend us any of these statistical benefits. As such, it has lost relative strength against the SPX in FY22, all whilst the benchmark itself has been sliding. As PROF has lost relative strength, it’s equity-beta to the benchmark has been gradually shifting up, as seen below, corroborating the thesis laid out in this report. Again, PROF is a high-beta, low-quality play that goes against the characteristics investors are currently paying a premium for. The question is, what does this spell for the company and investors moving forwards? A deeper dive into its fundamentals reveals more.
Exhibit 7.
PROF continues to lose relative strength vs. the benchmark all whilst equity-beta shifts upwards
Corroborates to the underlying thesis laid out in this report.
Image: HB Insights. Data: Updata Analytics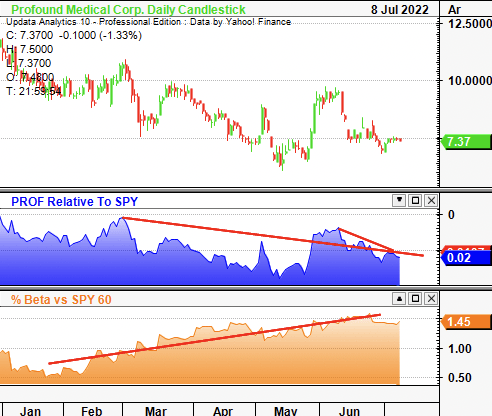
Fair view of fundamentals
Unfortunately PROF doesn’t beat the watermark at this level either. Our findings show there’s been a lack of tangible value creation for shareholders, and that predictability of future cash flows is weak. Hence, valuations are likely to remain compressed, by estimate. We first must turn to FCF as profitability at this level is integral to equity returns looking ahead. With a series of losses at the FCF level, there’s no momentum heading into H2 FY22. The loss on CFFO has been increasing since Q2 FY20 and came in at -$7.86 million in Q1 FY22. FCFF has therefore been abysmal and looks set to remain negative into the coming 3-years at least.
Exhibit 8.
Nil profitability above, at or below the bottom line to report of
Clear divergence from factor premia investors are paying for in FY22.
Image: HB Insights. Data: PROF SEC Filings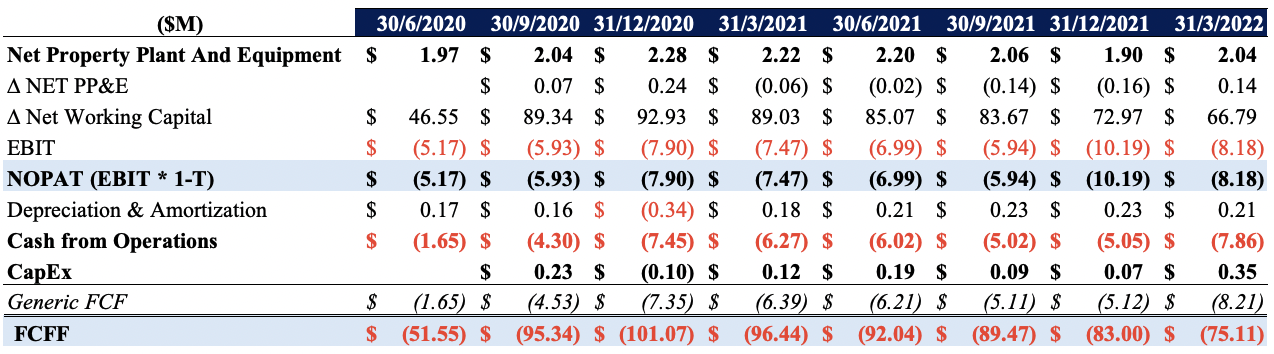
Noteworthy however is that OPEX has remained relatively flat in this time, whilst its cash balance has slowly worked its way south. It’s also failed to print any meaningful revenue in the last 3-years to date – and with investors shying away from top-line growth, what is there left on an income/cash flow basis to grab onto now that it is set to recognise first revenue from TULSA-PRO in FY22? R&D expenditure is still narrow on an annualised basis, and the global installed base on TULSA-PRO is now 30. Q1 revenue was primarily on the installed base, with ~$1 million in recurring revenue in that mix. The installed base is set to finally produce revenue, as mentioned, and the impact should be recognised from Q2 downstream. It has another 10 agreements yet to be installed in FY22 and management point to a potential doubling in utilisation across the base, so we’ll see at earnings time.
Exhibit 9.
PROF is at an inflection point as income from its installed TULSA-PRO base finally set to come through as booked revenue
But investors are agnostic to top-line growth at present. The path to profitability is far more important right now.
Image: HB Insights. Data: PROF SEC Filings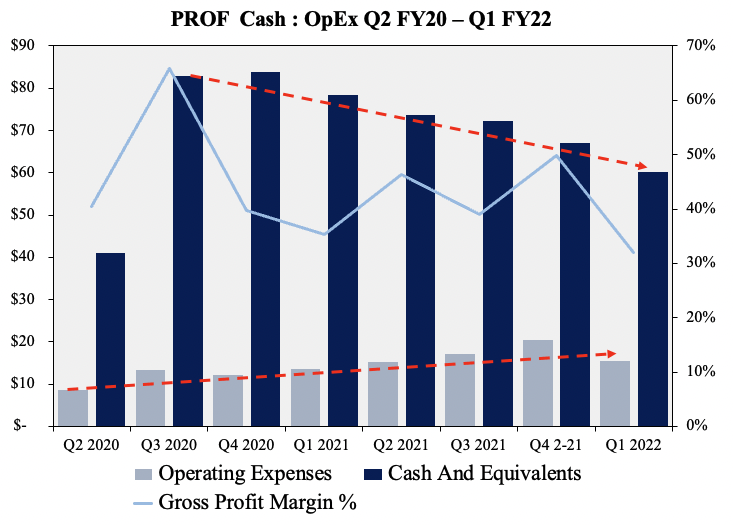
The booking of revenue is essential for PROF finally deliver a return on capital that may help guide its path to profitability. But it won’t be turnover investors are rewarding. Moreover, sales growth could even be an issue, given PROF’s revenue model. First, it anticipates the cadence of utilization on TULSA-PRO placements to uptick for H2 FY22. This, it sees “as the newly installed sites get up their learning curves and increase utilization,” per last earnings call.
In fact, utilisation is critical for TULSA-PRO, as the business model relies on patient turnover for recurring and scalable revenue. Despite the fact it’s a medical device company, PROF books revenue by charging on a per-patient basis in the US. It does this for bundled services that include device usage, a one-time disposable, and supplementary services. To be clear: it recognized no revenue from the installation of its TULSA-PRO systems, as opposed to what’s conventional in the sector. So it makes no money on the installation, but see’s a recurring-like revenue stream due to the per-patient usage. It therefore relies on patient-turnover to drive sales volume, which could present as a high risk amid increasing competition and a slowing hospital capital budgeting cycle. According to CEO Dr. Arun Menewat last earnings call:
We believe that this is the winning [revenue] model as it creates a true partnership between us and the healthcare provider. In the first quarter of 2022, we continue to see that our — physicians are using TULSA for whole gland, partial gland or focal therapy, and salvage cases.
Exhibit 10.
Finally booking revenue from TULSA-PRO will see some tangible value to invest in, other than the growth story
PROF’s per-patient revenue model could pose a risk if patient turnover recedes en masse again
Image: HB Insights. Data: PROF SEC Filings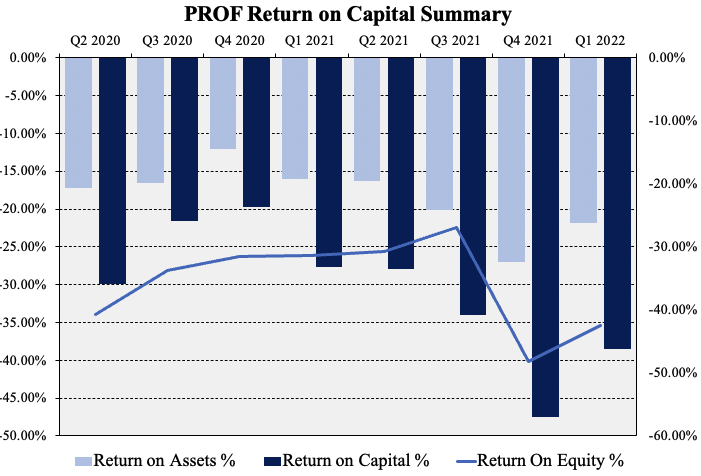
Valuation
Shares are trading at ~14x forward sales, well above the sector median’s 4.75x, but below PROF’s 5-year average of 43x P/S. PROF also trades at ~3x book value and ~16.5x cash flow. With its lack of profitability, a firm valuation is hard to derive for PROF, especially as our forecasted cash flows signal further operating-net losses into FY24. It’s no wonder then to see PROF’s multiples de-rate against the S&P 500 health care equipment and supplies index (Exhibit 11). More importantly, the trend had been in situ since mid-2021, as seen below. Hence, on a relative basis, PROF’s valuation is weakening, and looking ahead, the case for a re-rating is weak.
Exhibit 11.
PROF’s multiples have been weakening in relative strength against the healthcare equipment and supplies index since mid-2021
Case for re-rating is equally as weak.
Image: HB Insights. Data: Updata Analytics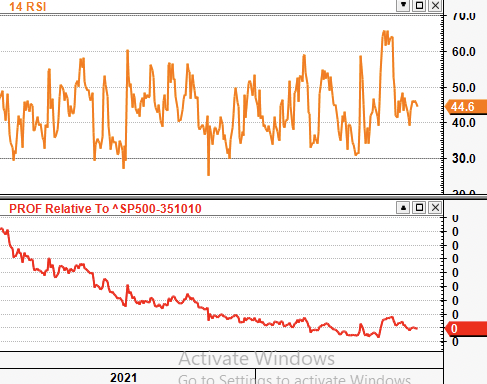
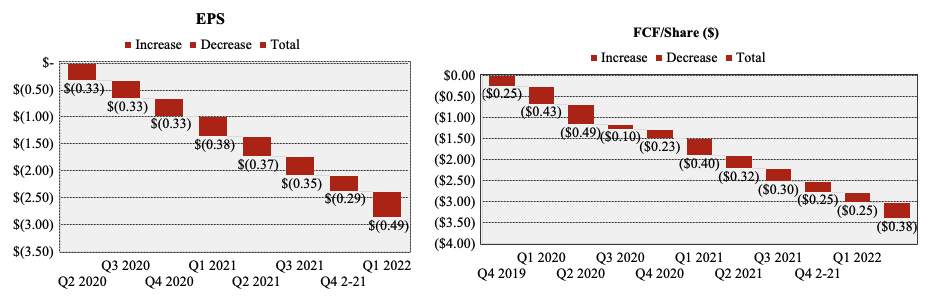
We turn back to the theme of tangible value and see it’s absent in PROF’s case. There’s a lack of incremental value flow for shareholders to have realized, or to realize when looking out ahead. Cumulatively, shareholders have lost $6.63 in tangible value flow from Q4 FY19 to Q1 FY22 (we define tangible value flow as FCF/share plus EPS). It’s no wonder investors have been selling off their positions in PROF – the market is rewarding bottom-line fundamentals, and this name is an example of what that doesn’t look like.
Exhibit 12.
Investors have lost $6.63 in cumulative realized value since Q4 FY19
Goes against where the market is currently paying a premium – for resilient, quality fundamentals at the bottom line.
Image: HB Insights. Data: PROF SEC Filings Image: HB Insights. Data: PROF SEC Filings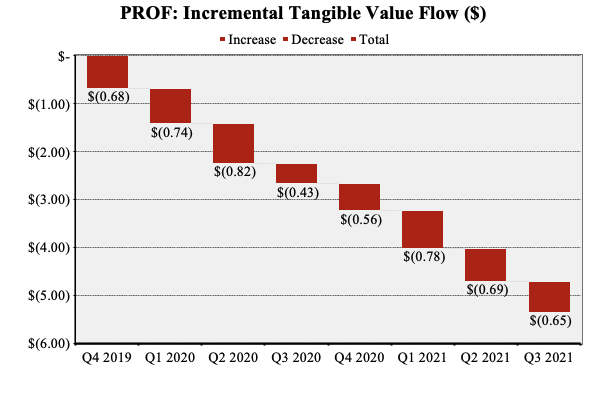
Assigning 14x our FY22 sales estimates of $13.7 million yields a price objective of $9.14, however we are choosing to lay little weight to this given it’s a multiple of forward sales (and not FCF or cash flow). Using point & figure charts to cancel out the noise of time, we can gauge the market’s psychology and determine price objectives in a more unambiguous way. Daily P&F charting shows several downthrusts off previous highs and multiple downside targets at $3.40–$3.50. There is 1 upside target to $9.10 in line with the multiple-derived valuation.
Blending the inputs (25% P/S and 75% P&F target) sees us price PROF at $4.91 apiece.
Exhibit 13.
Objective price targets pointing to downside objectives to $3.50
Resistance is seen at $9.10 – in line with multiples derived valuation
Image: HB Insights. Data: Updata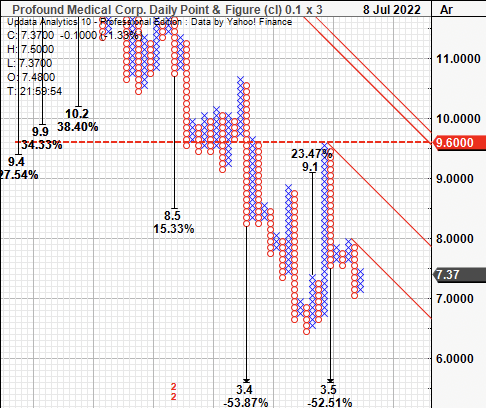
Technical studies
On a 6-month daily cloud chart, the stock has been trading below cloud support for several months with the lag line still bearish. On balance volume has continues in a downtrend whilst momentum has turned sharply lower in June for PROF.
Each of these indicators suggest a continuation of the downtrend to a price objective of $4.91 then to $3.50 if this is confirmed.
Exhibit 14.
Volume and trend indicators only support picture for further downside
OBV and momentum continue in downtrend and have turned lower in June
Image: HB Insights. Data: Updata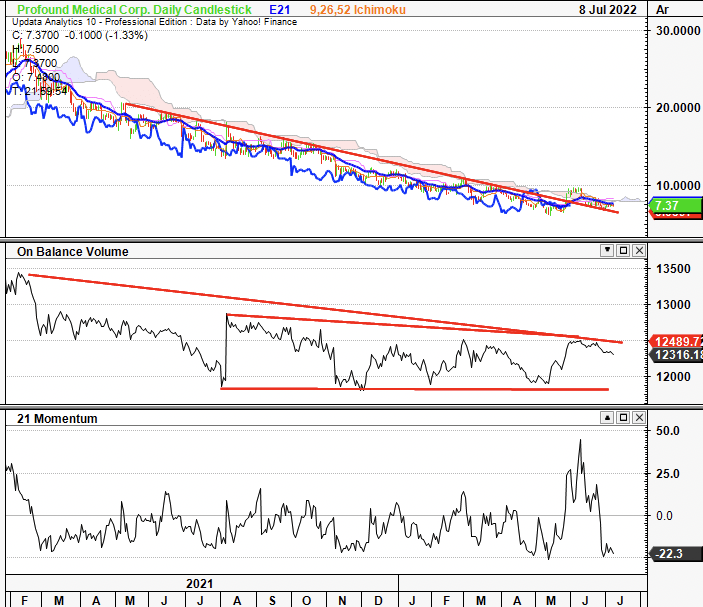
In short
As a long-only play in an equity focused portfolio, PROF fails to justify its inclusion. The market has shifted away from rewarding growth premia and is prioritised on bottom-line fundamentals and quality. These are low-beta holdings that provide adequate diversification and a step up in quality for investors, unlike PROF. Its shifting covariance structure and murky path to profitability has ensured it has been beaten down in FY22, by estimate.
PROF also fails to evidence it can overcome the macro headwinds on the horizon. We’ve priced the stock at $4.91 apiece and can’t see any reasonable upside in the near term, regardless of its first revenues to come in at FY22’s end. There is likely to be a short-term uptick in share price at that point, but long-term, the opportunity cost of overlooking higher quality, compounding names is too great at this minute. Without a directional view on the market, rate neutral on $4.91 PT.
The major upside risk to this valuation is if the market does in fact reward PROF on the back of its revenue growth, nullifying the thesis presented in this report. This is where options setups can come in handy for speculators who want to either trade the volatility or benefit from the price action both ways afterwards.
Be the first to comment