

Taras Grebinets/iStock via Getty Images
Investment summary
The market has been doing all of the talking in in FY22 and in doing so has been doing the heavy lifting for us stock pickers. If you consider the market to be somewhat efficient [we do], and are an avid believer in data-driven fundamentals [again], then you’d have to agree that there’s been a sigh of relief with the unwinding of the high-beta, growth trade of FY20’–21′. Investors are finally paying attention to fundamentals again, and the resulting factor rotation into defensives, quality and the likes has seen a rapid drawdown in wildly valued companies.
Whilst we can think tech and private equity all we want, of equal substance here is the health care and medical technology (“medtech”) sector[s]. Of no fault of its own, the medical and surgical equipment domains caught a strong bid across FY21 even with weakening fundamentals across the time period. Case in point is Pro-Dex, Inc (NASDAQ:PDEX) whereby investors rewarded narrative versus numbers during the pandemic.
The stock trades around 52-week lows and continues to push lower as the market continues to deal with the overvalued pockets that still linger around to this day. I’ve found the company’s fundamentals have been weakening over the past 2 years and that investors may have been correct in re-rating the stock to its lowest average market cap in around 2-years. Net-net, I rate PDEX a hold, and note valuations are supportive of this view along with the above-mentioned points.
For a quick overview, the company designs and manufactures surgical devices used in the thoracic, orthopaedic and craniomaxillofacial (“CMF”) markets. It manufactures multifunctional surgical drivers and shavers that use the company’s ‘adaptive torque-limiting technology’ and other IP that is sells to distributors. It books revenue on this basis and here, I’ve gone a little deeper into the company’s numbers to understand how it is spending its money, and what value it is creating on this.
PDEX FY22 results illustrate market headwinds
The company came in with a weak set of results in FY22 compared to the previous 12 months. Net sales of $42.04 million (“mm”) came in on a 10.5% YoY growth schedule whereas the cost of this turnover increased 18.2% YoY to $28.9mm. This led gross margin to compress by ~440bps YoY to 31.2%. Moving down the P&L, and OPEX came in 11% lower than FY21 due to reduced selling expenditure and a 32% YoY reduction to R&D spend.
As such, PDEX recognized some upward mobility in operating income to $5.1mm and brought this down to a net income of $3.855mm, well behind FY21’s $5.82mm in net profit. However, I’d note FY21 included $2.47mm in ‘other’ income that wasn’t booked in FY22, and removing this from the equation earnings actually stretched up by 15% YoY. Meanwhile, it printed a loss of $2.52mm in FCF for the year. PDEX’s FCF bridge for the 12 months is seen in Exhibit 1.
Medical device sales make up 81% of turnover for PDEX, made up of revenue from orthopaedic, CMF and thoracic segments. Orthopaedic sales lifted 21.9% YoY and printed $21.87mm and made up 64% of total medical device turnover.
Exhibit 1.
Note: All figures in $mm. (Data: HB Insights, PDEX SEC Filings)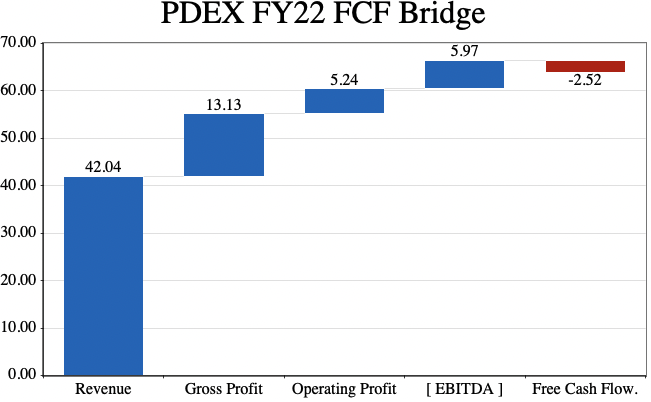
PDEX fair view of fundamentals
Deeper analysis on the company’s FY22 numbers illustrate that concentration risk from customer’s increased YoY. To illustrate, PDEX’s top 3 customers attributed 88% of sales compared to 91% the year prior. However, there was 1 customer that accounted for ~66% of turnover, with the second largest customer generating 14%. Compared to FY21 the breakdown was 58% and 27% respectively. PDEX also had a backlog of $16.5mm at the end of FY22, and this was up 70.1% YoY and management said this is backed by firm purchase orders.
Meanwhile, distribution of gross–operating profit has been lumpy on a sequential basis from FY20 to date, as seen in Exhibit 2. Similar trends are observed in free cash flow (“FCF”) and FCF yield. Whereas PDEX recognized solid growth numbers from FY16–FY19 on a quarterly basis, this pattern has become less consistent throughout the pandemic, such that operating profit narrowed by CAGR 25.7% over this time. On this, TTM FCF yields have continued their descent from FY17, and PDEX realized a cumulative FCF loss of $10.75mm across the course of the pandemic.
Exhibit 2. Reversal of [profit] growth trends from top to bottom line throughout pandemic.
- FCF yields continued descent – question becomes if there is the return on capital/investment to measure this as a positive result.
- Cumulative $10.75mm FCF loss across course of pandemic [quarterly].
Note: All figures in $mm or [%]. Free cash flow calculated as [NOPAT – investments]. FCF yield as a function of enterprise value on trailing twelve month basis. All calculations made from GAAP earnings with no reconciliations. (Image: HB Insights. Data: HB Insights, PDEX SEC Filings. )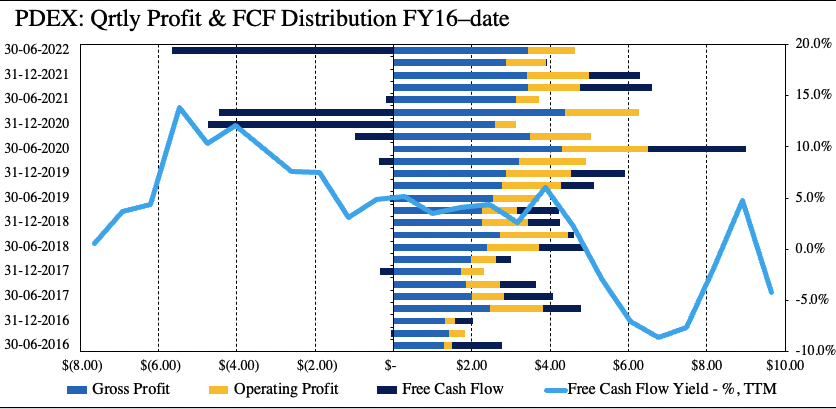
The question then becomes if the FCF ‘spend’ has been realized back in the company’s return on investment. In particular, I wanted to examine how much NOPAT the company generated from the previous period’s invested capital. I’ve measured this as return on invested capital (“ROIC”) and return on assets (“ROA”) on a TTM basis. As seen in Exhibit 3, there is no divergence in the PDEX’s return on investment to the FCF yield from FY20 to date. Both have been contracting in this time.
Ideally, we’d see some bifurcation of ROIC and ROA to the upside, indicating that FCF was well ‘spent’ over the testing period, however this isn’t the case in my estimation. From what we’ve observed so far in FY22, names that have been growing return on investment over the past 5 years have withstood the downside this YTD. Hence, this is an important factor in the PDEX investment debate.
Exhibit 4. Positive correlation of PDEX’s return on investment [ROIC, ROA], to FCF yield.
- Indicates to me the FCF wasn’t well ‘spent’.
- To contrast: Leading into the FY19/FY20 period, there was a general uptick in return on investment, corresponding with the trends observed above.
Note: All figures in [ % ]. All calculations made from GAAP earnings with no reconciliations. (Image: HB Insights. Data: HB Insights, PDEX SEC Filings)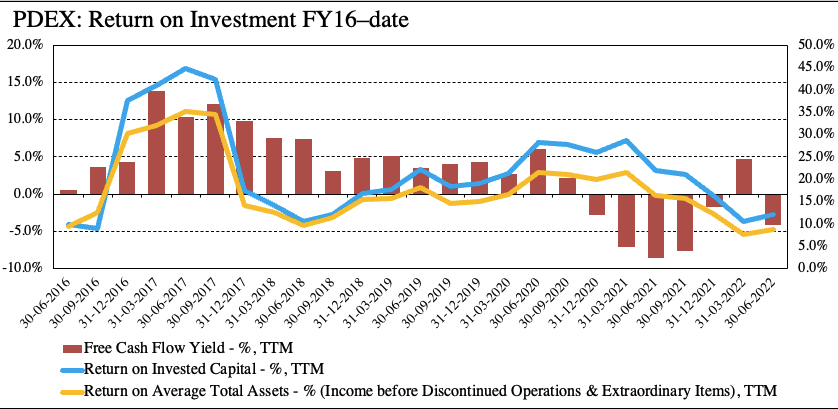
Valuation and conclusion
If valuation is a function of a company’s earnings [historical, expected] and return on investment [ongoing, trailing], then PDEX doesn’t beat the watermark in my estimation. With earnings showing a contraction in growth and return on investment trends on a similar path, it’s unsurprising to see the stock trading at a discount to GICS Industry peers, as seen in Exhibit 5. Shares are trading at a deep discount to peers but from the looks of it the discount is warranted, and hence mightn’t represent compelling value at this stage. With numerous downgrades to FY22 guidance on the horizon in medtech, this could serve as another clamp on the PDEX share price as well.
Exhibit 5. Multiples and comps – discount is warranted and doesn’t represent compelling value, by estimation
Data: HB Insights, Refinitiv Datastream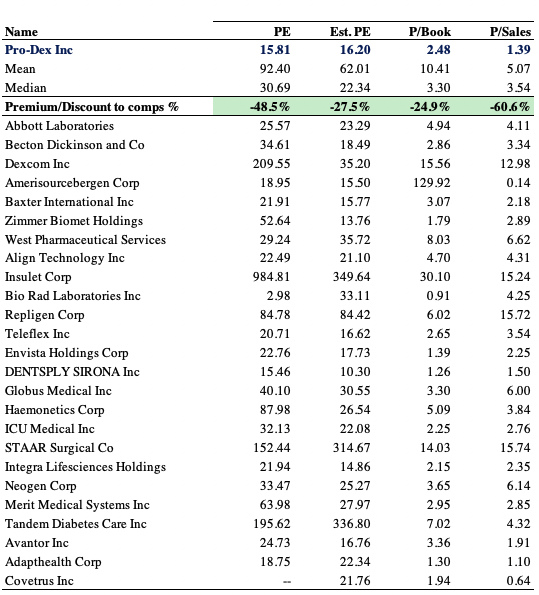
The market’s priced PDEX at ~16x forward earnings which I believe is a fairly optimistic projection, but in range with the broad indices nonetheless. Applying this multiple to our FY23 and FY24 EPS estimates of $1.43 respectively yields a price objective of $22.88, which is an optimistic projection by my estimation. Note, at our projections, seen below, PDEX currently trades at 10.5x forward P/E, and at this multiple the price target is $14.30 – far more reasonable in my view.
Exhibit 6. PDEX forward estimates FY23–FY24
- We’ve priced PDEX at 10.5x forward P/E versus market consensus 16x.
Data: HB Insights Estimates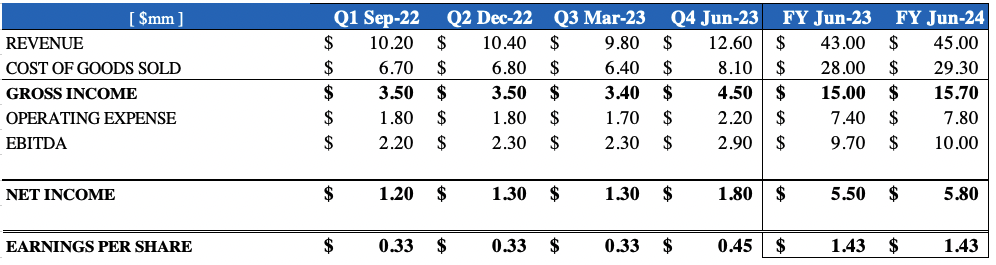
Net-net, there’s a lack of flesh to put on the skeleton in the case of PDEX. As an investment, adding to the equity risk bucket in one’s portfolio in buying PDEX is not an ideal decision by my estimation, not right now anyway. There remains a case whereby the company can reverse the value erosion in its share price with a corresponding reversal in earnings quality and return on investment, however, it remains to be seen on a forward looking basis. With that in mind, and, with numerous selective opportunities available for those looking to step up in the quality spectrum, I rate PDEX a hold on a $14.30 price target.
Be the first to comment