


VioletaStoimenova
Financial Sector Doing Well But Not All Its Industries Alike
As for the 1-month performance, the Financial sector returned 8.13%, following Basic Materials and Industrials.
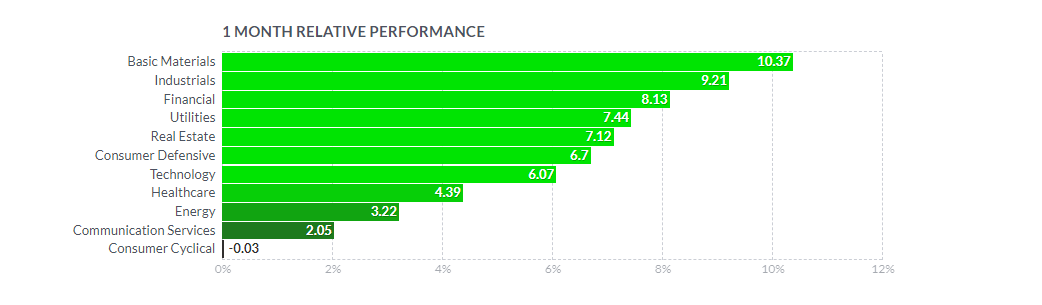
1-Month Performance of Sectors (Finviz)
The 1-week return of the Financial sector lagged (2.54%) far behind Utilities, on a similar level as Industrials, faring however much better than Technology.
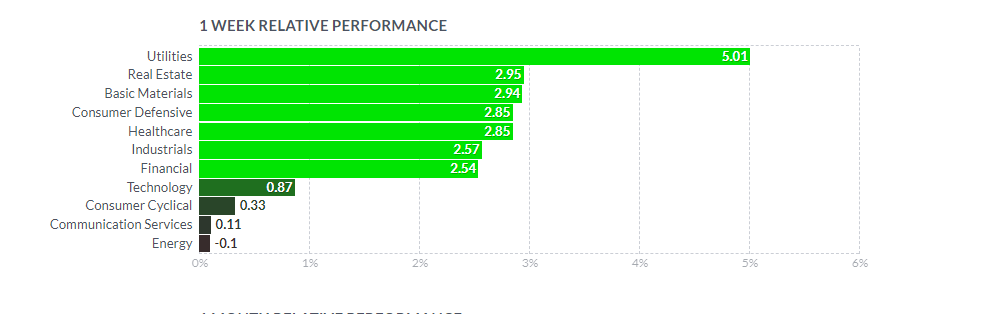
1-Week Performance of Sectors (Finviz)
On the industry level, Insurance-Life, to which Primerica Inc. (NYSE:PRI) belongs, has not been really amongst the leading financial industries on a 1-week basis with just a meager return of 1.86%.
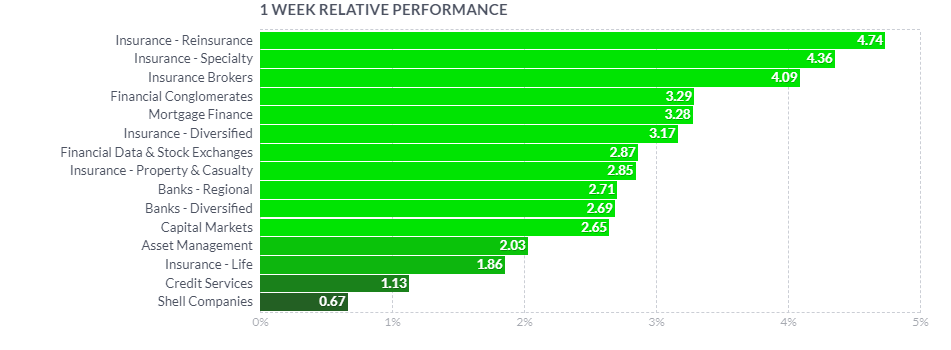
1-Week Performance of Financial Industries (Finviz)
However, this industry group has had a better performance on a monthly period with 8.64%, versus the best-performing Mortgage Finance group which returned nearly 17%.
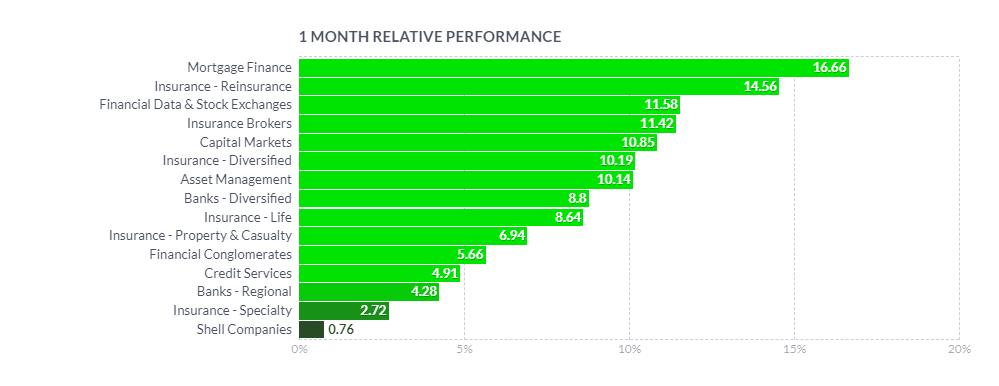
1-Month Performance of Financial Industries (Finviz)
I want to underline that my approach is not pure top-down drilling just following the highest returns. I choose well-performing sectors, but then I review the stocks manually and select those which in my opinion have been overlooked and have a high potential of being just at the beginning of an uptrend or a breakout. Such is, in my opinion, the case of Primerica Inc. (PRI) which presents a quite attractive technical set-up, while benefitting from a modest inflow of money to the sector.
I will analyze Primerica from a perspective of a number of technical analysis tools and show the screenshots on the monthly, weekly, and daily Heikin Ashi candles charts – each timeframe presented through two separate sets of indicators – which I will complement with a simplified daily Renko chart. You will find an overview of the latest business developments in the end of the article.
Short Intro To My Favorite Technical Tools
The first chart setup (I will call it Chart 1) uses Bill William’s Alligator indicator and Awesome Oscillator, as well as Ichimoku Clouds and On Balance Volume indicator line. The second chart setting (Chart 2) uses 2 moving averages (10- and 50-period), volume and volume’s 20-period average, MACD (Moving Average Convergence Divergence), Composite Index Divergence Indicator (CIDI), and Directional Movement Indicator (DMI). In order not to repeat in each article my personalized approach to these tools, see my article on Amkor Technology (AMKR).
I will be honest with you – I am not showing here all the technical indicators that I use for screening and analysis as they belong to my secret sauce.
The Long-Term Trend
For the long-term trend analysis, I use monthly charts. See below Chart 1. Starting from the color of the candles already, we can assume that the price has entered an uptrend. Alligator’s Teeth (red line) are crossing above the Jaw (blue line) and Lips (green line) are crossing above the Teeth. Since all the lines are upward, they seem to give a positive outlook. The Ichimoku Cloud is green and the wicks of the candles have not touched the borders of the cloud since 2020. On this chart, a possible zone of support should lay in the stretch between $126 and $130 for possible pullbacks. Awesome Indicator is trending up and approaching zero level from the bottom. The most positive signal on the indicator would be the cross above the zero line. On-Balance-Volume is upward and on the verge of crossing above the peaks from 2019 and 2020, however, still below the higher levels from the end of 2021. The bottom panel indicates a revenue trend, which I use for a quick fundamental scan.
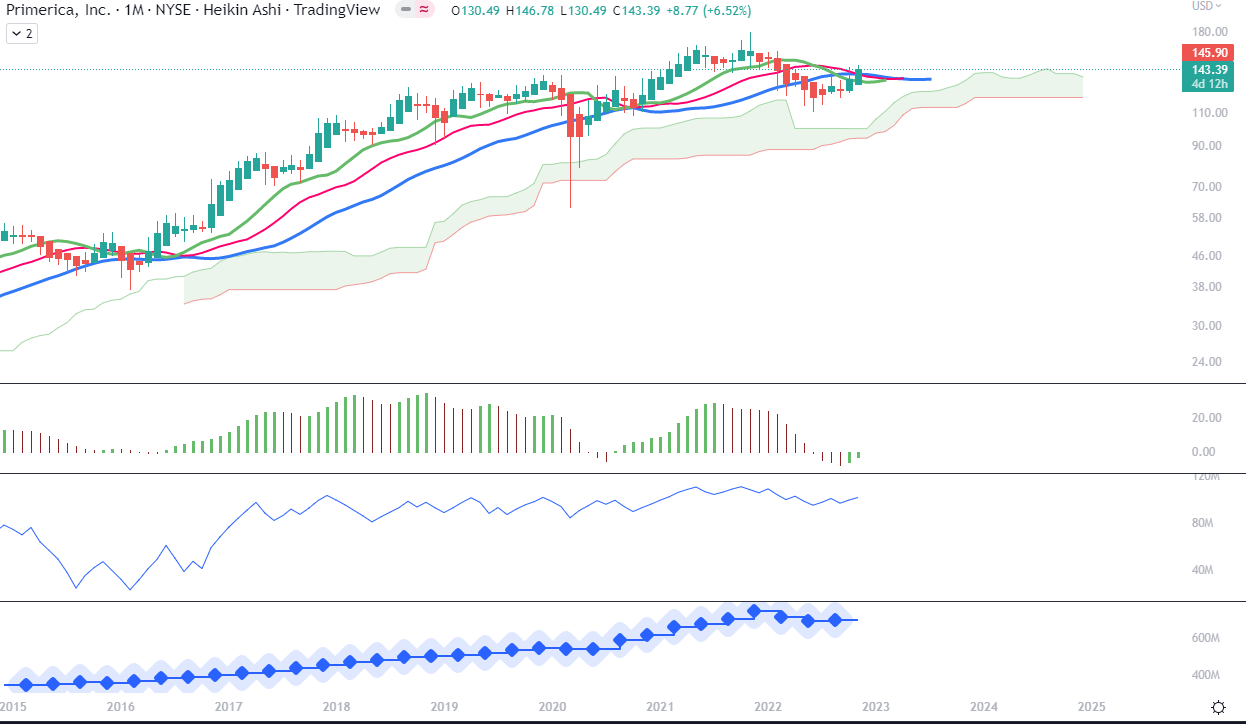
Monthly Chart 1 (TradingView)
On Chart 2 we can see a strong November green candle above both the fast 10-month (blue line) and 50-month (red) Moving Averages. Also, the quick MA seems to be bouncing back from the slow one, bringing a chance to jump onto Primerica shares at the end of the nearly 1-year-long pullback. However, volume is not extremely convincing, so a word of caution, although not a red flag. Composite Index Divergence Indicator line has crossed above both fast (green) and slow (orange) averages and the fast average seems to have bottomed, now in a flat phase, possibly moving upwards in the coming months. Positive Direction Indicator DI+ is in the crossing situation with the Negative Direction Indicator DI-, slightly above it. MACD has turned up and heads onwards its signal line, possibly crossing above it within the next 1-2 months if the momentum proves decisive.
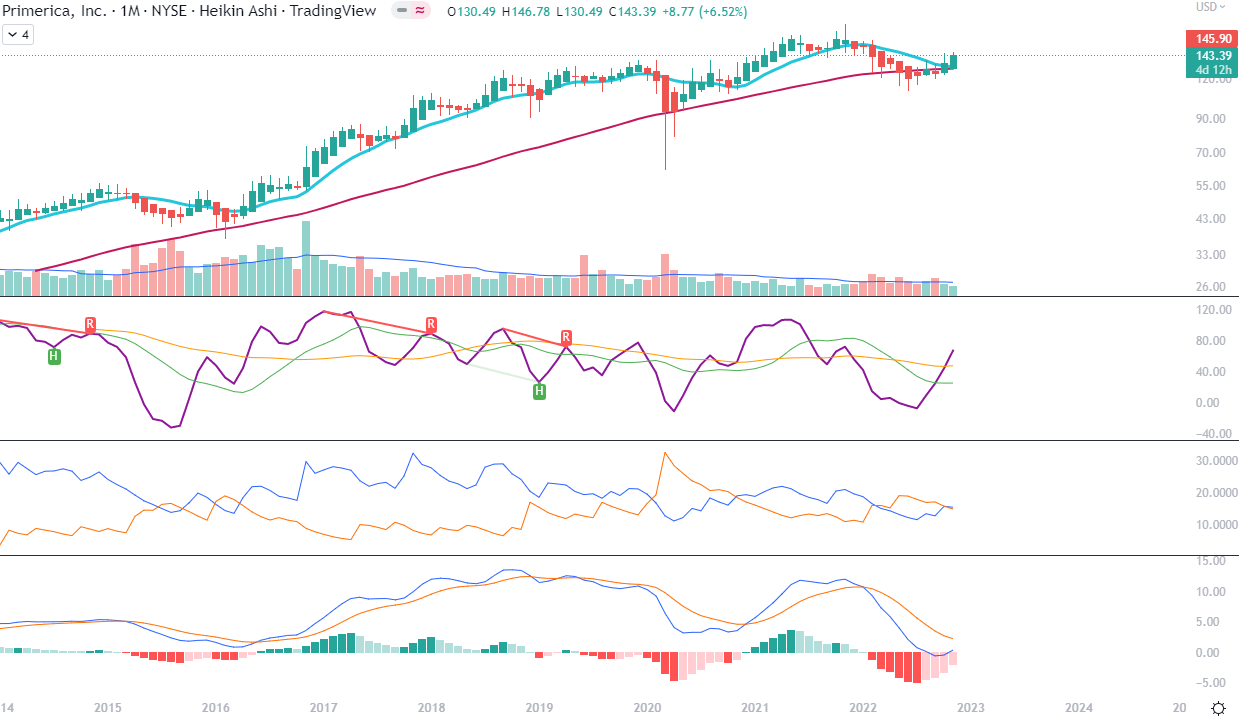
Monthly Chart 2 (TradingView)
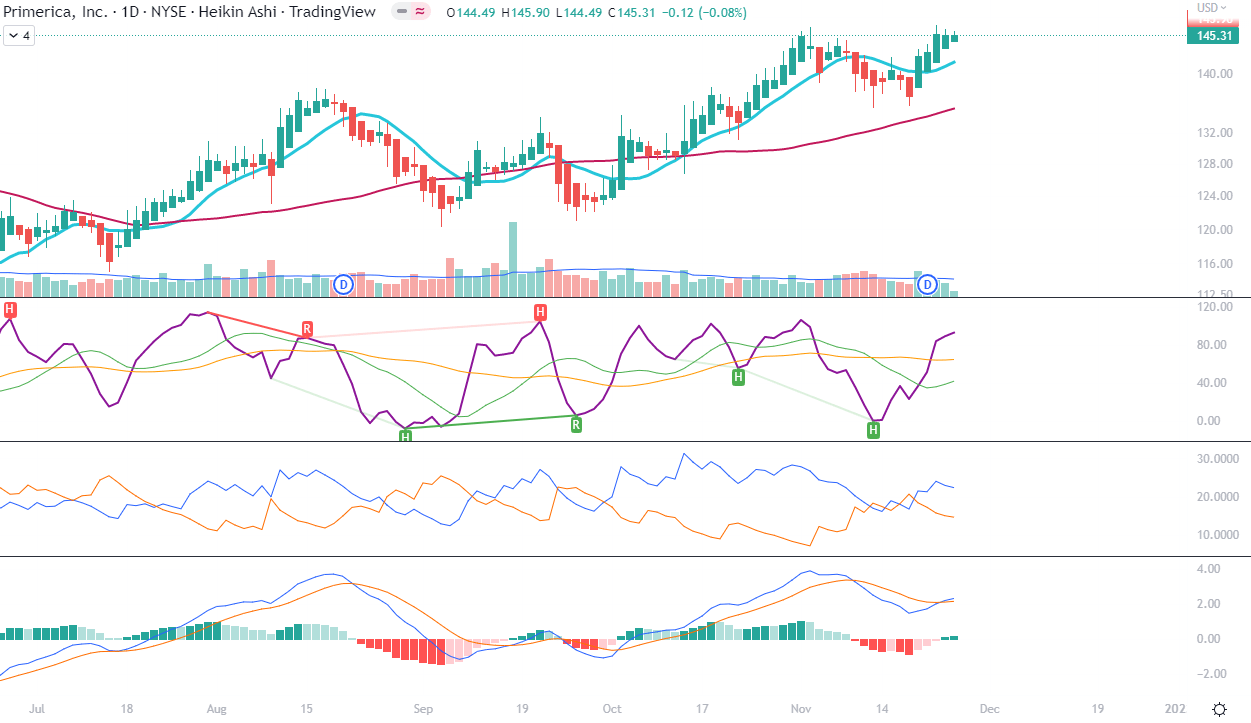
The Mid-Term Trend
As we can notice on Chart 1, the recent weekly candles have been stopped on the border of the red Ichimoku Cloud, around the level of $146.77. The Ichimoku Cloud narrows and seems to indicate the change of color to green. All of the Alligator’s lines are moving upwards and Awesome Oscillator is in the positive territory, with bars trending up. I have an intuition that a pullback to the zone between $135 and $138 may be necessary to gain new momentum and cross above the Cloud. OBV indicates higher highs and higher lows, possibly with the inflow of Smart Money.
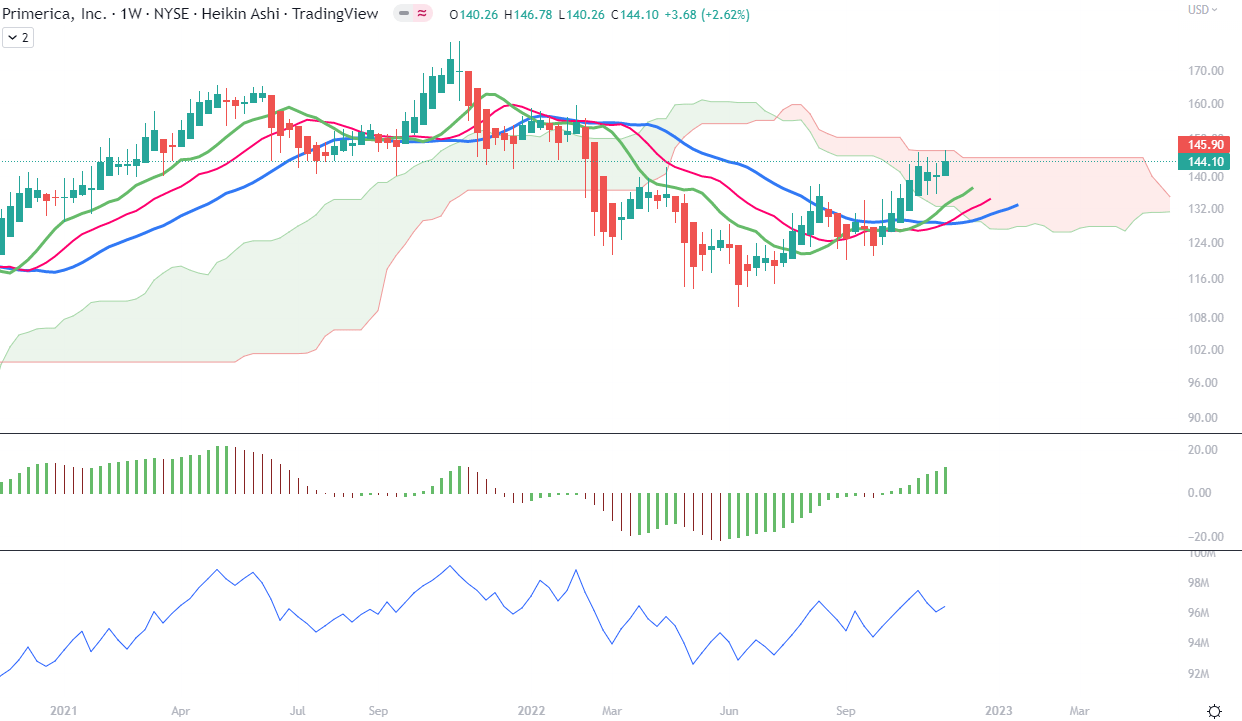
Weekly Chart 1 (TradingView)
On Chart 2 below, we can appreciate that 10-week MA has crossed above the 50-week MA and that all the indicators have crossed above their respective averages, counter-lines, or signal lines, including the zero level for MACD. This chart presents a more positive sentiment when it comes to price momentum.
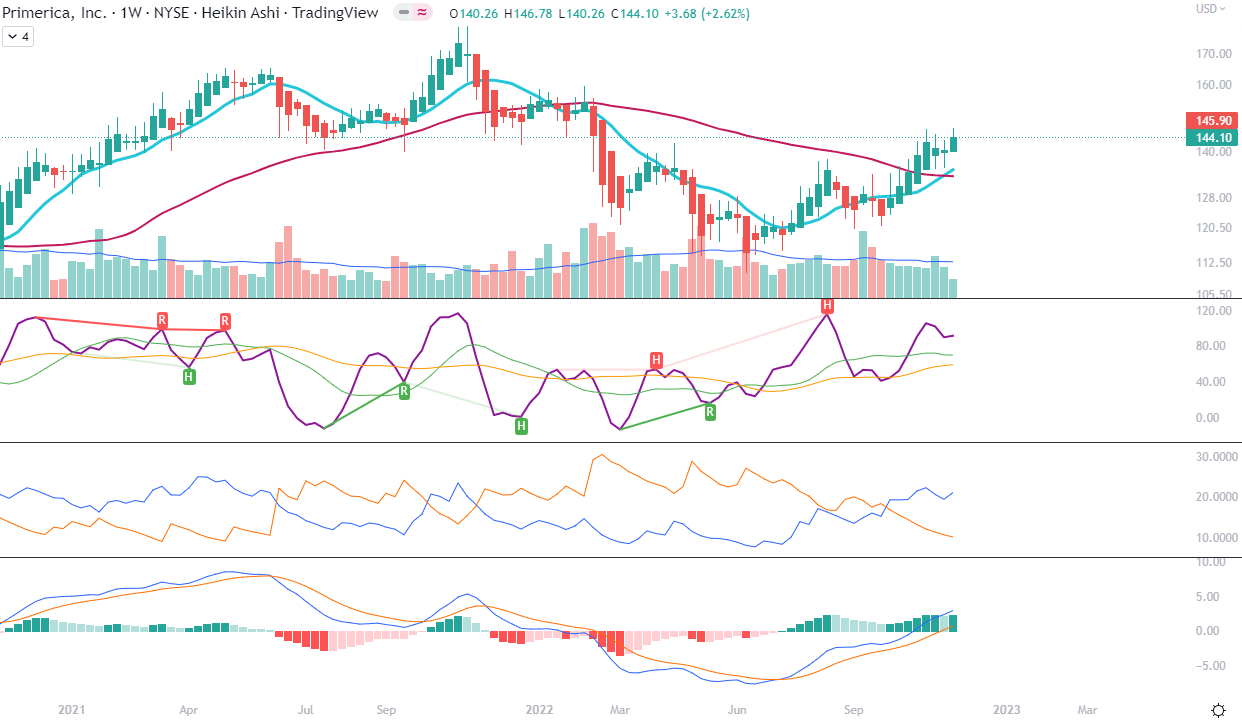
Weekly Chart 2 (TradingView)
The Short-Term Trend
As we can see in Chart 1 right below, prices have been on an uptrend since October. The nearest strong support line seems to be present on the level of $140, which is the top border of the green Cloud, although a small pullback could also take the price just to $142.50, which is the top of Alligator’s Lips line. This picture is positive, but we should expect a small pullback.
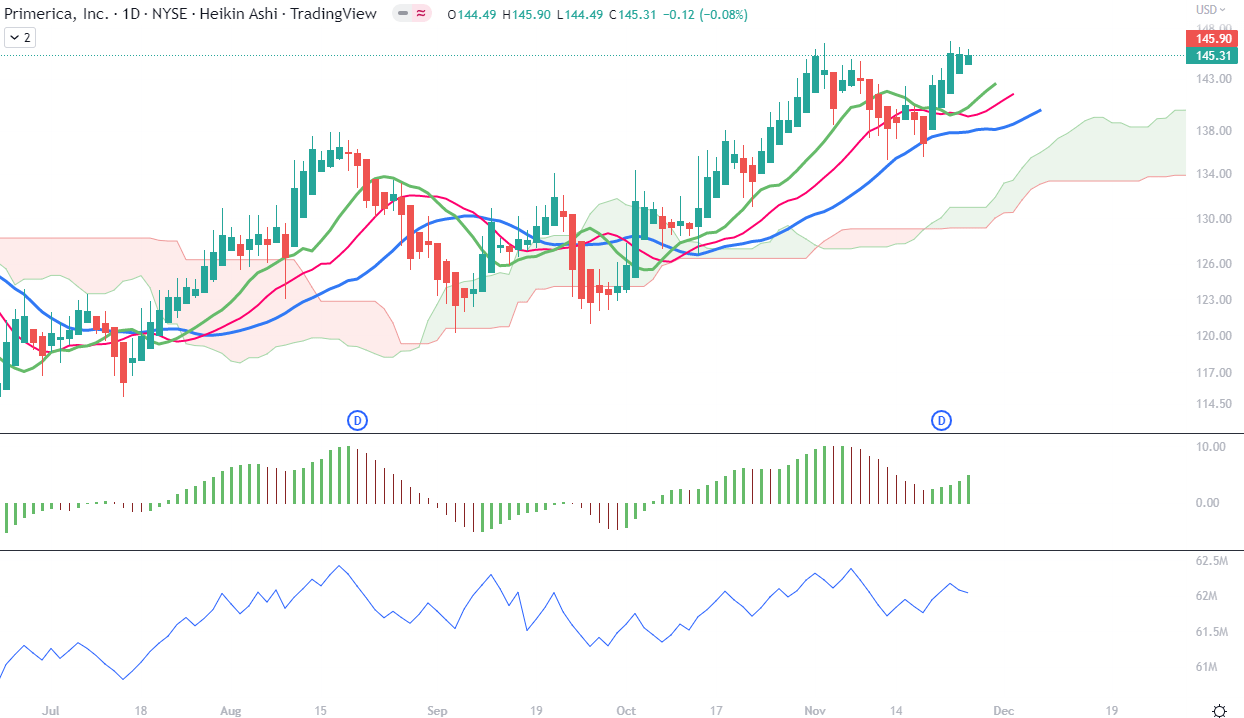
Daily Chart 1 (TradingView)
As for the picture in Chart 2, we can see strong momentum in the upturn of CIDI, an upcoming cross of fast green over slow orange, as well as a positive cross of DI+ (blue line) over DI- (orange). Moreover, MACD has crossed above its signal and both of these lines are above zero.
Daily Chart 2 (TradingView)
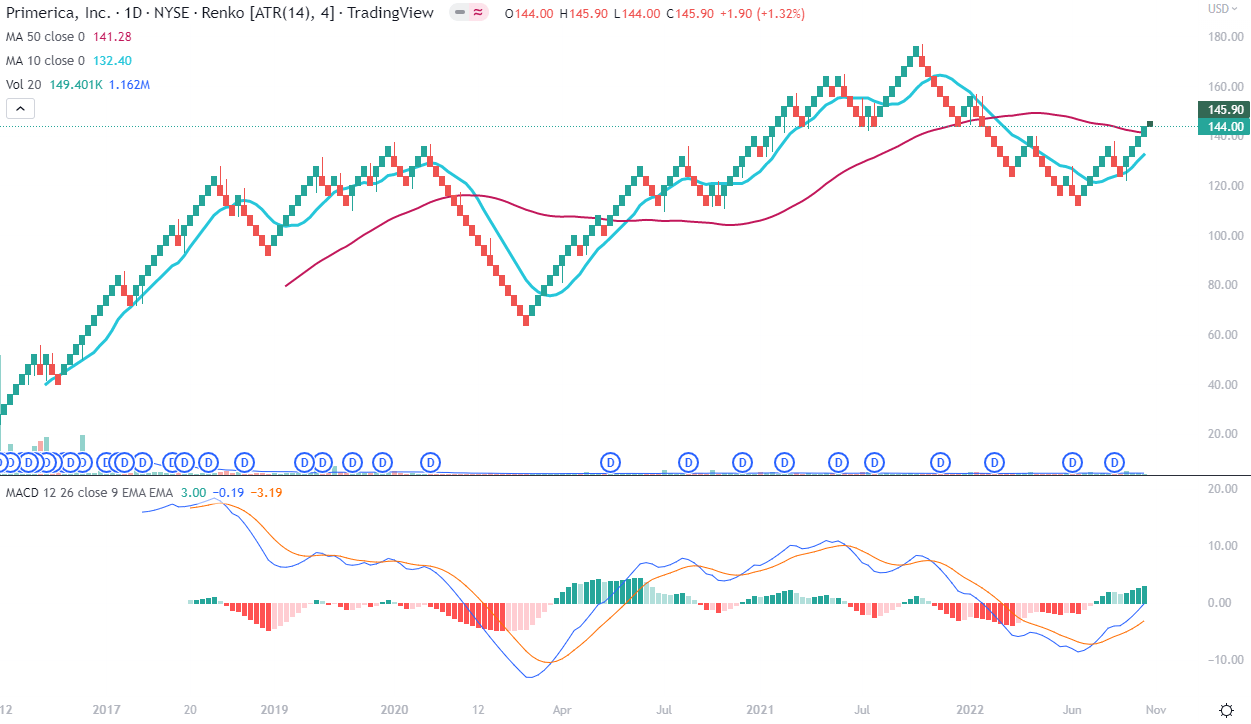
Price Momentum
The daily Renko chart presents an upcoming uptrend. Although nothing is ever sure, the fact that the fast average is approaching the slow one from below, that Renko boxes also have crossed the slow average and the MACD is crossing above the zero line might indicate the beginning of a new uptrend. The last time a similar MACD cross happened was in May 2020 at the level of $106.
Daily Renko Chart (TradingView)
Fundamentally speaking…
Primerica is a $5.38 B provider of financial services to middle-income families in the United States and Canada, offering life insurance, mutual funds, annuities, and other financial products. Middle-class households’ struggles with the rising cost of living have impacted negatively Primerica in recent times, following the pandemic and energy crisis. Their own financial security monitor, a survey of middle-income households, results indicate that many families are deciding to cut on non-essential spending, and for some families, this category will also include not taking or prolonging life insurance. Primerica has decided to tackle this headwind by rolling out a new set of products that combines technology enhancements (connectivity between clients, agents, and banks; electronic signature; apps), changing the communication with clients – a very interesting approach to increase the understanding of the products by clients thanks to the simplification of the language – as well as expanding the number of pricing classes from four to ten, which is supposed to help to allocate the client to a better risk-price category. All these changes started at the end of October, so just some days before the last Q3 earnings call, and according to the Senior Management, the first outcomes in the financial results should be noticeable from Q1 2023.
Primerica has also increased the licensing sales force thanks to some fee-discount actions over the Summer, while at the same time reducing the number of agents in the Senior Health division in order to keep the best and most productive and grow it from there. All in all, while equity markets volatility has caused losses of sales of the investment products (total sales down 23% YoY; nonetheless, monthly pensions saving programs seemed to persist), higher interest rates and changes in credit spreads led to an unrealized loss of $321M in the invested assets portfolio and affected the discount rates for valuation of the assets (causing e.g. goodwill impairment of $60M), Primerica’s management seems to have prepared in a responsible way to serve their target market even in those difficult economic circumstances. Primerica has also continued its stock buyback program in Q3 (repurchased $93M of common stock) and paid $21M in dividends with a forward dividend yield of 1.5%.
Conclusions
I feel positive about the fundamental side of the business, even if it is taking currently a hit and may not be on the radar of the analysts or in the headlines of financial news. Primerica’s stock seems to be emerging from a long correction and may be an interesting addition to a defensive portfolio that could rebound with the recovery of the economy. However, investors need to be aware that this may take time.
Be the first to comment