

PeopleImages/iStock via Getty Images
Investment Thesis
This year, investors are beginning to trust smart-beta ETFs, also known as factor-based ETFs, more. According to my research of 864 large-cap equity ETFs, 67.12% of smart-beta funds have positive YTD fund flows compared to 58.54% for plain vanilla funds like the SPDR S&P 500 ETF (SPY). One you may have come across is the Invesco FTSE RAFI US 1000 ETF (NYSEARCA:PRF), an ETF selecting 1,000 U.S. companies based on total cash dividends, free cash flow, total sales, and book equity value. I like what it offers, including a 13.46% estimated earnings growth rate and a 16.60x forward earnings valuation, significantly less than SPY’s 21.08x. However, my rating is limited to a hold because a competing fund has nearly identical features but saves you 0.14% per year in fees. I look forward to explaining my reasoning in more detail next.
PRF Overview
Strategy and Performance
PRF tracks the FTSI RAFI US 1000 Index, selecting and weighting 1,000 U.S. listed companies by a composite score based on total cash dividends, free cash flow, total sales, and book equity value. The selection universe is the entire NYSE and NASDAQ exchanges, so initially, this fundamentals-based ETF has the potential to be significantly different than traditional market-cap-weighted funds. However, it is more of a cross between the two. Logically, the companies with the most sales are also among the largest by market capitalization. The same is true for the free cash flow and book equity value screens, while the total cash dividends screen gives the Index a value lean.
A key drawback is the 0.39% expense ratio. However, it’s well-established with a track record dating back to December 2005 and assets under management of $5.76 billion. The following graph highlights PRF’s 8.97% annualized return since its inception, slightly outperforming SPY despite the extra 30 basis points in fees. Notably, PRF experienced higher volatility measured by standard deviation, leading to inferior risk-adjusted returns (Sharpe and Sortino Ratios).
Portfolio Visualizer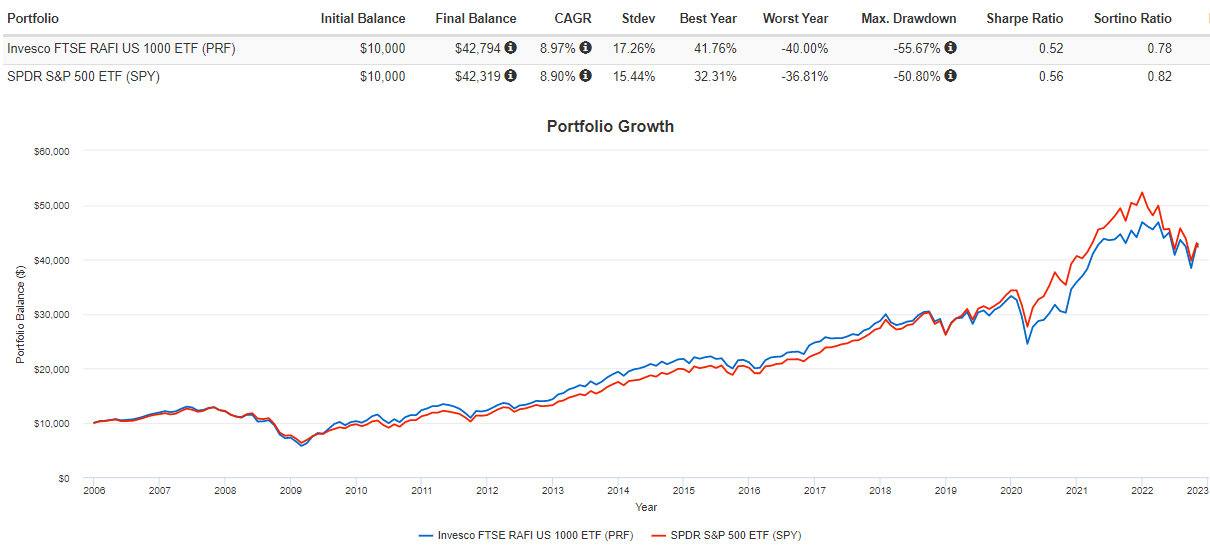
Readers can gain more insight by considering the following rolling returns chart. PRF mostly underperformed SPY in the three years ending October 2015, but it significantly outperformed SPY from March 2009 to February 2012, gaining an annualized 32.15% vs. 25.45%. PRF tends to make higher highs but lower lows, consistent with how higher-volatility funds often behave.
Portfolio Visualizer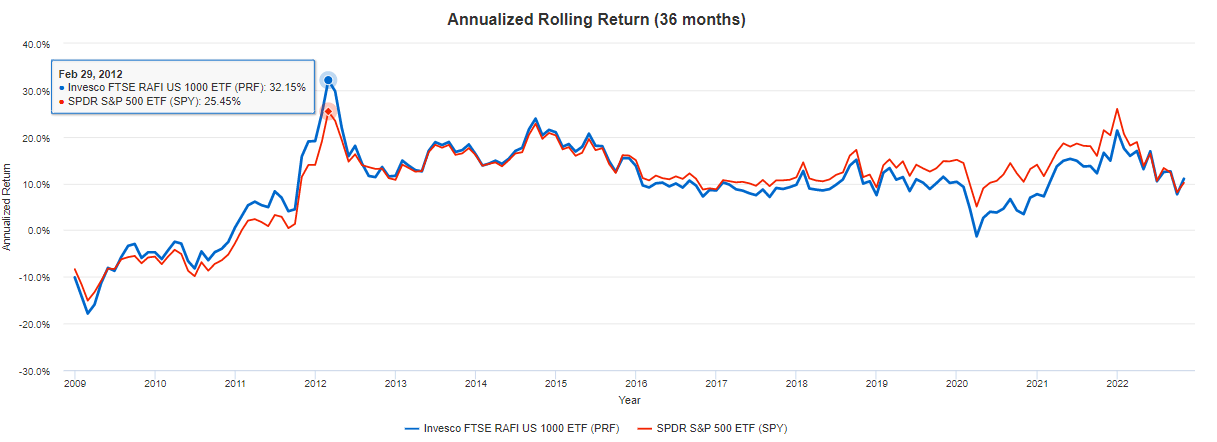
Sector Exposures and Top Holdings
PRF is better balanced than SPY, as indicated by its sector exposures below. The largest sector is Financials at 18.99% compared to SPY’s 25.49% Technology exposure. Also, its top 25 industries account for 56.99% of the portfolio compared to 65.64% for SPY.
Morningstar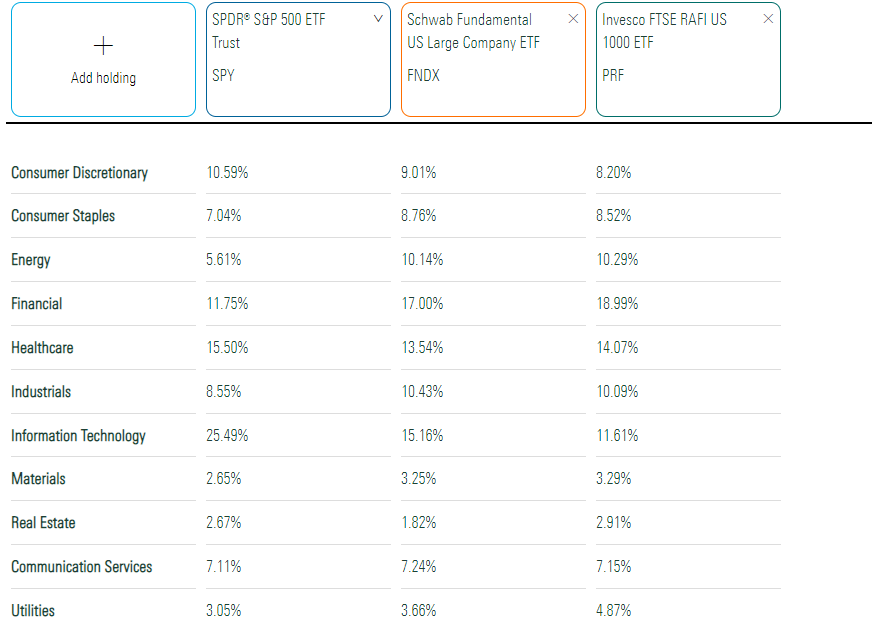
The added diversification is worth paying for, especially if you want to move away from the mega caps. However, 0.39% is too much. In my last article on PRF, I identified the Schwab Fundamental U.S. Large Company ETF (FNDX) as an alternative with nearly identical fundamentals at the time. Its 0.25% expense ratio makes it more affordable. It has a better track record since its inception and has even outperformed PRF since my article was published.
Portfolio Visualizer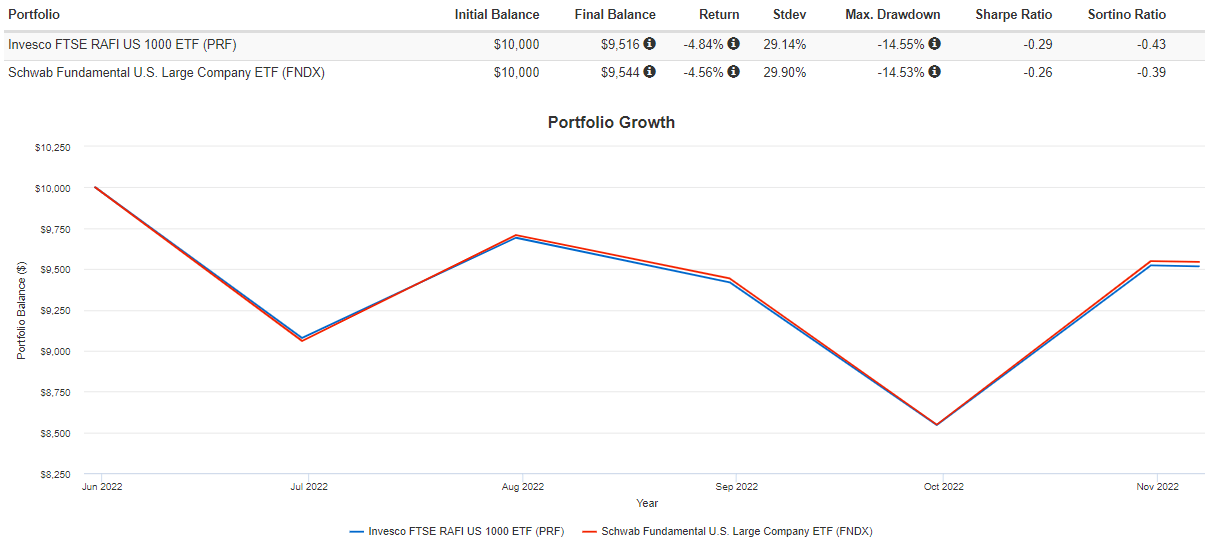
I will examine both ETFs’ fundamentals shortly to see if future outperformance is still likely the case, but first, let’s look at PRF’s top ten holdings.
Invesco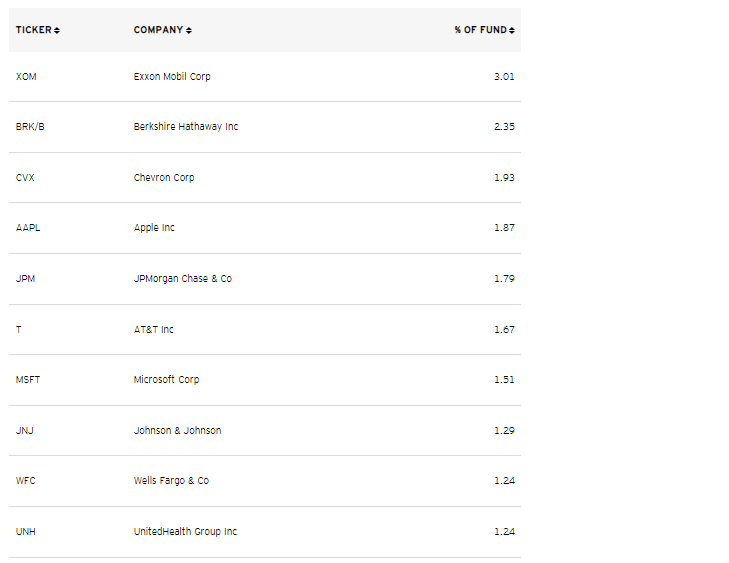
Exxon Mobil (XOM) is the top holding, which is appropriate given the high inflation environment. Energy stocks are a great defensive tool, and even though the sector is known for its volatility, XOM’s five-year beta is just 1.13, far less than most E&P stocks like ConocoPhillips (COP) and EOG Resources (EOG) offer. They’re still part of the portfolio but have much smaller weights of 0.48% and 0.22%, respectively.
I’m pleased to see Berkshire Hathaway (BRK.B) as the second largest holding with a 2.35% weighting. Chevron (CVX), Apple (AAPL), and JPMorgan Chase (JPM) round out the top five, but these weightings are still relatively small. The top ten accounts for only 17.90% of the fund vs. 26.55% for SPY. Diversification is an advantage in down markets, so I currently favor a rules-based strategy.
Fundamentals
The Case Against Mega Caps
At its core, PRF diversifies away from the mega caps. Using a $250 billion market capitalization figure as the threshold for mega caps, PRF holds 23 such companies with a combined weight of 24.13% compared to 38.02% for SPY. It’s a positive differentiator, especially given how the last earnings season went. The following table summarizes these results.
The Sunday Investor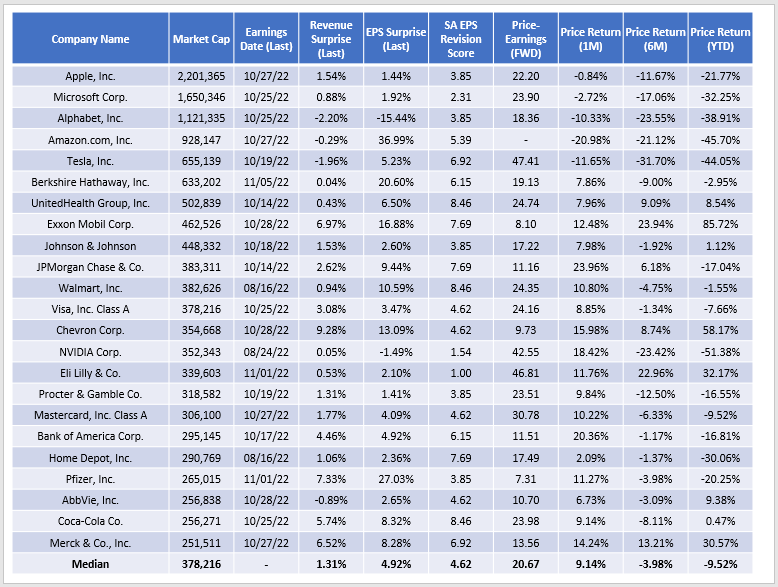
The top five companies by market capitalization are down 21.77%, 32.25%, 38.91%, 45.70%, and 44.05% YTD. The median sales and earnings surprises for these mega caps also disappointed at 1.31% and 4.92%, respectively. These are the same group of stocks that became post-pandemic market leaders with 20%+ earnings surprises on average, and now many of those gains are reversing. These negative trends are reason enough to diversify away from mega caps.
Yardeni Research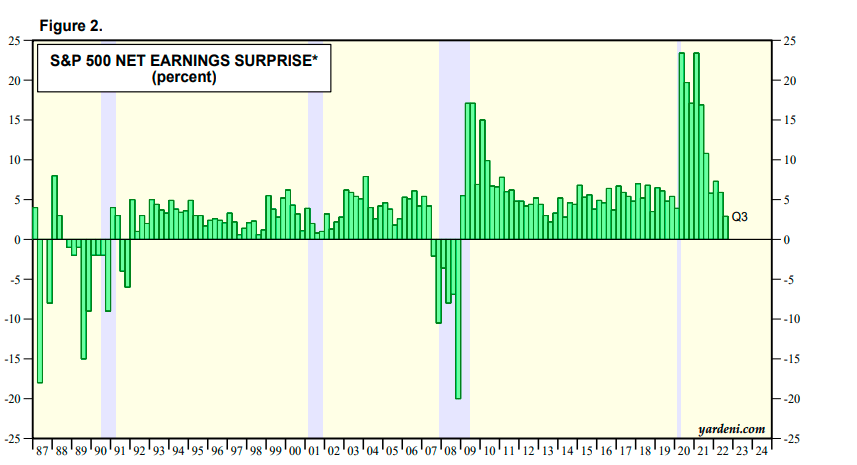
PRF Fundamentals vs. FNDX, SPY
The following table highlights fundamental metrics for PRF’s top 25 holdings. I’ve also included summary metrics for PRF and SPY, and it’s interesting how we see the metrics change as we include fewer holdings. PRF has 1,000, FNDX has 720, and SPY, of course, has 500.
The Sunday Investor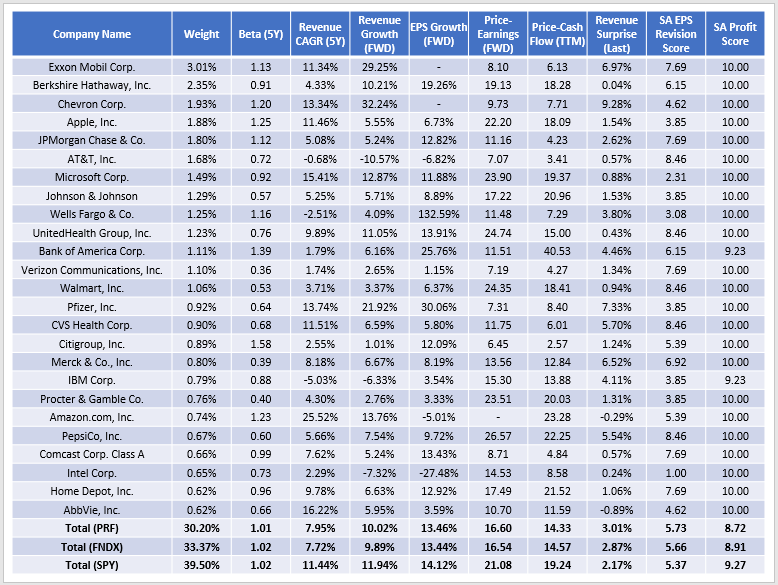
The main selling point for investors deciding between PRF and SPY is PRF’s lower valuation. It trades at 16.60x forward earnings and 14.33x trailing cash flow, or about 4-5 points lower. Estimated sales and earnings growth is competitive despite the move away from the mega caps. You can also see the superior momentum in the form of a higher last quarter sales surprise (3.01% vs. 2.17%) and a better Seeking Alpha EPS Revision Grade (5.73 vs. 5.37), which I’ve normalized on a ten-point scale. The main negative is a lower Seeking Alpha Profitability Grade (8.72 vs. 9.27), so there may be some “diworsification” going on here.
Instead, FNDX remains the smarter alternative. The table above highlights a superior profitability score (8.91 vs. 8.72), and virtually identical volatility, sales growth, earnings growth, and valuation. The 0.14% per year savings on fees will also add up over the long run. Assuming a 9% gross annual return over ten years, PRF shareholders will lose 6.10% of their total gains to fees compared to 3.93% for FNDX. This difference is substantial if you have a sizable portfolio, and seeking out low-cost investments is extremely important for building wealth.
Investment Recommendation
PRF has many qualities I like, including double-digit estimated sales and earnings growth and a discounted valuation. It’s well-diversified and less exposed to mega-cap companies, which should prove beneficial if the latest earnings trends are any indication. Unfortunately, its 0.39% expense ratio is PRF’s Achilles’ heel, especially since a near-identical portfolio in FNDX charges just 0.25%. Therefore, I’m maintaining my rating on PRF to a hold and look forward to discussing it and other alternatives in the comments below.
Be the first to comment