

Diego Thomazini/iStock via Getty Images
This article was first released to Systematic Income subscribers and free trials on Apr. 11
Welcome to another installment of our Preferreds Market Weekly Review where we discuss preferreds and baby bond market activity from both the bottom-up, highlighting individual news and events, as well as top-down, providing an overview of the broader market. We also try to add some historical context as well as relevant themes that look to be driving markets or that investors ought to be mindful of. This update covers the period through the first full week of April.
Be sure to check out our other weekly updates covering the BDC as well as the CEF markets for perspectives across the broader income space.
Market Action
It is little surprise that preferreds didn’t have a great week – all sectors were down. Year-to-date only the Energy sector is in the green. Higher-quality / lower-coupon and convertible-heavy sectors are the underperformers so far this year.
Systematic Income Preferreds Tool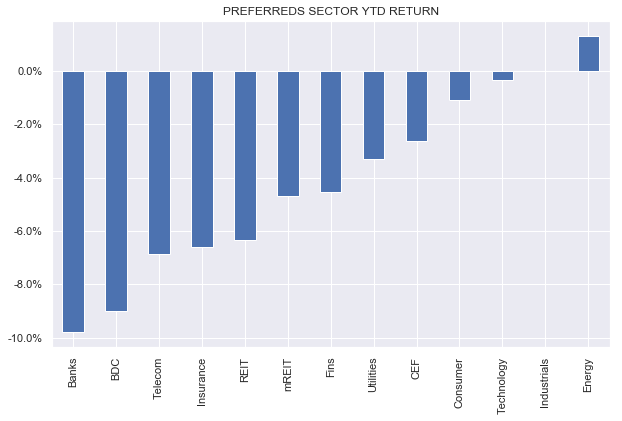
10-year Treasury yields rose every day this week, finishing the week 0.5% higher. Until Treasury yields settle down, they will continue to keep pressure on the preferreds space.
Credit spreads widened as well which did not help the sector either. Historically, credit spreads help to mitigate the impact of Treasury yield moves, however, more recently they have been moving in-sync (i.e. higher Treasury yields coinciding with wider credit spreads and vice-versa). This has generated excessive volatility and drawdowns in preferreds and will likely continue to do so, so long as inflation and the Fed continue to be the key drivers of markets.
Market Themes
The price action this year has highlighted two related dynamics for preferreds investors. First, is the relative lack of coupon structure diversification. More than three-quarters (at least going by our investor Preferreds Tool) of the exchange-traded market is fixed-coupon. And second, is the fairly high-quality make-up of the sector with close to half of the sector having either investment-grade issuers or being in heavily-regulated industries such as Utilities.
What this combination of features translates into is the fact that most of the sector is made up of high-quality / low-coupon stocks. Normally, we would think of these securities as relatively defensive, however, the market environment year-to-date of rising Treasury yields and range-bound credit spreads hit these higher-quality / fixed-coupon securities particularly hard. This was caused by their longer-duration profile (a direct outcome of their lower coupons) and the fact that their lower beta to moves in credit spreads didn’t save the day because credit spreads didn’t move a whole lot.
What this suggests is that rather than thinking of allocation in terms of a single dimension of lower or higher quality investors should rather think across multiple dimensions of coupon structure (i.e. Fix vs. Fix/Float), coupon level (i.e. low-coupon vs. high-coupon), convertible vs not and credit quality (i.e. investment-grade vs. sub investment-grade or unrated).
Building a diversified portfolio based on individual preferreds can be a hard lift for some investors, however, it’s not really necessary and may not be appropriate for everyone. The good news is that it can be easier to build a diversified portfolio by allocating to preferreds funds. A side benefit of using funds is that they also provide investors additional diversification dimensions such as active vs. passive management and institutional vs. exchange-traded / retail preferreds sub-sectors.
Of course investors don’t have to choose one or the other. It’s perfectly sensible to have a number of high-conviction individual preferreds coexisting with a number of preferreds funds in income portfolios.
Preferred ETFs with a focus on Fix/Float stocks are the Invesco Variable Rate Preferred ETF (VRP) and the Global X Variable Rate Preferred ETF (PFFV). These funds have held in much better than broader preferreds funds year-to-date.
Systematic Income Preferreds Tool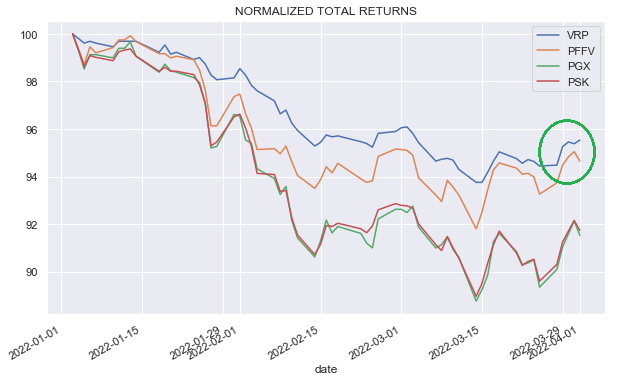
ETFs that are focused on institutional preferreds include the First Trust Institutional Preferred Securities and Income ETF (FPEI) as well as the Principal Spectrum Preferred Securities Active ETF (PREF). These funds have held in better than those focused on the exchange-traded / retail sub-sector. This is likely due to the fact that most institutional preferreds are Fix/Float and the fact that the institutional market is less prone to the boom-bust flows due to rapidly changing risk sentiment of retail investors.
Systematic Income Preferreds Tool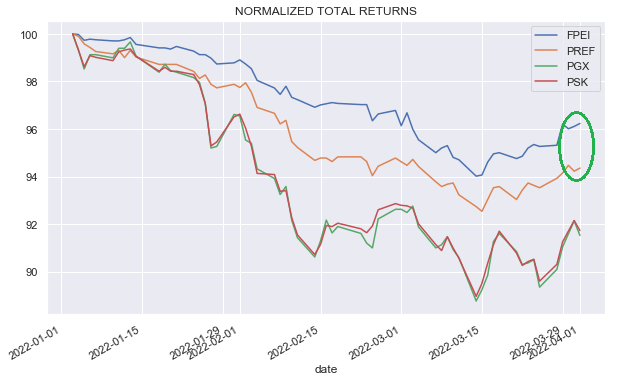
Unlike the majority of preferreds and preferreds funds which have a higher-quality flavor, a fund that has a higher-yield allocation profile is FPE with a majority sub investment-grade / unrated profile. Higher-yielding preferreds typically carry higher coupons which shortens their duration profile and their higher yields can more quickly offset capital losses due to rising Treasury yields.
Within the ETF space we continue to like FPE with a 4.73% TTM yield which has put up pretty strong historic returns which are competitive with many sector CEFs. It features an overweight of institutional and Fix/Float stocks as well as active management. Investors with a higher risk appetite should have a look at the 8.12% yielding Virtus InfraCap US Preferred Stock ETF (PFFA) which carries some leverage and has a high-yield focus.
Fans of preferred CEFs should also have a look at the John Hancock trio of funds: HPI, HPS and HPF. These funds have a relatively low financials allocation, about half that of the other preferred CEFs which provides better sector diversification. They also have a sizable allocation to corporate bonds which shortens up their duration profile.
Market Commentary
The RiverNorth CEF RIV is doing a preferred offering (RIV.PA). It feels like pretty poor timing on their part to do it when yields are a lot higher – should have done it before the spike. The fund is basically 2/3 CEFs and 1/3 SPACs so there is already a level of embedded leverage in there on top of explicit leverage that the preferreds will create. We‘ll see where the coupon comes out – however it would have to be well north of 5.5% to be interesting.
At current levels, ACP.PA, NCV.PA, NCZ.PA, EICA, OPP.PA and OPP.PB are all trading at roughly around 5.2-5.6% yields and would be stronger quality than the RIV portfolio. As usual, (RMPL.P) is a steal with a very strong portfolio and an Oct-2024 maturity if you can get it close to $25.
There was a comment about (WFC.PL) in the recent weekly wondering why L remains so much cheaper than the rest and suggesting it‘s due to the conversion risk. L can be converted by the issuer if the common rises substantially. As it happens (WFC.PQ) does trade at a slightly higher yield than L but L is clearly on the cheaper end of WFC preferreds.
The conversion risk itself is not actually worth that much quantitatively (i.e. if you price it as a knock-in put which is basically what it is) even when the stock was trading around $1500 so that doesn‘t really explain it. And now the conversion risk is zero because the stock trades below the conversion price i.e. if converted, holders will have a small windfall rather than a loss.
The real reason L remains cheap is likely due to market segmentation – lots of people are probably put off by the $1300 a share price as they are used to $25. There is also a misconception about people being hesitant “paying over par” ($1000 liquidation preference in the case of L) which is silly because not only is L non-callable but it obviously doesn‘t mature at par like a bond.
It would be entirely sensible to worry about a price being substantially above “par” if 1) there was a significant risk of default and 2) the recovery was likely to be substantial. This is because the recovery paid out is on the “par” or liquidation preference amount so a security trading significantly above par would get a lower relative recovery on its price than a security trading closer to par. Geeks interesting in this valuation concept should investigate something called the par-equivalent CDS spread, which is a clever industry way to compare corporate bonds of the same issuer to each other that trade at different prices. However, unlike in corporate bonds, this is not an issue for preferreds because their recovery is likely to be very close to zero anyway, particularly for bank issuers.
The other thing to consider is that even though Q and L trade at roughly the same yield, L is still more attractive because it’s non-callable. Think of it this way – with Q you are paid about the same yield as L but you’re also short an option (Q is callable) with no compensation. Being short the call to the issuer for free is clearly wrong i.e. the issuer call is worth quite a lot. If rates collapse Q is going to disappear and if they blow up you are stuck in a low-yielding (on cost basis) stock. With L, it‘s different. If rates collapse L doesn‘t go away so you enjoy the large gain (it‘s already trading 30% above “par” which obviously couldn‘t happen with a callable stock). In short, all else equal, a callable security should trade at a higher yield than a non-callable security – basic bond math. If they trade at the same yield no one should ever buy the one where they also sell a call for free. But sometimes in the retail space the basic laws of the universe break down.
There was a recent article headline about why 11% yield CIM is a great stock to hold. There are three things that people who pitch mREIT common stock often miss, particularly relative to preferreds.
These are first, current yield of the common will be reduced by portfolio losses, in the case of hybrid mREITs and negative convexity of agency MBS for agency-focused mREITs whereas preferred yields are what it says on the tin (yes they can be deferred – it‘s a low risk).
Second, mREIT common is a fragile instrument and highly sensitive to market volatility which causes most companies to reduce leverage, requiring them to sell low and buy back high – we saw this quite clearly in 2020. Most mREITs still trade at significantly lower book values than in early 2020
Third, historical common returns have tended to be below that of the preferreds and CIM is no exception. The chart below shows that the preferreds have delivered a superior return over time with much lower volatility. The start of the chart coincides with the first trading date of currently outstanding preferreds.
Systematic Income Preferreds Tool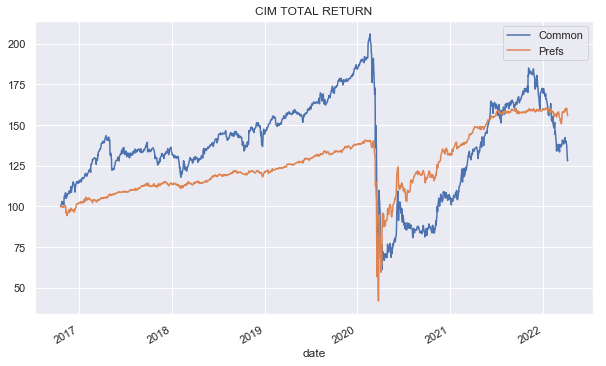
Investor Toolkit Update
This week we expanded our reset yield metrics by incorporating both SOFR and 5-year CMT base indices in our investor Preferreds Tool.
As a quick summary, reset yield are the yields that investors will experience once the given Fix/Float stock moves past its first call date (and remains unredeemed).
Most Fix/Float preferreds have 3-month Libor as their base floating rate, however, some also have SOFR or the 5-year Treasury yield (aka 5y CMT yield aka 5y constant maturity treasury yield).
To give an example, the table below shows four NRZ preferreds, three of which have Libor as the base rate and one (NRZ.PD) has 5y CMT as the base rate. Our approach to calculating the reset yield of Libor-based securities is to use Libor forwards. This confuses a lot of investors who look at our reset yields and say, well your reset yield assumes a, say, 2.5% Libor and Libor is now only 1% so it’s wrong. The simple reality is that using Libor forwards is industry practice and it’s how you would value securities on a bank trading desk. It is also more intuitive since using current Libor to project a yield in a 1 year’s time makes very little sense since the Fed has more-or-less already committed to a series of hikes (which are, more importantly, also fully priced in by markets).
As a geeky sidebar, when we use the 5y CMT rates we don’t use CMT forwards. This is technically inconsistent, however, in our view it is less of a problem because 1) unlike the short-end of the curve, the belly of the curve tends to be pretty flat anyway as it is now, meaning 5y CMT forwards and 5y CMT par rates are not very different and 2) using the current 5y CMT par rate is more intuitive than using a forward rate (a reversal of the Libor argument, mind you).
Let’s have a look at how all this works for the NRZ preferreds below.
Systematic Income Preferreds Tool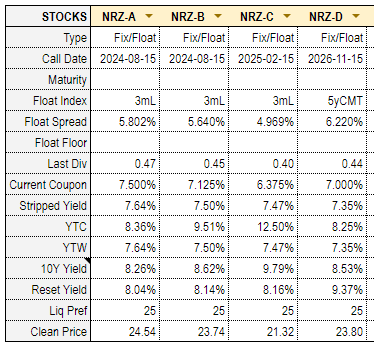
Currently, NRZ.PD has the lowest stripped yield of the four, however, once we glance at the forward yield chart we see that its reset yield after its first call date is miles above the other preferreds. This kind of dynamic of low stripped yield / high reset yield is very common. To provide the quick math on the NRZ.PD reset yield of 9.37% it is just the current 5y Treasury yield of 2.70% + the spread of 6.22% divided by the stripped or clean price of $23.80 x $25.
Systematic Income Preferreds Tool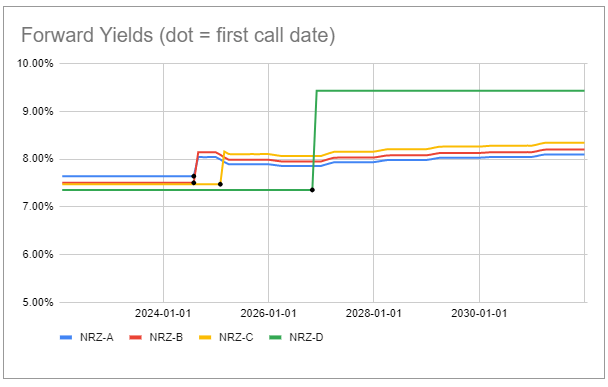
This presentation makes it very clear that NRZ.PD has a clear cost over the first few years but is also a clear winner after its first call date in 2026 assuming the yield curve is not miles off where it is now. Obviously, Treasury yields can collapse back down or the stock can be redeemed so this yield boost is not guaranteed. We will have a deeper dive into the NRZ suite in an upcoming article.
Stance & Takeaways
The current environment of an unrelenting march higher in longer-end rates has continued to favor our higher-rates playbook consisting of five types of securities: higher-coupon such as WFC.PL and LBRDP, Fix/Float with high reset yields such as NYMTM, term securities such as AIC, pinned-to-par securities such as ECCX and CMT-linked preferreds such as NRZ.PD and SPNT.PB.
Ultimately, our view is that the currently underperforming higher-quality / low-coupon securities such as investment-grade or crossover-rated bank preferreds will have their day but probably not before they see more volatility and downside from higher Treasury yields. More tactical investors, particularly those with a more bearish macro outlook, will likely want to start nibbling on some of the low dollar-price stocks such as JPM.PM and MS.PO, both trading at decent yields of around 5.3% and which should see the largest rally once Treasury yields peak and move lower in response to a recessionary environment.
Be the first to comment