

designer491
Introduction
Managed futures strategies (aka CTAs1) have a long history of playing a key role in enhancing investment portfolios for wealthy individuals and institutions with access to hedge funds. With recent SEC rule changes around the use of leverage and derivatives, managed futures are now available via ETFs, democratizing one of the most compelling risk exposures outside of bonds and equities. This blog begins with a brief overview of managed futures, then walks the reader through the three core potential portfolio benefits:
1. absolute returns
2. low correlation to equities
3. positive convexity in risk-off events
We then show how pro rata shifting a slice of the classic 60/40 portfolio into CTAs can ultimately enhance risk-adjusted returns. Finally, we show that managed futures can also serve as a compelling inflation hedge, that can continue to be accretive to portfolios even during non-inflationary periods.
What Are Managed Futures?
Managed futures strategies target consistent, diversified returns through systematic, rules-based investment in a portfolio of futures contracts across equity, fixed-income, commodity, and foreign-exchange markets. These funds typically deploy a suite of distinct algorithms that forecast expected risk and return across all markets considered and across multiple forward-looking time horizons. These signals are then aggregated into a portfolio of long/short holdings, with more advanced CTAs accounting for things like correlations, transaction costs, and market impact when scaling positions in and out of the portfolio. Managed futures strategies are also usually managed to achieve a target volatility (based on historical data analysis). Let’s now review some of the more common types of models used within CTAs.
The core algorithm used by CTAs is “trend following”, which invests based on current price trends (i.e. momentum). Trend following simply relies on the continued persistence of price movement to generate returns. You can think of trend following strategies like a long option (call or put) position, since the position size is scaled higher (long or short) as the security trend strengthens or weakens. These strategies are a key source of both absolute return, low correlation to equities, and positive convexity.
“Overbought/oversold” strategies are a ballast to momentum algorithms, designed to help improve entry and exit of the core trend-following systems. These models are typically price-based, taking the form of oscillators such as the Relative Strength Index. More sophisticated versions of these strategies could be more fundamental in nature, where macro- and micro-economic factors, both fundamental and quantitative, are used to establish “fair” value the asset should mean-revert towards.
“Carry” trades represent a third key strategy for managed futures, with the goal of seeking to monetize structural risk premia embedded in futures calendar spreads. For example, a common carry trade is to capture the roll yield available on the Treasury yield curve, which will contribute an absolute return if the curve is static, while simultaneously offering a risk-off hedge by virtue of being long Treasuries.
Finally, “volatility breakout” indicators are often used by shorter-term managers to enter a position in the direction of an event that they believe would trigger the largest players to buy or sell based on an upcoming trend signal. For example, when the long-term trend is flat, a violent move in either direction might subsequently trigger an entry by a large long-term trend-follower, and would provide a large tailwind for an earlier entry.
Effectiveness of Managed Futures
The three most often-cited potential portfolio benefits of CTAs are
1. absolute returns
2. low correlation to equities
3. positive convexity in risk-off events
Let’s now see if managed futures really deliver on each of these fronts.
Absolute Returns
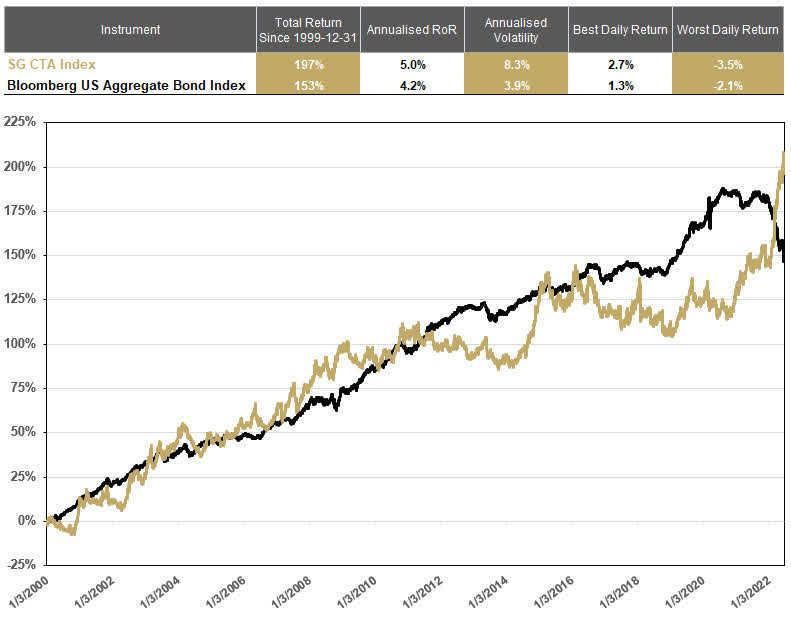
Figure 1 shows historical returns of the SG CTA Index2 versus the Bloomberg US Bond Aggregate Index. Since 2000, the managed futures index has consistently appreciated alongside the bond market, while tending to outperform during periods of bond market selloffs and higher inflation prints. Even though the CTA index has experienced periods of higher volatility with inferior risk-adjusted returns to the broader bond market, an absolute return-like profile has indeed been delivered.
Figure 1: Return Profile of CTAs (12/31/99-6/30/2022)
Low Correlation with Equities
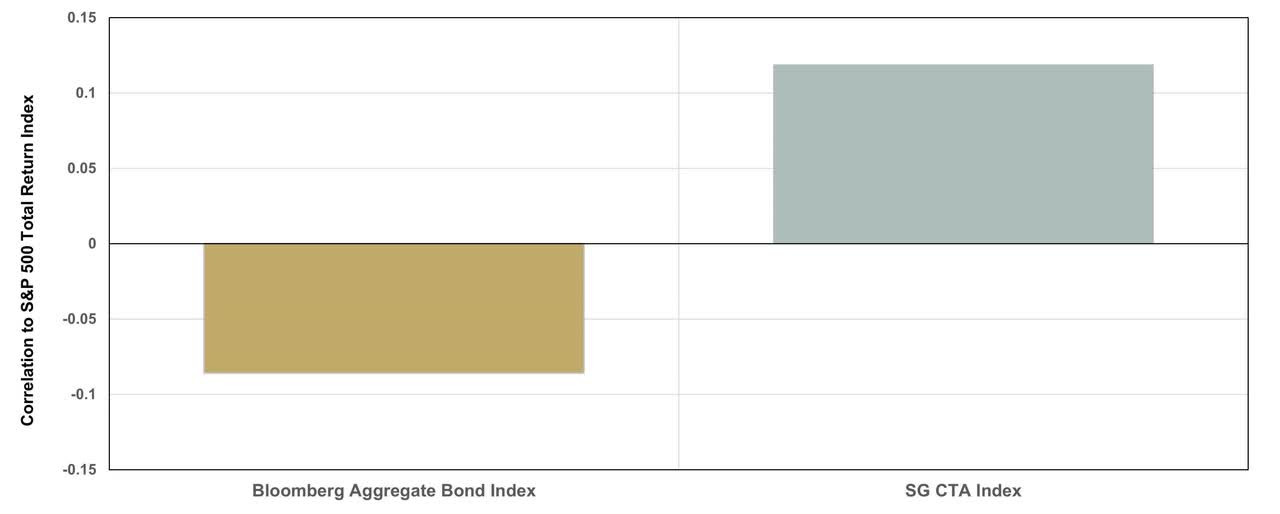
Figure 2 shows that the correlation between the SG CTA Index and the S&P 500 Index is close to zero over our full sample period, very similar to bonds. The slightly higher correlation seen in CTAs (versus bonds) is driven, as expected, by periods of bullish equity positioning, so one could certainly lower this correlation by removing (or reducing) equities within the asset class mix.
There are also potential diversifying benefits of CTAs relative to bonds. Sharp rises in interest rates, which are visible in declines in the black line in Figure 1 above, generally coincide with gains in CTAs who can dynamically shift their duration exposure (unlike bonds) and increase inflation-sensitive exposures.
Figure 2: Correlation With Equities (12/31/99-6/30/2022)
Positive Convexity During Equity Selloffs
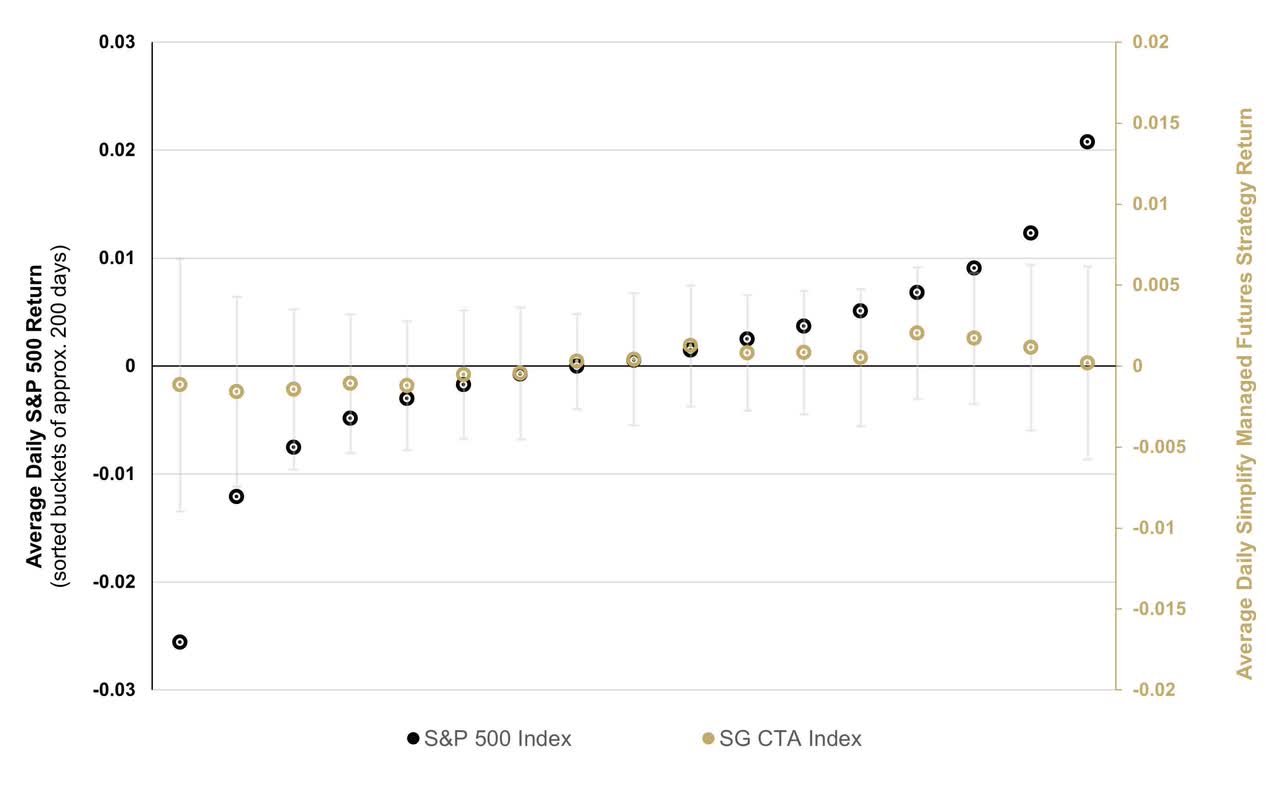
Figure 3 shows the SG CTA Index performance bucketed in S&P 500 daily performance regimes. What becomes clear is that, on a daily basis, when equities drop -0.5% or less, CTAs demonstrate positively diverging performance characteristics. One may wonder initially if this is more of a muted beta to equities, or maybe even a beta near zero. But upon careful inspection, you indeed see the beta between CTAs and the S&P500 becomes increasingly negative as equity performance worsens, precisely the characteristic of positive convexity.
Figure 3: Performance Across Equity Regimes (12/31/99-6/30/2022)
Portfolio Diversification with Managed Futures
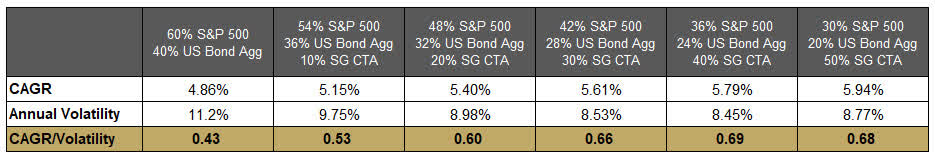
The absolute return profile of CTAs, combined with their diversifying benefits relative to equities and bonds, can offer significant diversification and return improvements when incorporated into traditional asset allocations. This is demonstrated in Figure 4 below.
Incorporating an allocation to a managed futures strategy (proxied here by the SG CTA Index) into the traditional 60% S&P 500/40% US Bond Aggregate portfolio results in a higher return with lower volatility. Its worth noting, that even a 10% allocation to CTAs produces immediate value. Once allocations get past 30-40%, there is some marginal degradation as seen by a peak in risk-adjusted returns in this allocation range. This risk-adjusted enhancement to a traditional equity/bond mix succinctly captures why managed futures are so interesting to allocators.
Figure 4: Incorporating Managed Futures into the Classic 60/40 Portfolio (weekly rebalancing)
Returns in Inflationary Periods
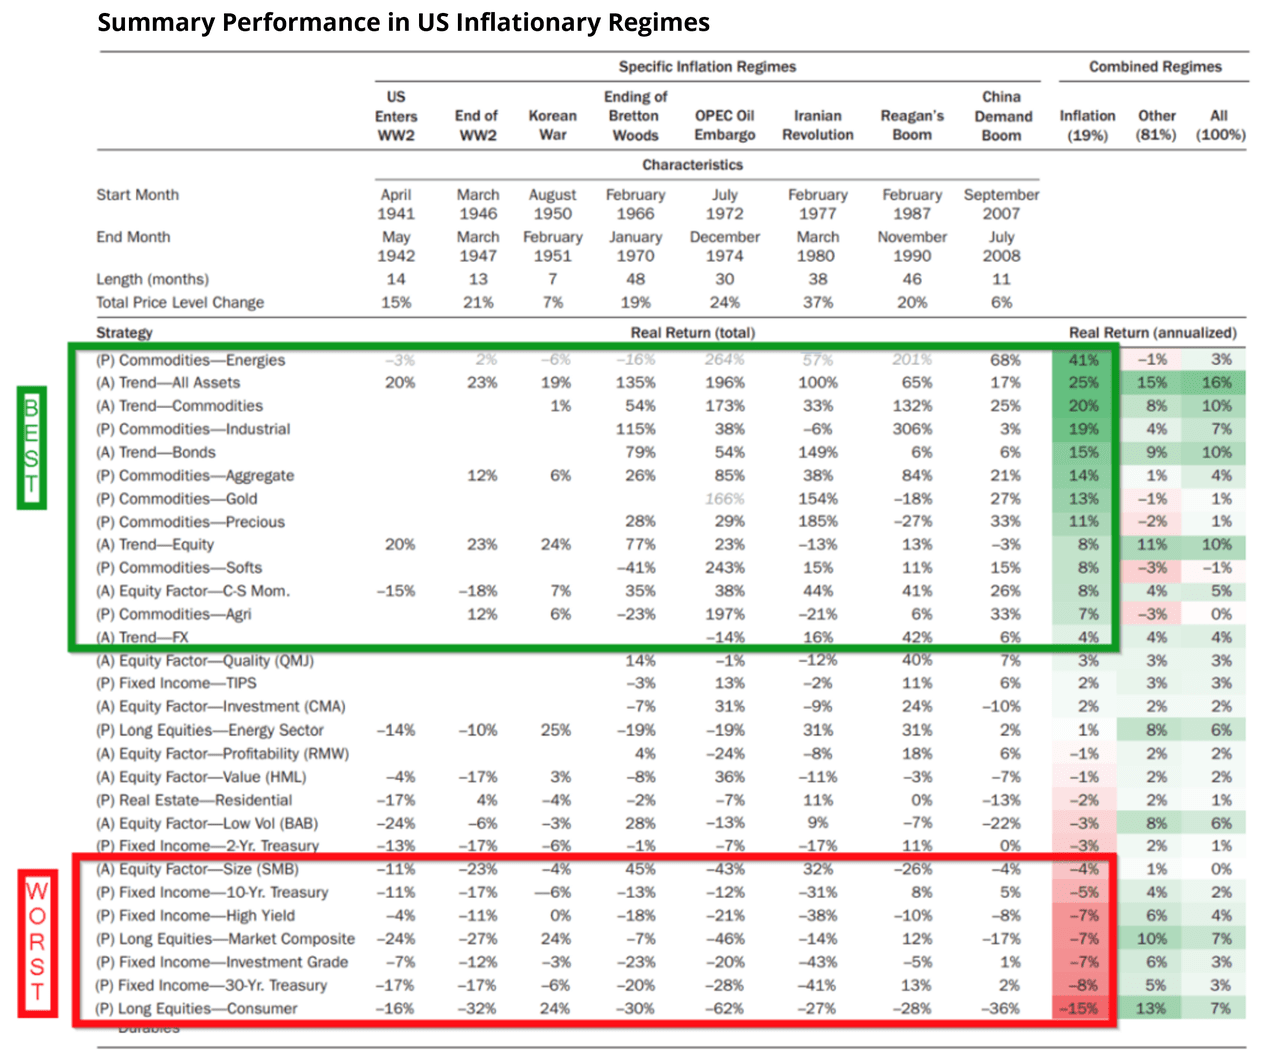
Inflation is a risk that is often overlooked in portfolios. This is even more true now as we haven’t experienced significant inflation in many decades. Figure 5 shows the performance of multiple asset classes, as well as trend following (the dominant strategy in CTAs) deployed within the different asset classes, across inflationary and non-inflationary market regimes.
Not surprisingly, long-only commodities are generally the best performing assets during inflationary regimes (see third from last column) and dominate the top of the list. Less obvious is that trend following in both commodities and bonds performs incredibly well during inflationary periods, holding the third and fifth positions on the list, respectively. In addition to a unique ability to hedge portfolio inflation risk, these two trend strategies (unlike long-only commodities) also perform very well during non-inflationary regimes (see second from last column), which makes up about 81% of the sample period studied.
Also note that long-only fixed income and equities dominate the bottom of Figure 5, reminding us how susceptible the classic 60/40 reviewed in Figure 4 is to inflation shocks.
Figure 5: Trend Following Performance During Inflationary Regimes
Parting Words
We have shown how managed futures can be a powerful absolute return solution and a complement to bonds as an equity diversifier with their low correlation to equities and positive convexity in risk-off events. We have also demonstrated impressive risk-adjusted return improvements to the classic 60/40 portfolio when pro rata moving a portion of the portfolio into CTAs. Finally, we have seen how managed futures can also serve as an inflation hedge that continues to add performance to portfolios during non-inflationary periods.
[1] Managed futures strategies must be managed by NFA-registered commodity-trading advisors (“CTAs”), hence why you often see these terms used interchangeably.
[2] The SG CTA Index calculates the net daily return of the 20 largest CTAs open to new investment. Index constituents are equal-weighted and reconstituted annually.
Simplify Asset Management Inc. is a Registered Investment Adviser. Advisory services are only offered to clients or prospective clients where Simplify Asset Management Inc. and its representatives are properly licensed or exempt from licensure. SEC registration does not constitute an endorsement of the firm by the Commission, nor does it indicate that the advisor has attained a particular level of skill or ability. Be sure to first consult with a qualified financial adviser and/or tax professional before implementing any strategy. This website and information are not intended to provide investment, tax, or legal advice.
This website is solely for informational purposes and does not intend to make an offer or solicitation for the sale or purchase of any specific securities, investments, or investment strategies. These materials are made available on an “as is” basis, without representation or warranty. The information contained in these materials has been obtained from sources that Simplify Asset Management Inc. believes to be reliable, but accuracy and completeness are not guaranteed. This information is only current as of the date indicated and may be superseded by subsequent market events or for other reasons. Neither the author nor Simplify Asset Management Inc. undertakes to advise you of any changes in the views expressed herein.
Past performance is no guarantee of future returns. Investing involves risk and possible loss of principal capital.
Unless otherwise noted, any performance returns presented in these materials reflect hypothetical performance. Hypothetical strategies and indices presented are unmanaged, do not reflect any fees, expenses, transaction costs, commissions, or taxes, and one cannot invest directly in any of these. The results presented should not be viewed as indicative of the adviser’s skill and do not reflect the performance results that were achieved by any particular client. During this period, the adviser was not providing advice using this model, and clients’ results may have been materially different. Hypothetical model results have many inherent limitations, some of which, but not all, are described herein. One of the limitations of hypothetical performance results is that they are generally prepared with the benefit of hindsight. In addition, hypothetical trading does not involve financial risk, and no hypothetical trading record can completely account for the impact of financial risk in actual trading.
Editor’s Note: The summary bullets for this article were chosen by Seeking Alpha editors.
Be the first to comment