

The chemokine receptor 5 (CCR5) with a bound antagonist selvanegra/iStock via Getty Images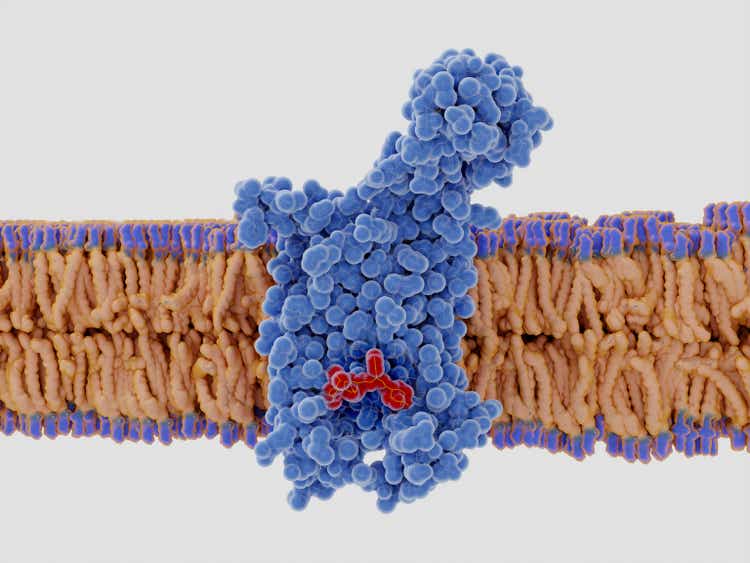
Overview
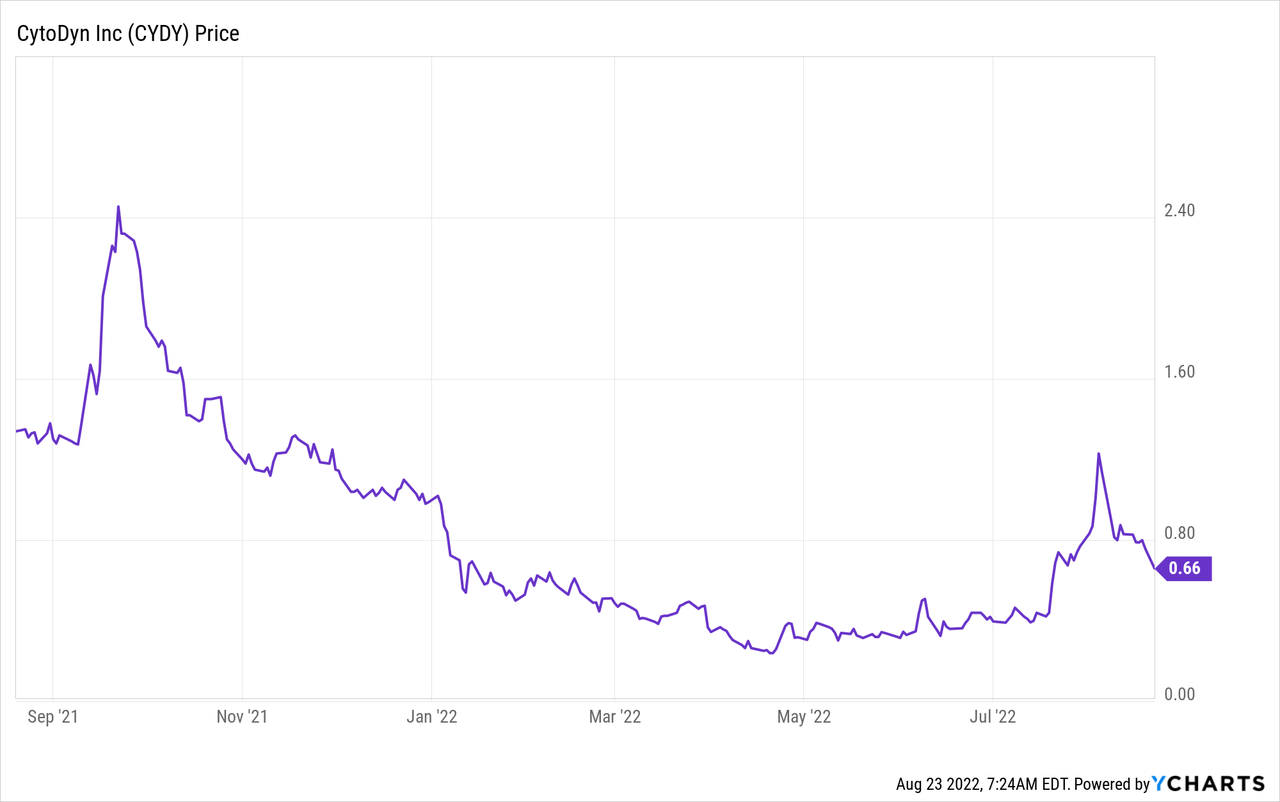
CytoDyn Inc. (OTCQB:CYDY) is a Vancouver, WA-based small cap research and development biotechnology business with a focus on the clinical development of therapeutic treatments for multiple indications. According to Stock Market MBA, it is listed as a penny stock and trades on the OTCQB under the ticker symbol (OTCQB:CYDY). As of August 22, 2022, its share price was .66 cents, average traded volume was 2.22M shares and it has a market cap of $535.076M. The 52W high is $2.5400 and the 52W low is $.2311.
This article will explore the total addressable market (“TAMS”) for Non-Alcoholic Steatohepatitis NASH, the headwinds facing CYDY, explain how multiples are applied by Wall Street to non-revenue generating biotech’s and provide a fair value on CYDY should NASH be approved by the FDA in the future.
Future articles will include discussion an additional TAMS analysis for HIV, mTNBC and potentially long-haulers as a result of COVID.
Leronlimab
CytoDyn’s lead product candidate Leronlimab, is a humanized monoclonal antibody that targets the CCR5 receptor. The CCR5 receptor is believed to be involved in immune-mediated inflammation such as NASH and other indications such as cancer, autoimmune diseases, other inflammatory diseases, infectious diseases and more.
Leronlimab is also showing signs of promise in several other indications including HIV, mTNBC, SARS-CoV-2 and NASH however, the problem is the United States Food and Drug Administration FDA has required CYDY to walk back some comments made by their prior CEO, Nader Pourhassan, after he misspoke on the effectiveness of the drug for other indications in a promotional video. Adding more pain to the process, the FDA placed a temporary clinical hold on their HIV development and COVID trials until CYDY management can address concerns that partially involve a Contract Manufacturing Organization CMO that presented flawed data because of flawed CMO processes.
Taken from the CYDY website (emphasis added):
On February 11, 2022, CytoDyn, Inc. received a Warning Letter from the U.S. Food and Drug Administration’s (FDA) Office of Prescription Drug Promotion in which FDA asserted that statements made in a video created a misleading impression regarding the safety and efficacy of leronlimab. Leronlimab is an investigational drug that has not been approved (or authorized) by the U.S. FDA for the treatment of COVID-19 or for any indication. For more information, click here to access a Dear Healthcare Provider Letter: View Here.
Ramifications, such as a letter from the FDA are not only unacceptable, they’re costly to investors, delay the development of lifesaving new therapies and handicap management going forward. Fortunately for CYDY investors the NASH trials are not on the FDA clinical hold list.
Some CEOs are chatterboxes…other’s never say anything. I’ve been on both sides of that leadership as a small cap biotech investor and nothing good ever came from either one. The efforts to promote promising new drug candidates and the need to raise working capital is exhaustive and takes a certain charisma and personality as the CEO must be able to identify and walk a fine line between what is legal, moral and ethical to promote and in some cases, withhold from investors. In the case of the former CEO, he had a philosophy of complete transparency with shareholders which ultimately may have resulted in his departure.
Non-Alcoholic Steatohepatitis – NASH
From the CYDY 10K found on the SEC website concerning product development for NASH:
CytoDyn’s core areas of clinical development are HIV, Nonalcoholic Steatohepatis (“NASH”), and solid tumors in oncology…In NASH, our focus will be on the general population of those affected by NASH, and the subpopulation of patients with NASH and HIV…The areas of clinical development and focus are under review by our executive management.
NASH is a medical condition resulting in the accumulation of excess fat deposits in the liver organ. This fatty condition will eventually cause inflammation and ultimately result in cell injury limiting the liver’s ability to properly function. Similar to Non-Alcoholic Fatty Liver Disease (NAFLD) common ailments associated with NASH are cirrhosis of the liver, the presence of hepatic inflammation and if not diagnosed and addressed through medical intervention, could be fatal. About 30-40% of adults in the U.S. live with NAFLD, and 3-12% of adults in the US live with NASH. The high prevalence of NAFLD is attributed to poor diet and the lack of exercise to which a sub-group go on to develop NASH.
United States (YouTube: Biomarkers in NASH Drug Development )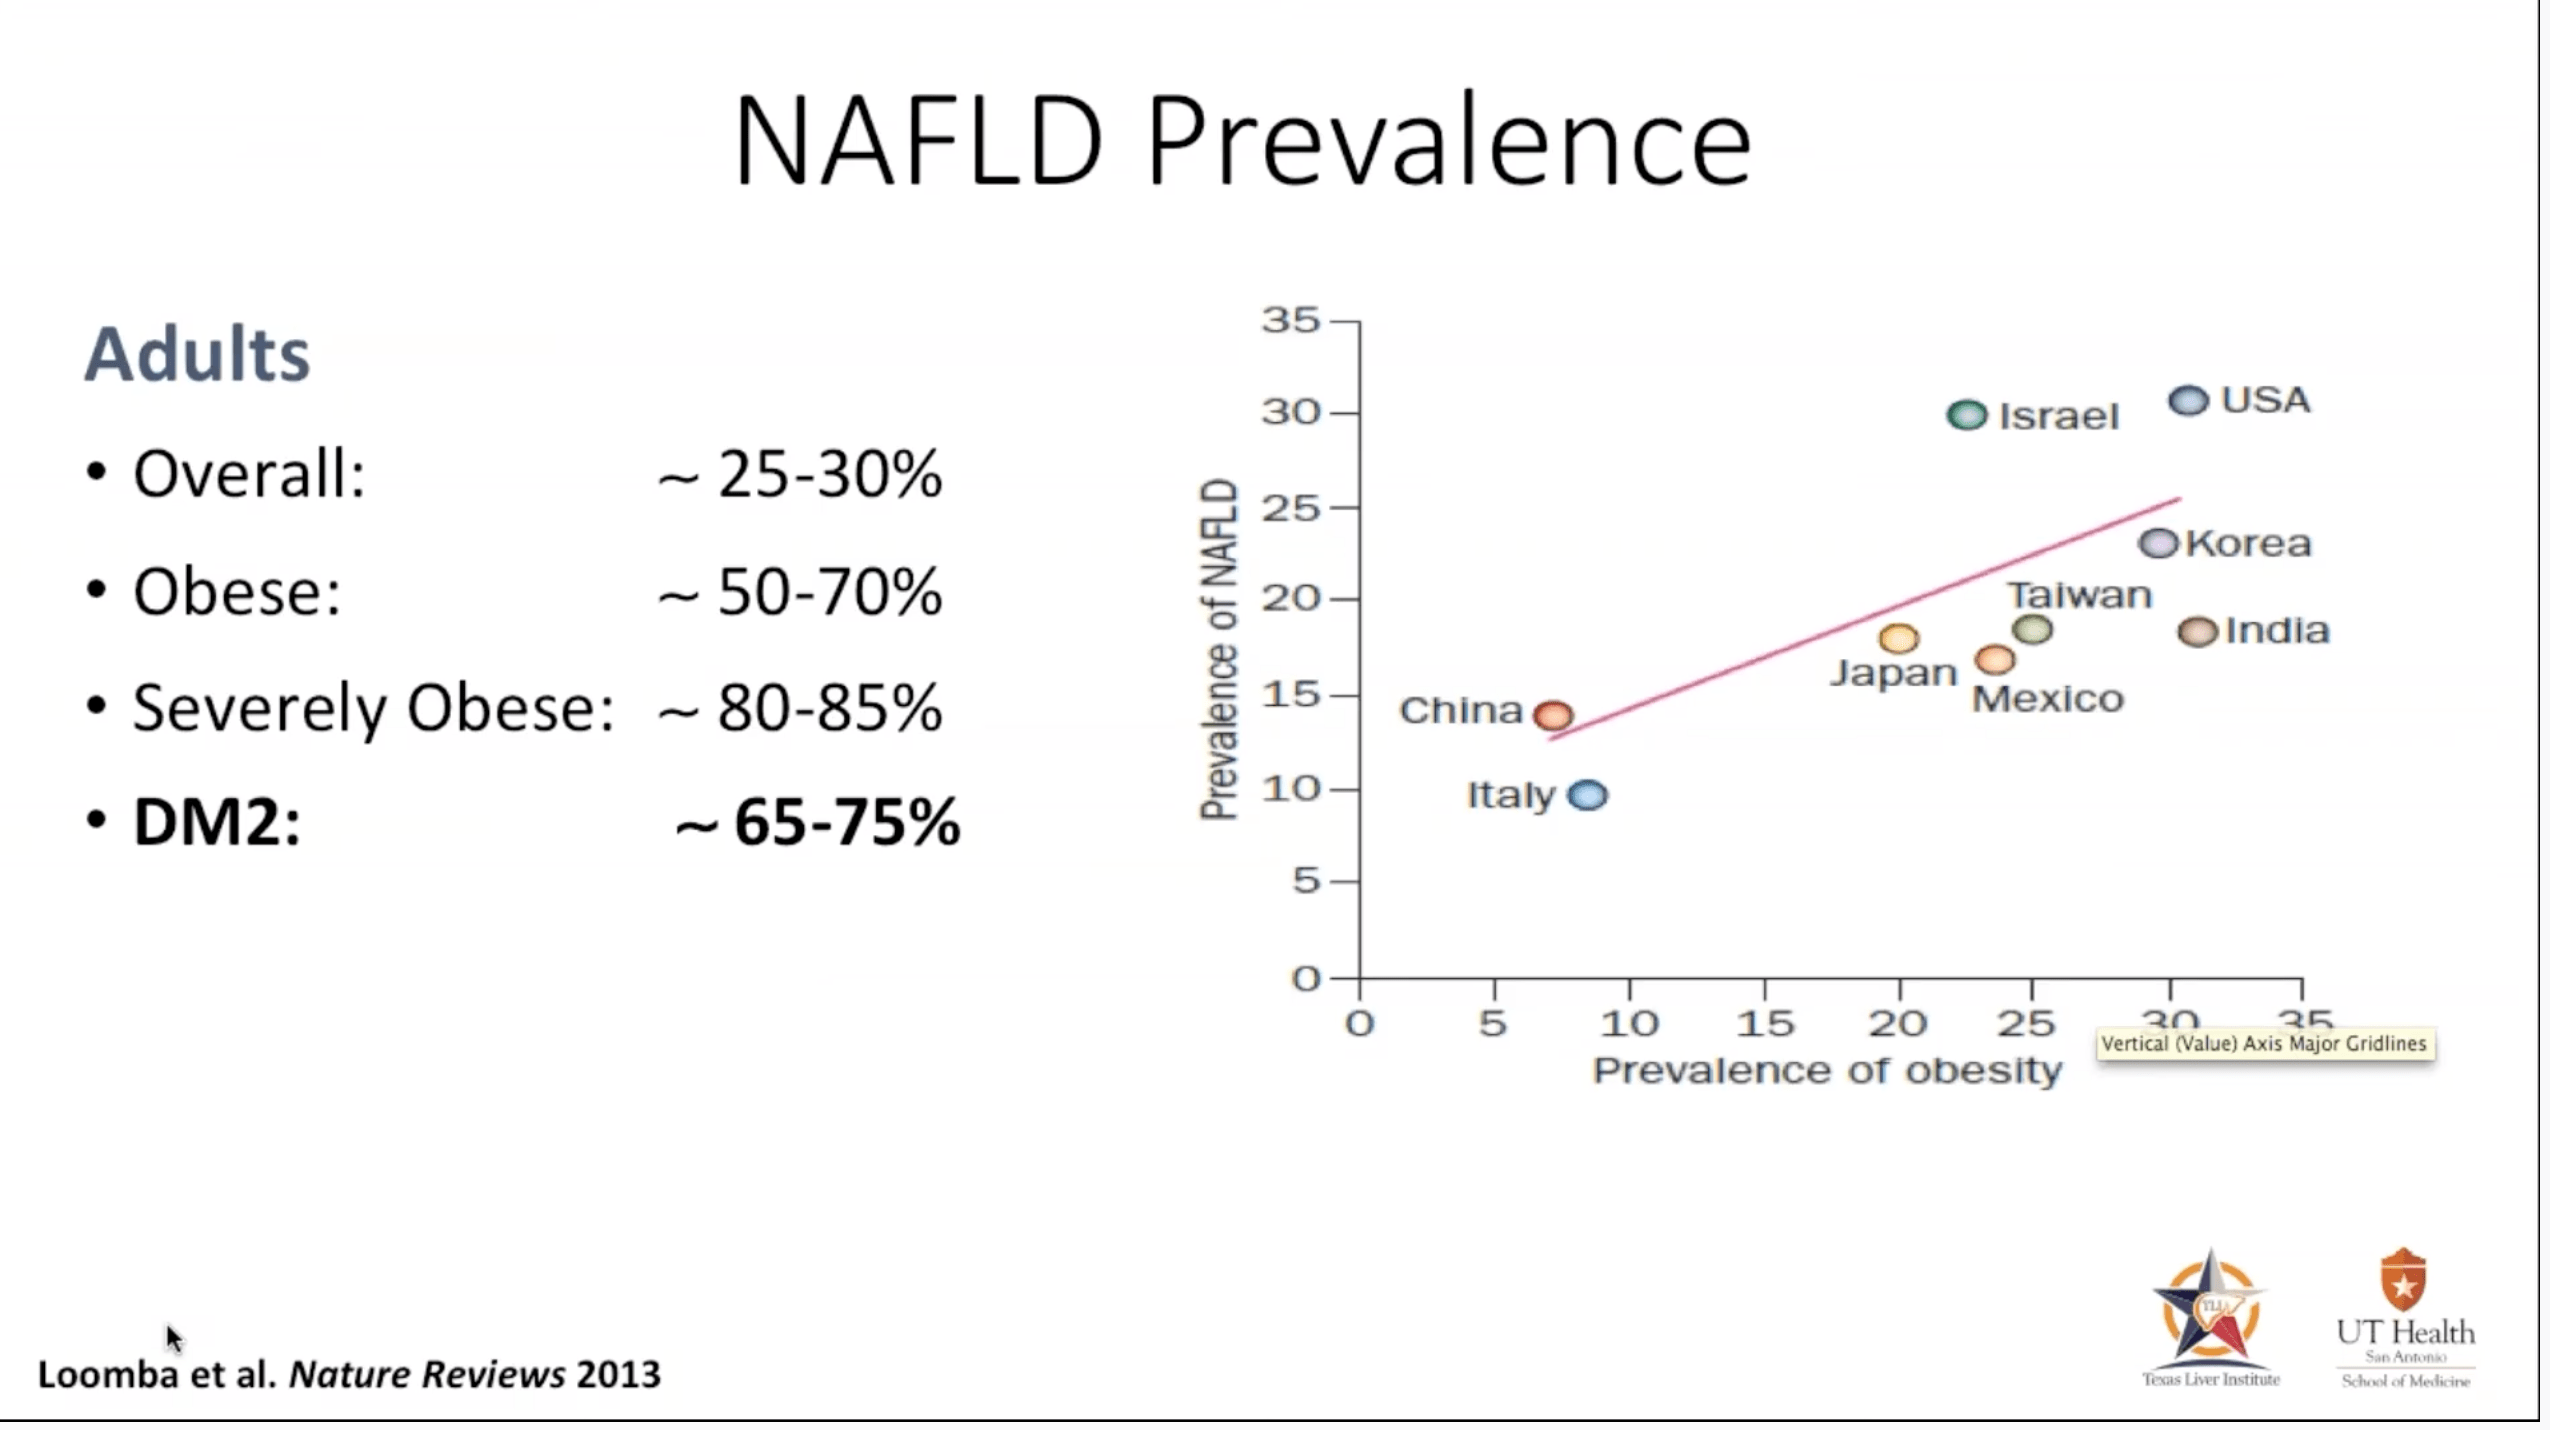
Further compounding the problem is the lack of affordable diagnostic tools as well as some of the procedures which are not currently covered by insurers. Invasive procedures, such as liver biopsies have been a standard practice of clinical trials for liver disease. Besides being invasive, uncomfortable and risky for patients, liver biopsies are also expensive costing an estimated $3,000-$5,000 per patient. The discordance rate among pathologists on the sample taken also leaves room for doubt and that simply leads to more questions rather than answers. Identifying and utilizing biomarkers in the future will help clinicians and product sponsors develop and design quality trials and could lead to increased probability of success with therapies. Great progress is being made in that area and certain markers have been identified.
Diagnostic Procedure: Liver Biopsy (YouTube: Biomarkers in NASH Drug Development)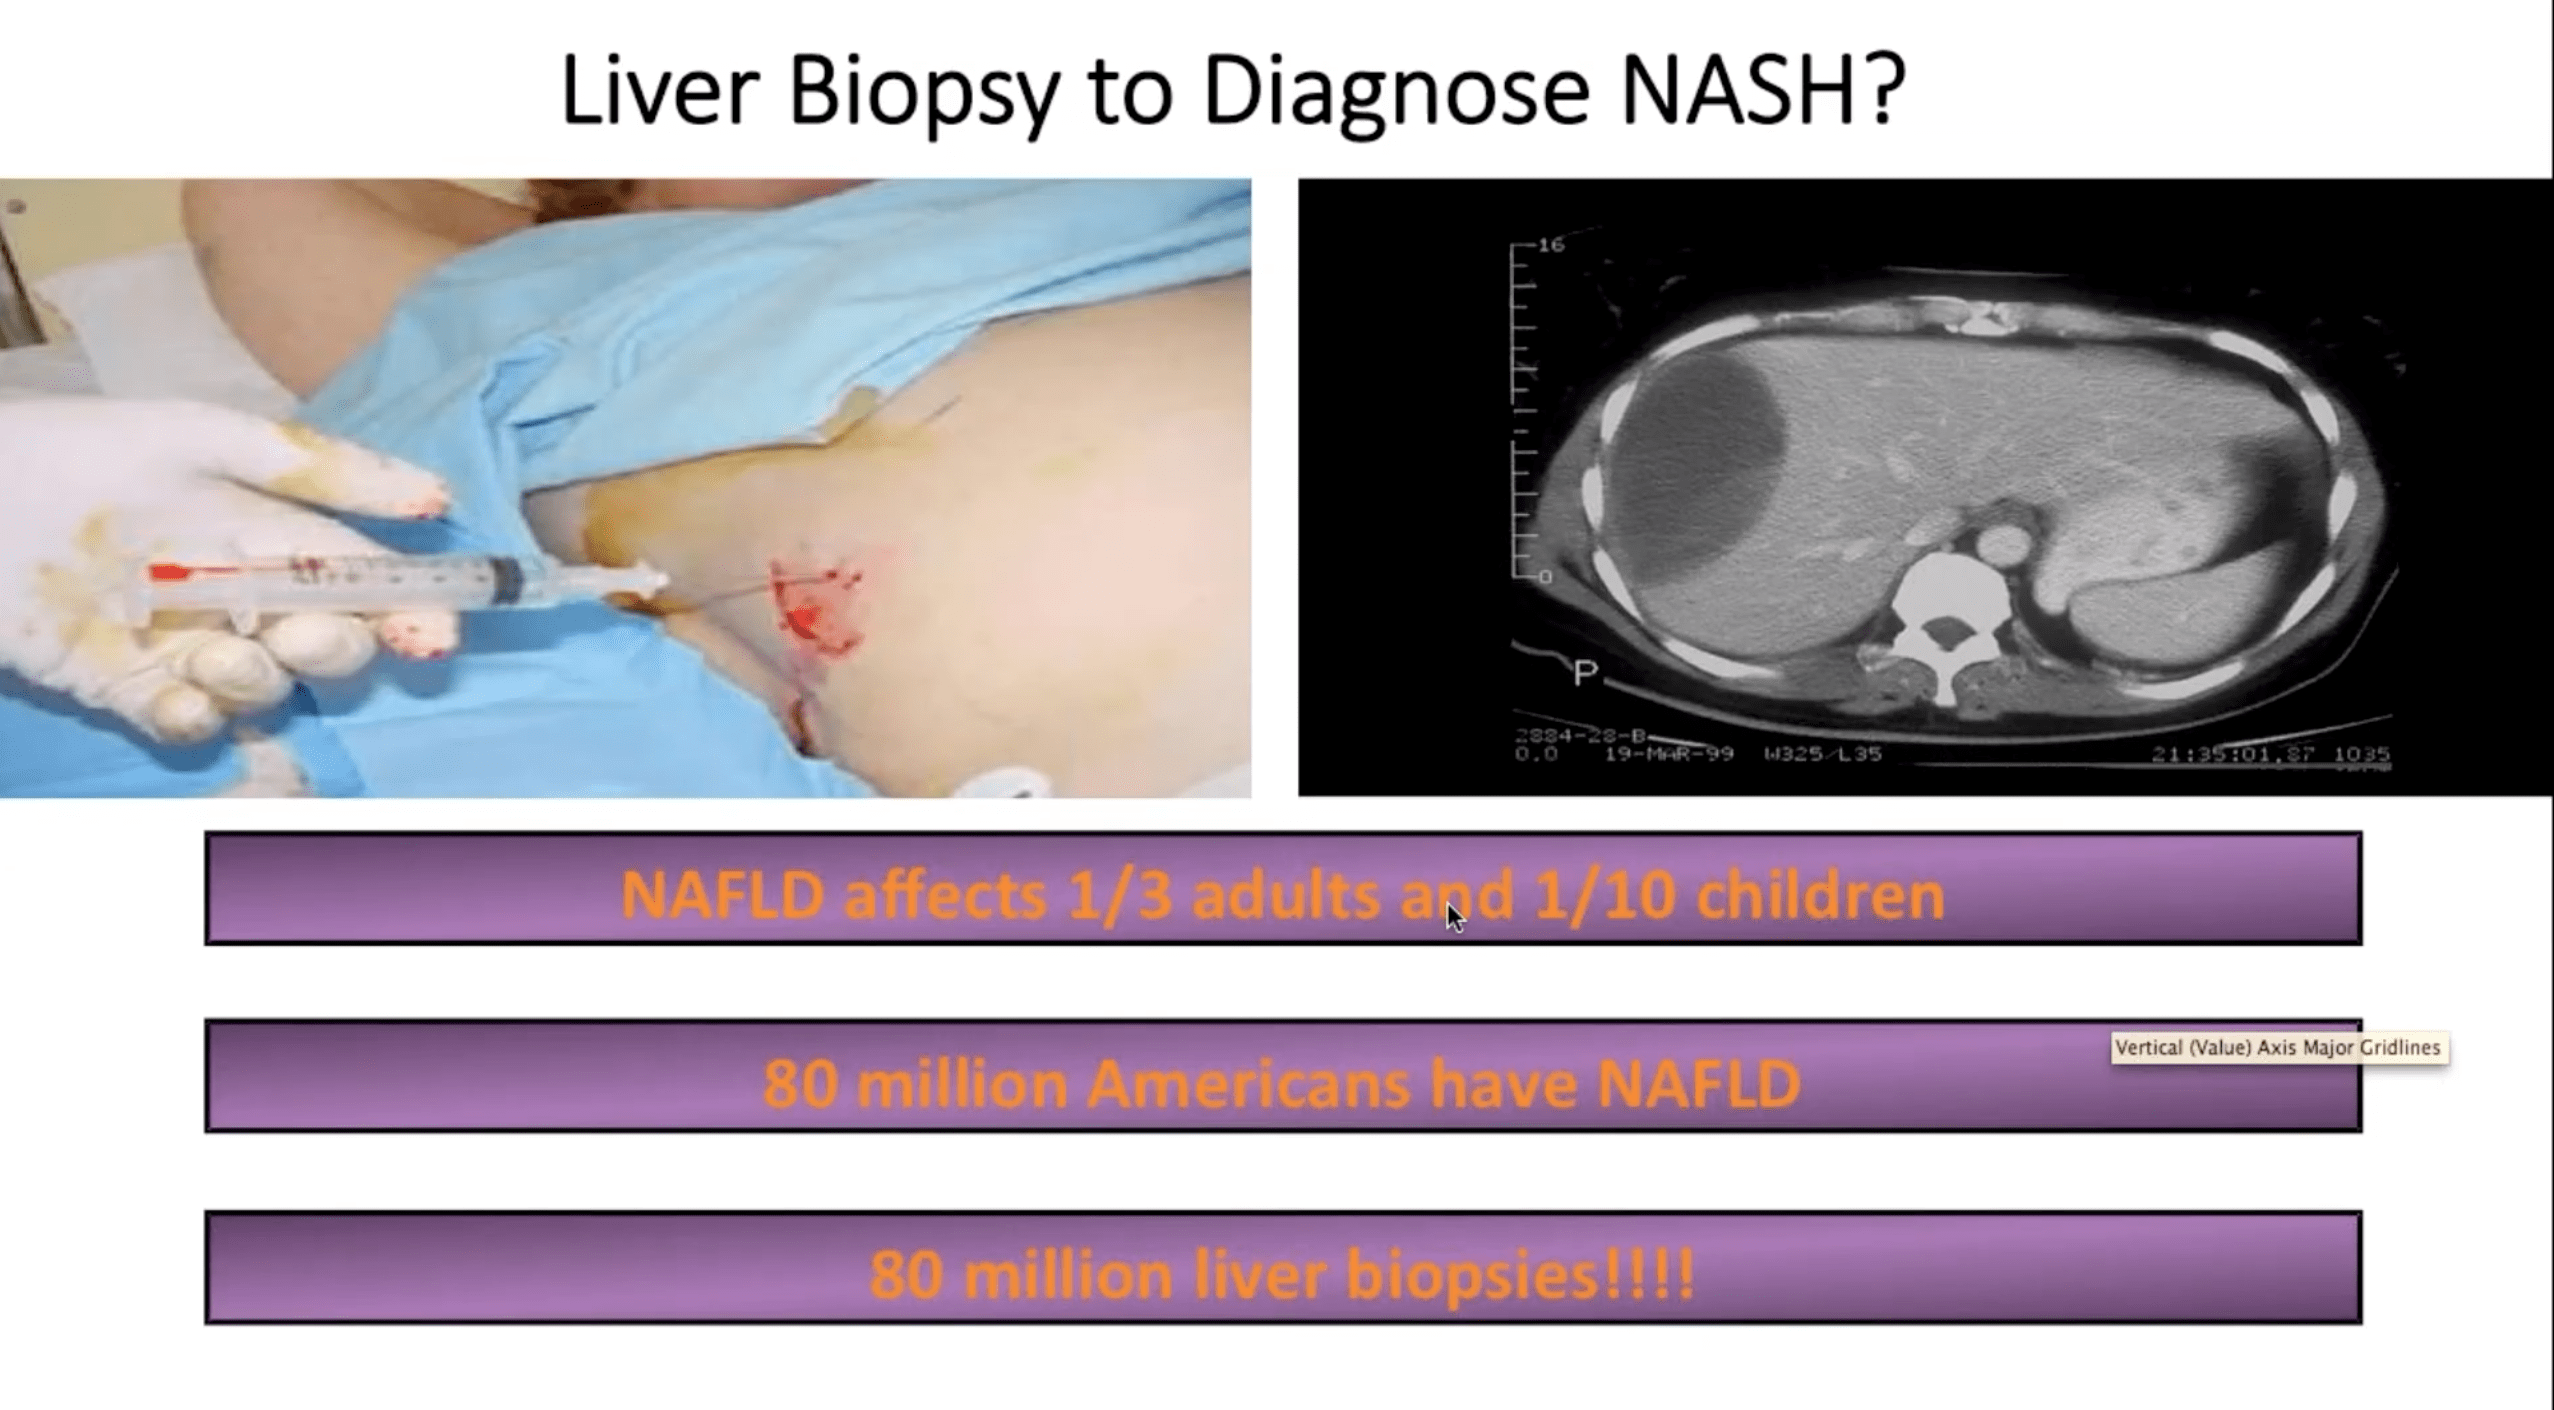
Heart disease, metabolic syndrome, unhealthy cholesterol levels, insulin resistance, hepatitis and type 2 diabetes are major risk factors for NASH and damage to the liver. Obesity and diabetes are becoming more common, especially in the North American segment of the global population as a result of sedentary lifestyles, higher calorie intake linked with processed food consumption, and alcoholism, all of which are anticipated to fuel the rise of the Non Alcoholic Steatohepatitis NASH market.
Metabolic Syndrome, for the readers who are unfamiliar with the condition is a cluster of conditions that when taken together can lead to heart disease, diabetes and more. According to the Mayo Clinic a diagnosis of high blood sugar levels alone may not imply you have metabolic syndrome but, if you add any other signs such as excess belly fat, obesity, hypertension and abnormal cholesterol levels you may be at additional risk for serious diseases, such as heart disease, diabetes and as being discussed, NASH.
Metabolic Syndrome (YouTube: Biomarkers in Nash Drug Development)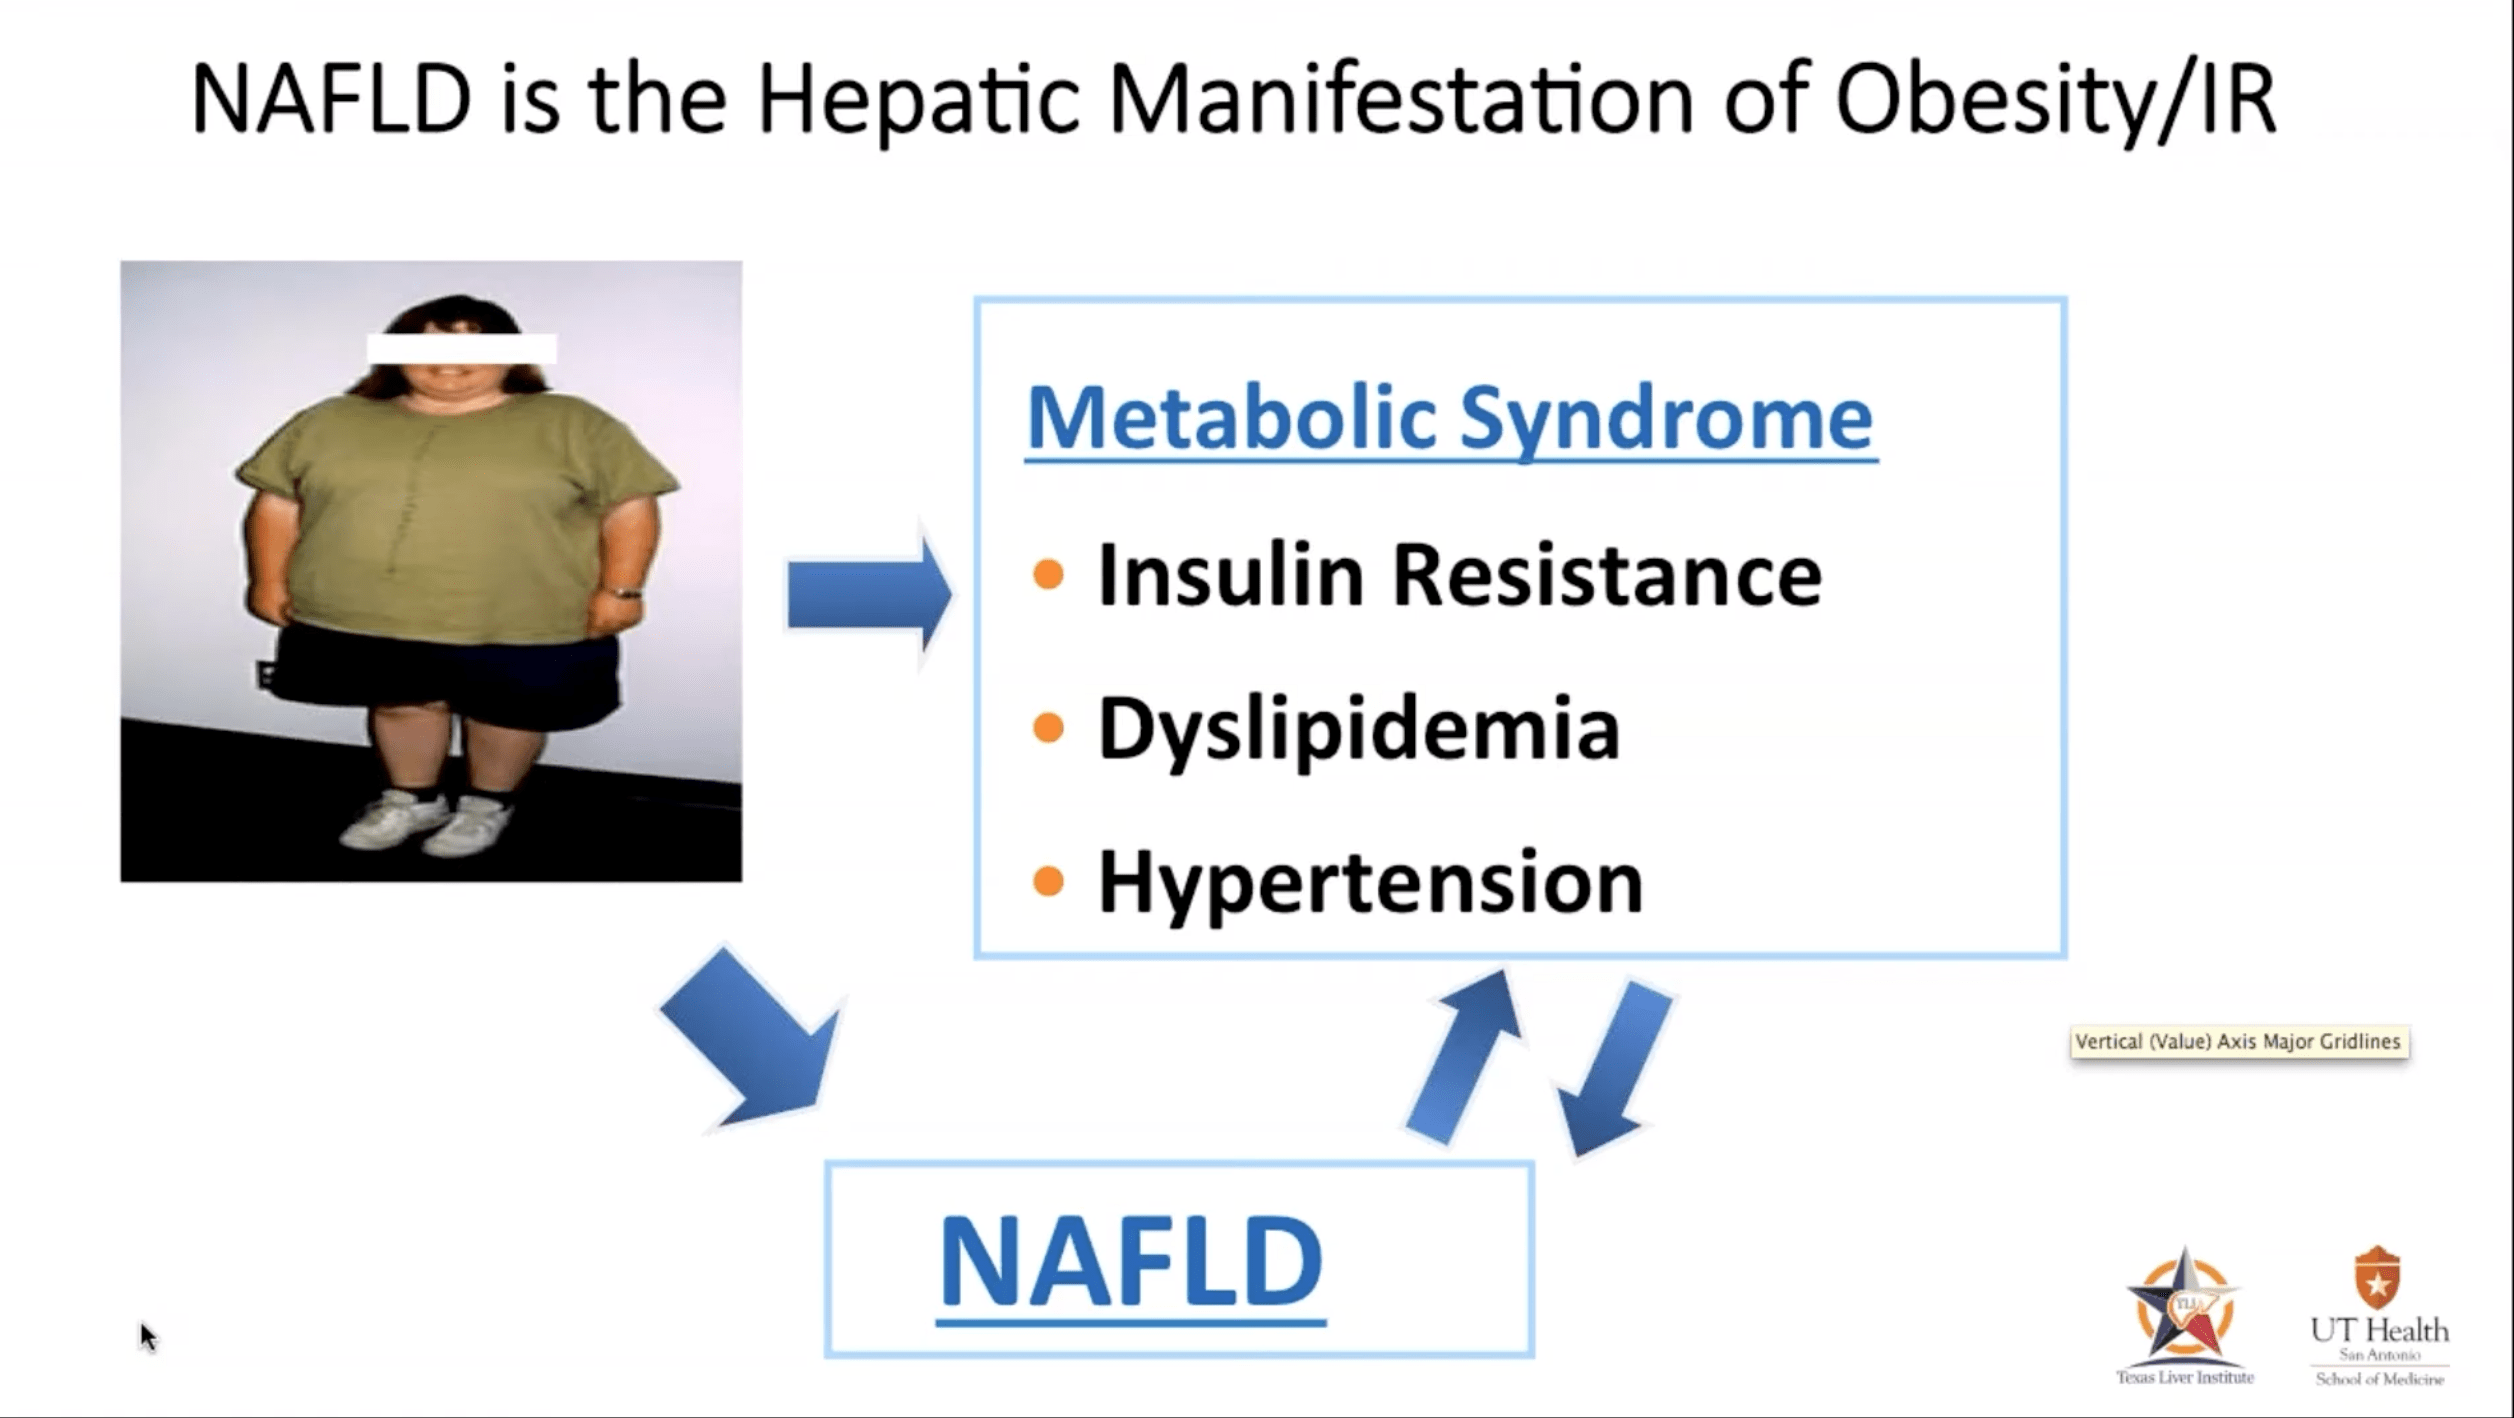
The Mayo Clinic reports, of those who develop NASH, anywhere between 5 -12% of the patients will develop cirrhosis that can result in end stage liver failure. Cirrhosis is the build up of scar tissue, otherwise known as fibrosis, that gradually weakens the liver’s ability to function properly. Patients with NASH frequently develop all the hallmark symptoms found with most liver diseases such as jaundice, fluid accumulation in the abdomen, nausea, loss of appetite, redness of the palms and swelling of the legs.
TAMS
Insight Partners, May 2022 report forecasts the TAMS for NASH to reach $24.26 billion by 2028 from $1.63 billion in 2021; it is expected to register a CAGR of 47.1% from 2021 to 2028.
The global monoclonal antibodies industry was valued at USD 105.2 Billion in 2020 and is expected to reach USD 155.2 Billion in 2028 growing at a CAGR of 6.7%, fueled by the rise in cancer with North America leading the way as the largest segment in the world.
Combined, NASH and the global monoclonal antibodies industry provide quite a bit of excitement for CYDY investors. While NASH is the primary focus of this particular article, the development of leronlimab and the number of indications it can treat with their monoclonal antibody are what give CYDY investors a lot to look forward to in the coming 3-5 years. Readers are highly encouraged to look at their pipeline of indications currently under development, read their updated filings with the SEC, understand the current financial status and investigate for themselves all of the risks before making an investment in CYDY or any other penny stock.
NASH Topline Results
International Liver Congress 2022
In this multi-center Phase 2a, dose ranging, two-part trial, part 1 was designed as a double blind, randomized, placebo-controlled trial. The trial was designed so that patients with >8% proton density fat fraction scores (PDFF) and corrected T1 ((cT1)) of >800 were placed into randomized groups (1:1) as either the placebo group or the group who received a subcutaneous 700 mg dose of leronlimab.
The second part of the trial was an open label 350mg dose vs placebo cohort. Treatment duration was 14 weeks. The primary endpoint was change from baseline in PDFF and secondary endpoints were change from baseline in cT1 fibro-inflammatory activity and change in serum cK18 and K18 by M30-M65 ELISA at week 14.
Results of the trials were first presented at the International Liver Congress 2022 for a small population of participants (N=72)
Mean percent change from baseline PDFF was significantly reduced in the 350 mg group vs placebo (-5.94% vs +9.85%, p = 0.008) but not in the 700 mg group (+3.75% vs +9.85%, p = 0.135).
Mean change of cT1 was significantly reduced in the 350 mg group vs placebo (-24.38 ms vs +27.64 ms, p = 0.021) but not in the 700 mg group (-2.73 ms vs +27.64 ms, p = 0.059).
Significant reductions were seen in the 350 mg subgroup with baseline cT1 equal or greater than 875 ms in both PDFF and cT1 vs placebo (-4.37% vs +9.85%, p = 0.020 and -42.00 ms vs +27.64 ms, p = 0.011) respectively.
In subjects with cT1 equal or greater than 950 ms at baseline, PDFF and cT1 were significantly reduced with 350 mg vs placebo (-9.39% vs +9.85%, p = 0.027 and – 68.85 ms vs +27.64, p = 0.009) respectively.
Mean change in baseline to week 14 for M65 ELISA (cK18 and K18) decreased in the 350 mg group (340.55 to 332.4 U/L; -8.18) while increased in placebo (301.96 to 411.64 U/L; +109.78).
In post hoc analyses, mean percent PDFF and mean cT1 were significantly reduced in the pooled 350 + 700 mg group compared to placebo (-1.09% vs +9.85%, p = 0.014 and -13.30 ms vs +27.64 ms, p = 0.013) and in the 700 mg group with genetic haplotypes known to over produce CCR5 compared to placebo (-27.9% vs +9.85%, p = 0.006 and – 45.4 ms vs +27.64 ms, p = 0.013).
There was no grade 3 or higher drug related treatment emergent adverse event. Injection site reaction and mild diarrhea occurred more frequently with leronlimab than placebo but were not associated with discontinuation.
Conclusions: The primary endpoint (PDFF) and secondary endpoints (cT1) were met for the 350 mg group and moderate to severe fibro-inflammation by cT1 350 mg subgroup at baseline. The pooled 350 + 700 mg group also had significant reductions in PDFF, cT1 vs placebo. Treatment with leronlimab was well tolerated. These results are supportive of further trials with leronlimab for NASH.
Source: Abstract – Efficacy and safety of leronlimab in patients with nonalcoholic steatohepatitis: topline results of NASH01 clinical trial. NAFLD: Therapy, International Liver Congress 2022
What do these results mean?
For the 700mg group its primary endpoints were not stat sig and failed to meet their endpoints.
In the 350mg group, the primary endpoints were stat sig and each met their objectives with measurements from baseline on PDFF recording a value of (p=.008) and mean change of cT1 value of (p=.021).
Two subgroups were also analyzed in the 350 mg dose. A small cohort of participants whose baseline measured 875ms in both PDFF and cT1 and the second group of participants who measured 950ms in both PDFF and cT1.
Group 1, 875 ms: Significant reductions were measured in the 350mg subgroup with baseline cT1 measuring equal or greater than 875 ms in both PDFF and cT1 vs placebo (-4.37% vs +9.85%, p = 0.020 and -42.00 ms vs +27.64 ms, p = 0.011) respectively.
Group 2, 950 ms: Significant reductions were observed in subjects with baseline cT1 measuring equal or greater than 950 ms in both PDFF and cT1 vs placebo (-9.39% vs +9.85%, p = 0.027 and – 68.85 ms vs +27.64, p = 0.009) respectively. Leronlimab was effective at reducing the fat (PDFF) and corrected T1 (cT1) as measured from baseline scores versus the placebo groups in the moderate to severe fibro-inflammation 350mg cohorts as well as the pooled 350 + 700mg groups.
Leronlimab Method of Action with NASH
Just how does leronlimab work in patients with NASH?
First a few details on the liver. Hepatocytes are the major parenchymal cells in the liver and they play pivotal roles in metabolism, detoxification, and protein synthesis. Hepatocytes also activate innate immunity against invading microorganisms by secreting innate immunity proteins.
In NASH, the hepatocytes start to malfunction after an excess accumulation of fat develops in the cells which is usually accompanied by excess lipid droplets. Eventually the cells will begin to malfunction and what was a relatively benign situation progresses towards the development of non-alcoholic fatty liver (NAFL).
As the progression of the fat deposits continue the hepatocyte cells begin to balloon and its cells start to malfunction ((early NASH)). If caught early enough through self-intervention, such as exercise and nutritional adjustments the hepatocytes can be rescued. If not, they will eventually be replaced with scar tissue and as more scar tissue is added, apoptosis is completed and fibrosis settles in…game over.
Hepatocytes (Biomarkers in NASH Drug Development)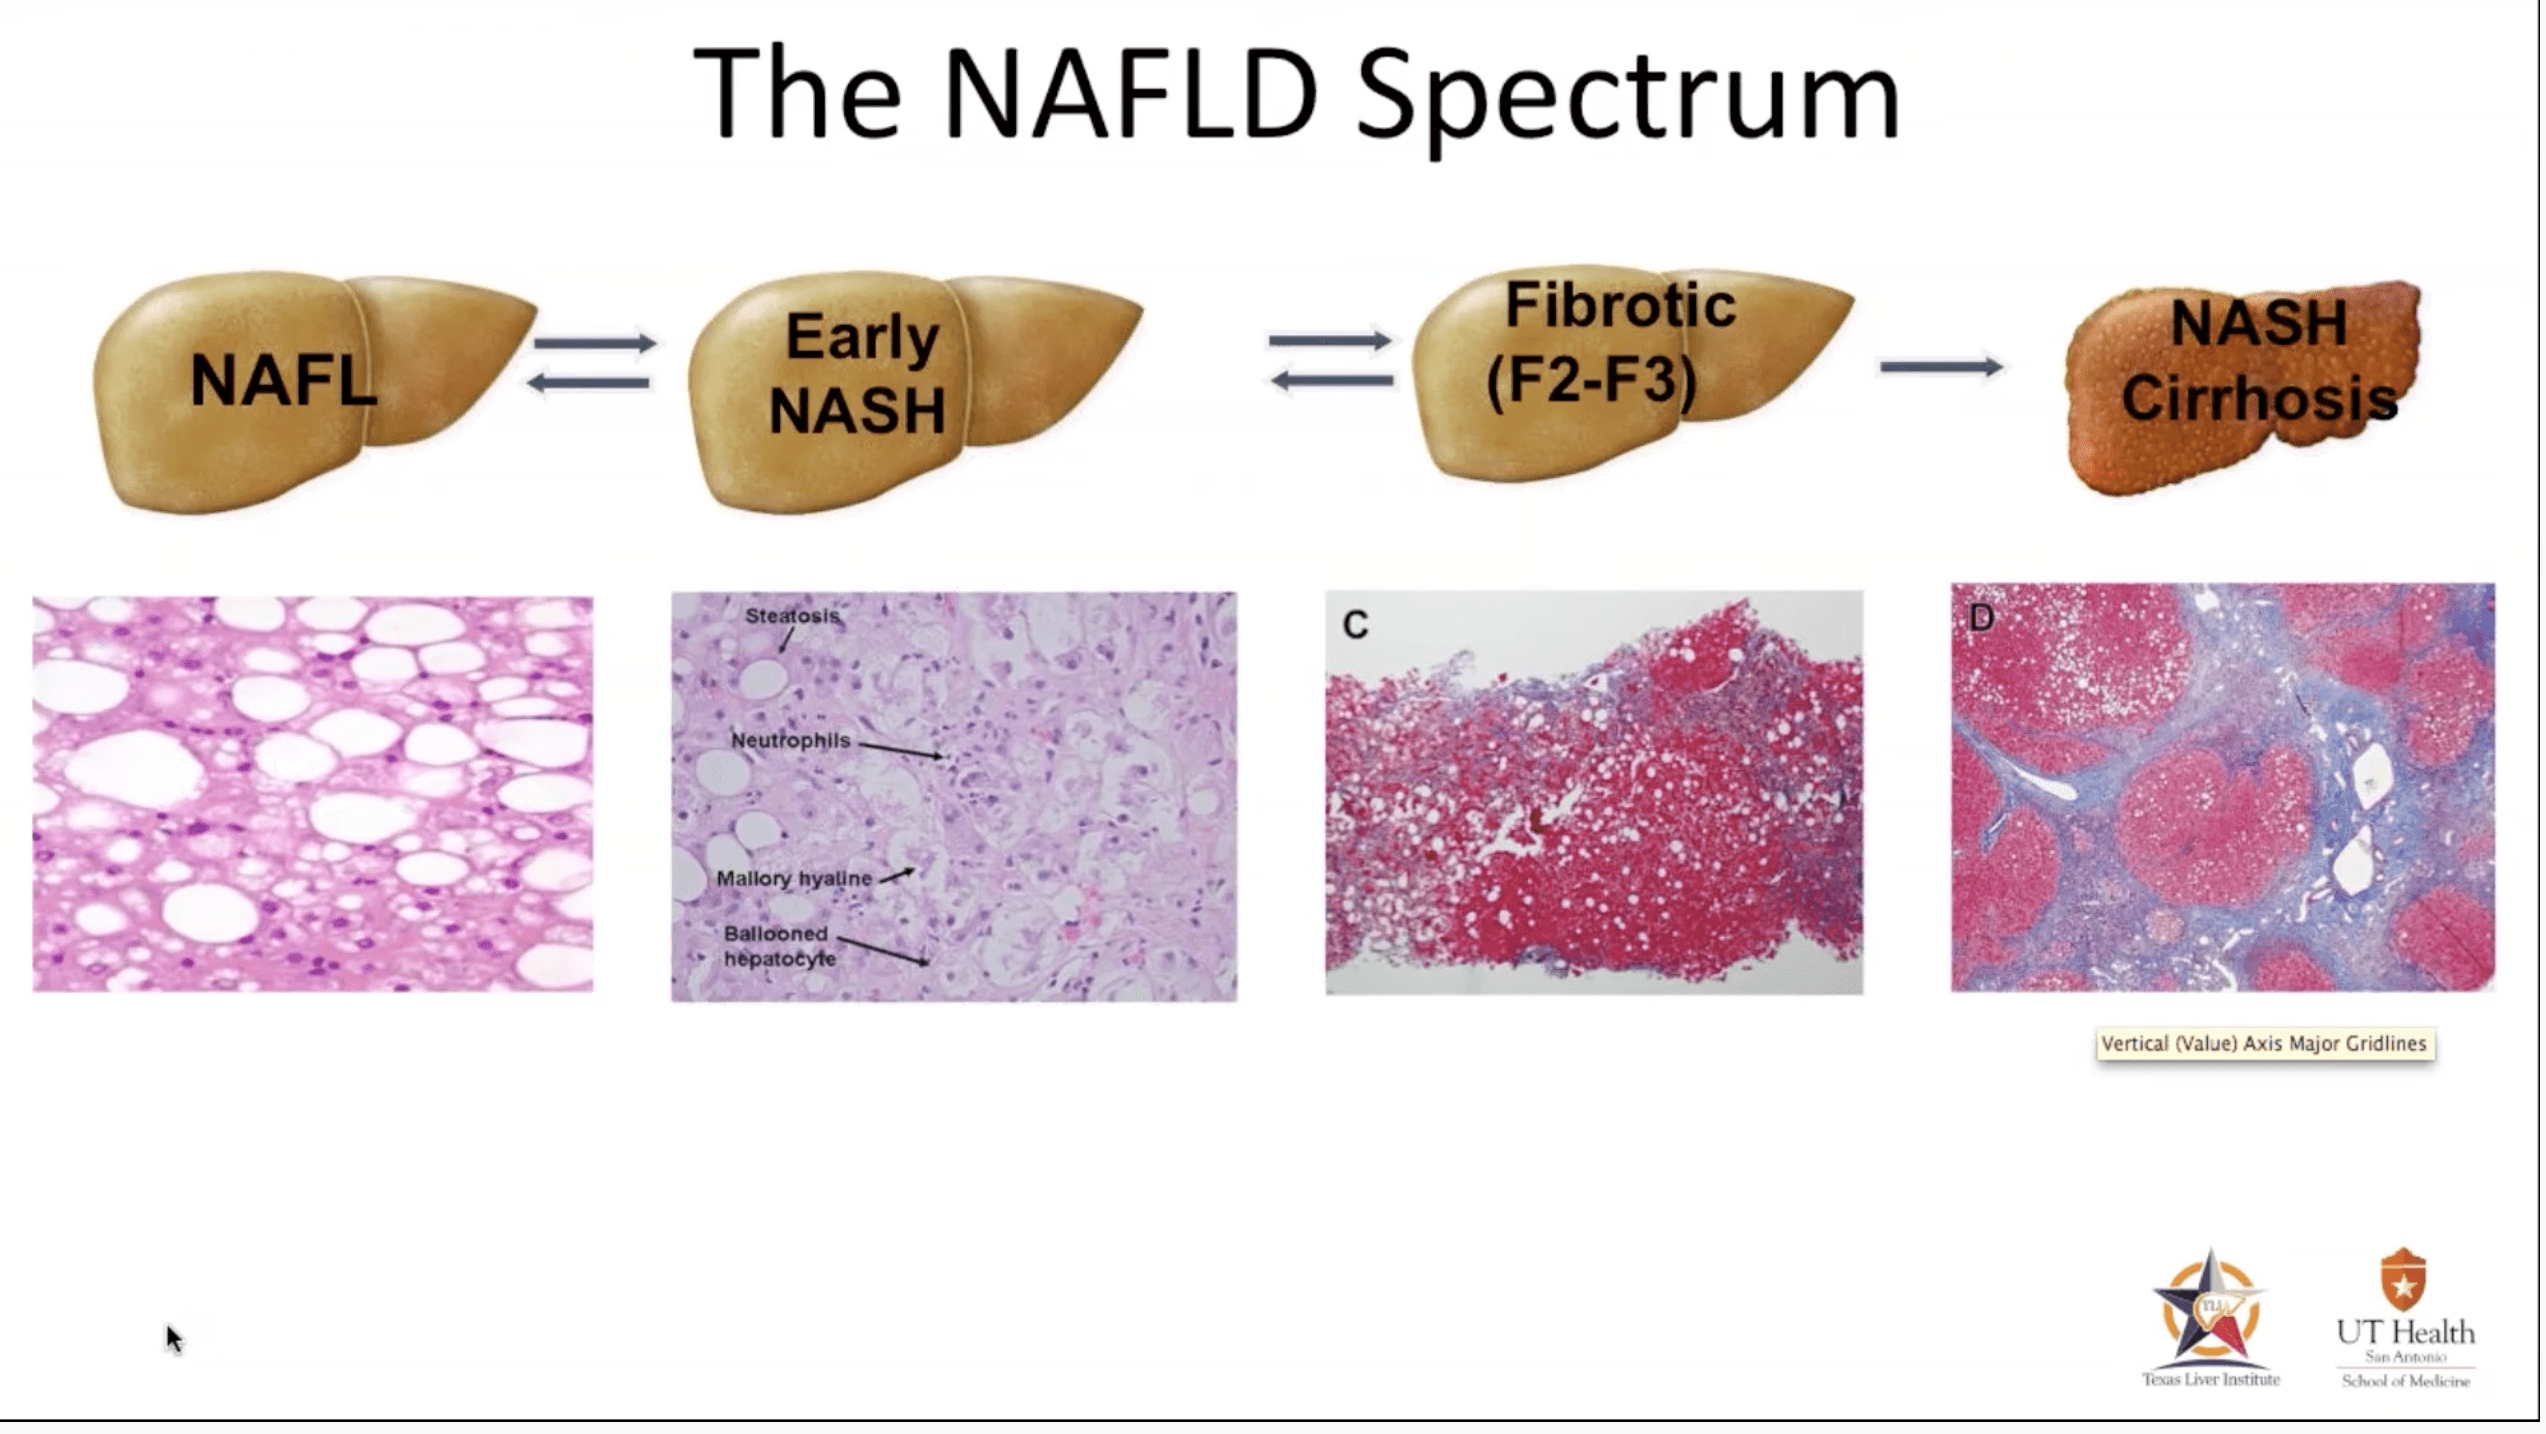
Leronlimab is effective in the 350mg dose because unlike the cancer and tumor micro-environment, there isn’t the excessive over-expression of CCR5 in NASH. Therefore, the 350mg dose is all that is needed as confirmed in the PH2a trial with the reductions of PDFF and cT1 in the 350mg group vs. an exact opposite in the placebo group who’s PDFF and cT1 baseline measurements increased during the study.
Multiples on Pre-Revenue Biotechs
Wall Street Models
So, how does Wall Street place a multiple on a biotech company that has no revenue? Maxx Chatsko, in a podcast for 7investing, best described the process and I urge readers to open the link to the podcast transcript and read, “How Do You Value Biotech Stocks?” for a much deeper dive. In essence, Chatsko described the method employed analyzes three key metrics: 1. the potential of the drug; 2. its probability of success; and 3. the biotech’s net present value. By combining all three metrics, we should be able to quantify the value based on the likelihood of a drug actually reaching the market.
“What is the likelihood of a drug reaching the market?” Well, that depends on several key areas specific to the company. First, each stage of the process is given a probability based on the indication, such as oncology or infectious diseases. Next, the therapies being applied such as, vaccines, CCR-5 or gene editing and, finally the depth and developmental progress of drugs in the pipeline. As each of these mature, the net present value is de-risked and probability of success increases.
The pipeline of the company is probably one of the biggest sources of consideration when projecting a value on a revenue generating biotech. In the case of CYDY, they have one drug addressing multiple needs. What differentiates this drug from others is its unique safety profile to date. With thousands of patients dosed with Leronlimab, few, if any have reported serious adverse events stemming from its use.
CYDY Pipeline (08/23/22) (CytoDyn)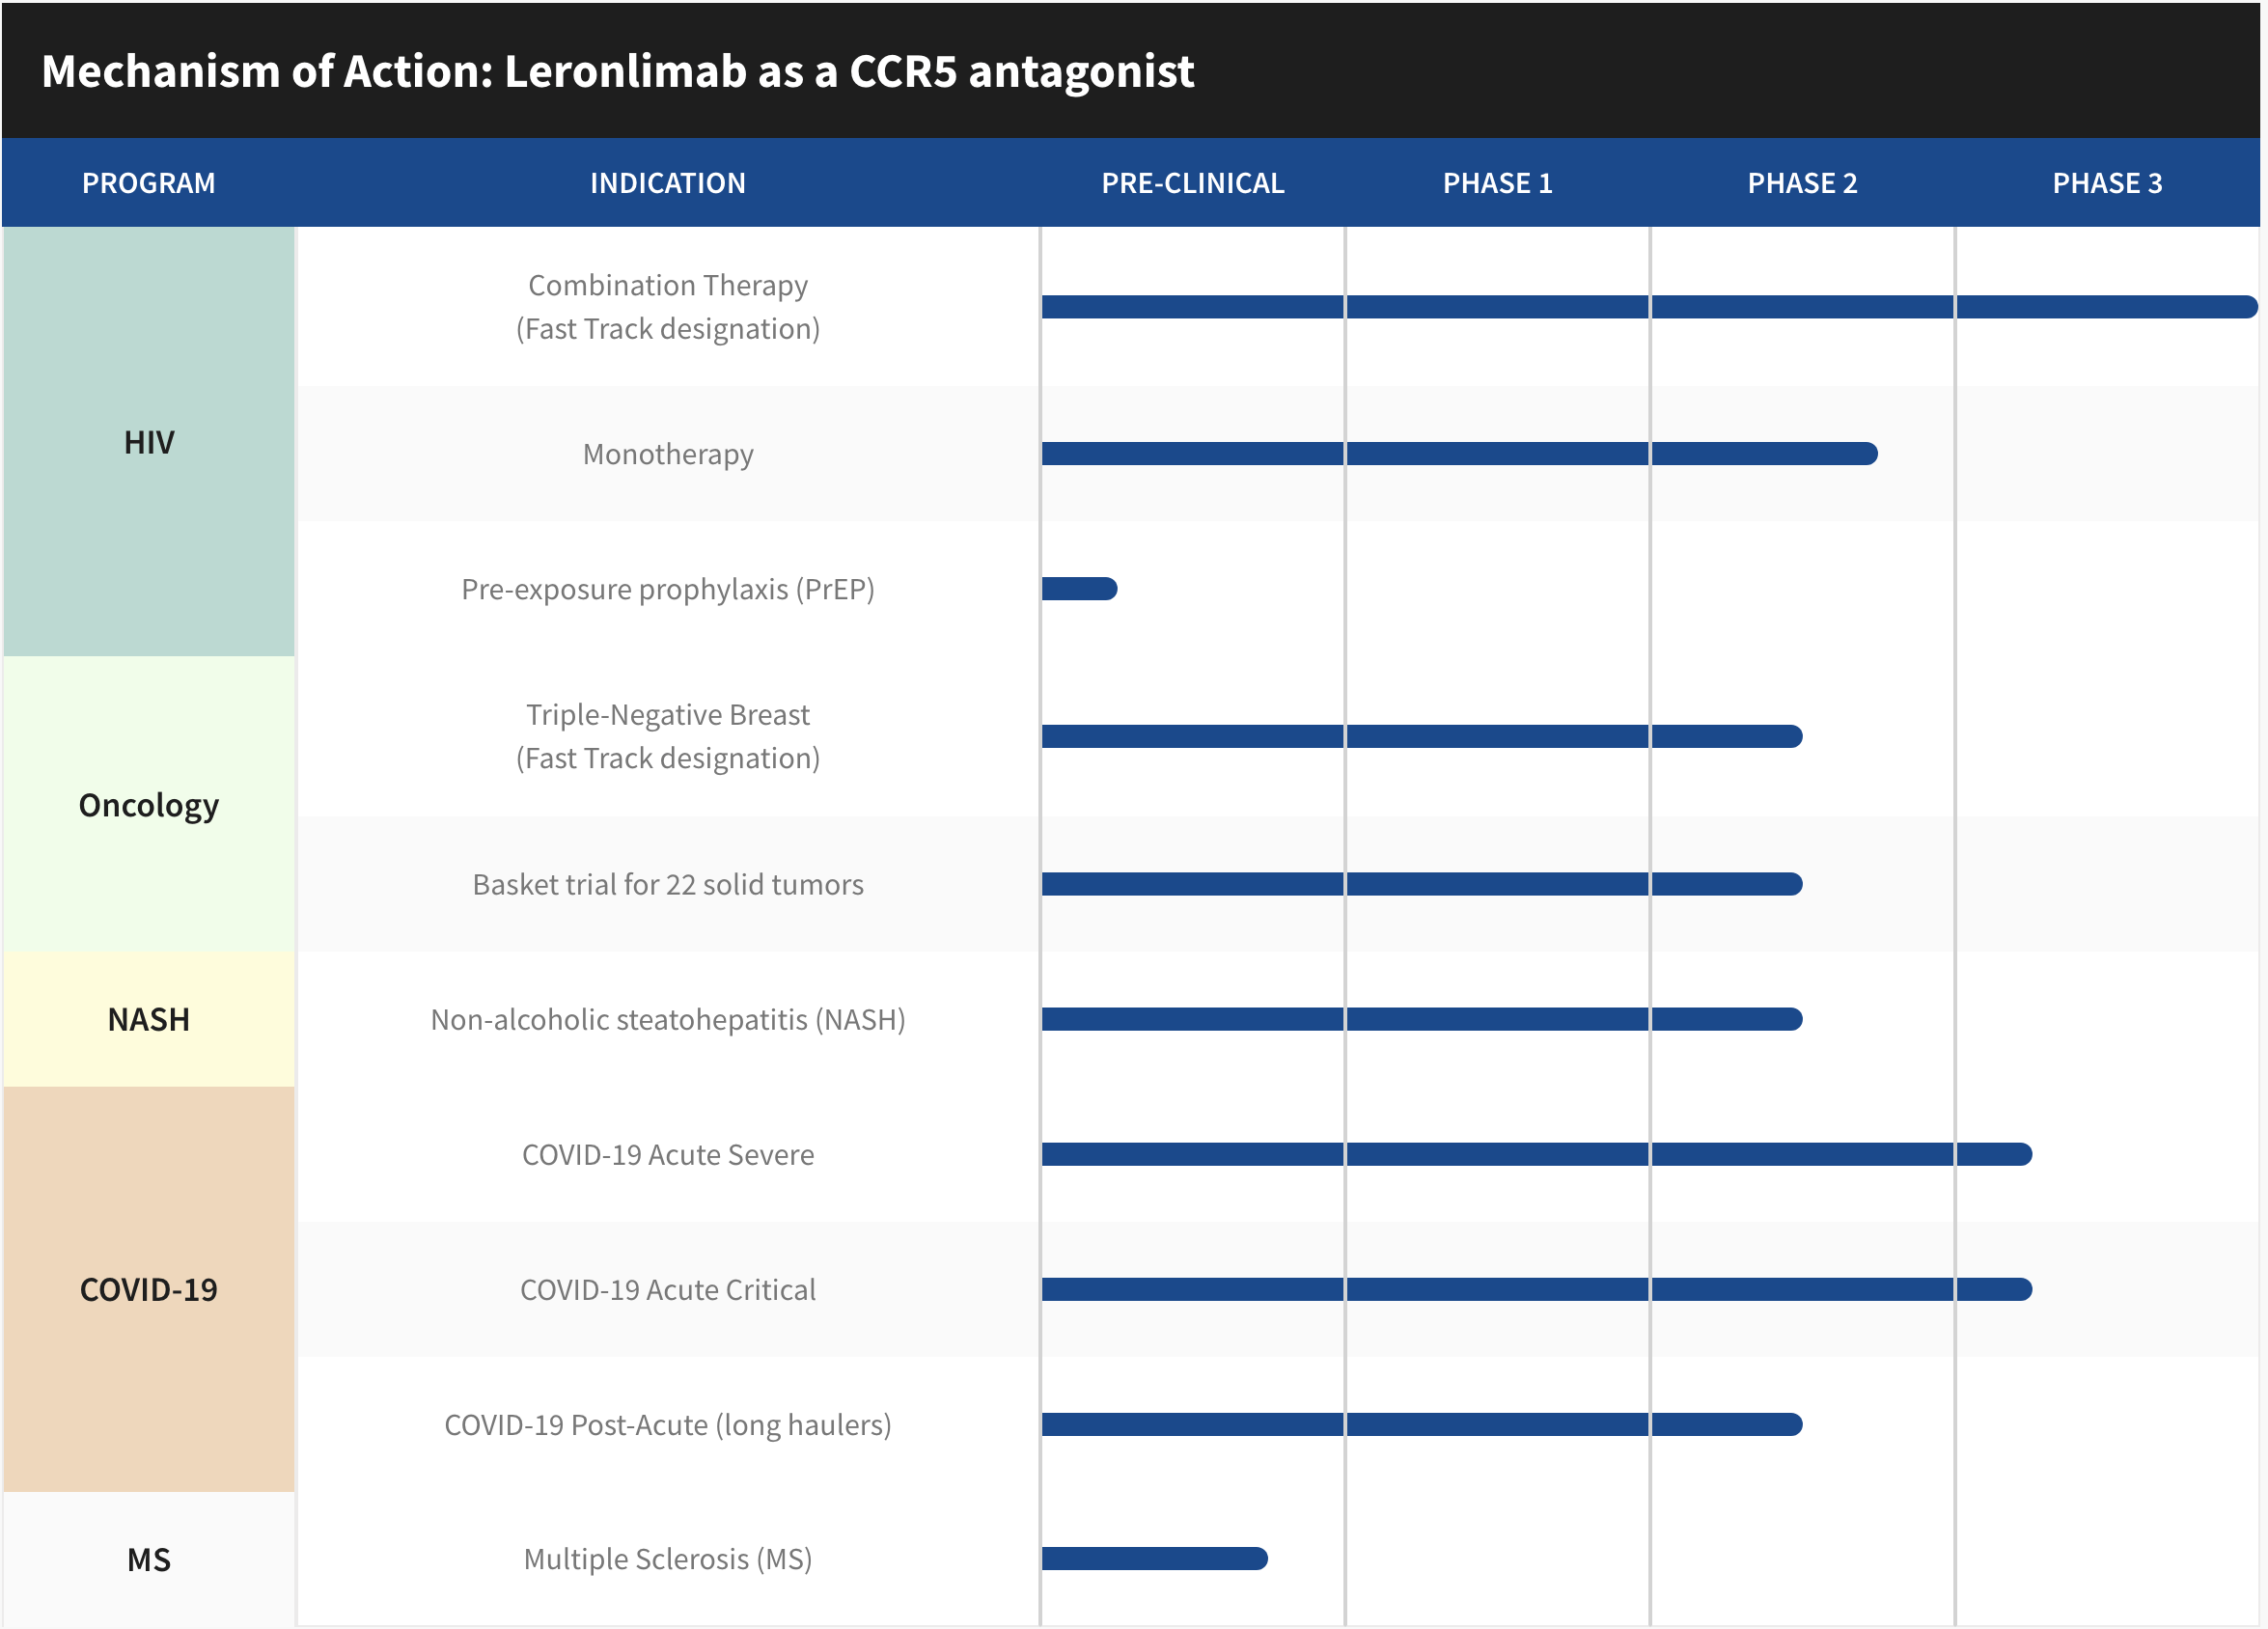
Models can estimate the probability of success (POS) that a drug candidate, for instance in a phase 1 clinical trial will reach the market. A one in four chance or 25%, for instance is a high multiple because most Ph 1 trials are simple, have very low cohorts and may only be looking at tolerability. Whereas pre-clinical animal models using mice and rhesus monkeys, for example, have nearly 0% value attached to them because of their unreliability.
I once listened to an investor presentation when by Dr. David Weiner, UPENN/WISTAR Institute and the father of DNA vaccines had this to say about preclinical animal trials, “Mice lie and monkeys exaggerate.” This very well explains the lack of enthusiasm around animal trial results from Wall Street. Any share price increase driven on that news is artificial and the sellers are salivating on the other side ready for the price to drop and cash in.
Regardless, if the trial is a failure or a success the percentage can then be applied to future expected cash flows and adjusted for the time/value of money to determine what the asset might be worth right now as they progress through more difficult trials and high probability of failure. In essence, these metrics provide a rough framework to identify and apply a value to drug assets.
The explanation of how Wall Street models the value of non-revenue generating biotech’s, is complex. It’s fair to say that if enough negative information or lack of clarity exists surrounding these metrics, investors may feel a stock is unfairly valued and under appreciated by Wall Street.
Revenue Forecast and Biotech Multiples
Assumptions
- Years one, two and three after approvals, early addressable entry points after full approval and commercialization.
- TAMS data taken from sources provided above.
- Conservative 10% addressable market which can grow more.
- Current 10K data – August 2022.
As I posted in a sub-reddit group weeks ago, two very fair and reasonable assumptions are being made in this forecast.
1. CYDY potentially capturing up to 10% of the TAM for NASH, and
2. To acquire the 10% it will take at least three years after FDA approval.
Based on these reasonable and conservative estimates for a new drug, this would equal $2.42B in foreseeable potential “gross” revenue by 2028. Going forward through the next half decade, CYDY will need more time for additional NASH research and trials, cement potential partnerships, complete applications and submission processes, achieve potential milestone payments and more. Manufacturing deals, fill/finish agreements, distribution networks, commercialization (marketing, labels and packaging), insurance coverage, all come into play and almost all require FDA approval. The question is, how long are investors willing to wait for that price and can CYDY do it alone?
Using CYDY 2022 Form 10K, reported operating expenses for the prior year were $104M. An approved product and a larger work force, plus growing G&A expenses, etc. one could conservatively estimate adjusted annual operating expenses to reach $250M over the next several years, presuming no hiccups along the way. The EBITDA adjusted net revenue could be in the ballpark of $2.17B earnings/1.35 billion shares (pending approval of another 350M shares on August 31, 2022) offers an equal weighted price per share of $1.61.
Biotech P/E multiples average near 20x which would put a price on CYDY near $32.14 per share for the NASH indication alone. To score the low and high end for investors, as multiples change with the wind…a 10x multiple will put the share price at $16.10 and a 30x multiple places it at a high end of $48.30 per share.
Risks
Headwinds from Competition
According to a report issued by Grandview Research there is keen interest in developing a therapeutic drug for this condition as there are currently no FDA approved treatments for NASH, which is a leading cause of liver transplants.
In March 2021, Gilead Sciences, Inc. and Novo Nordisk announced that their trial partnership in non-alcoholic steatohepatitis has been expanded. In people with compensated cirrhosis due to NASH, the companies would perform a Phase 2b double-blind, placebo-controlled study to assess the safety and efficacy of Novo Nordisk’s semaglutide, a GLP-1 receptor agonist.
In November 2021, GlaxoSmithKline announced it is making its first massive effort into treating the fatty liver disease known as nonalcoholic steatohepatitis with a USD 1 billion asset deal with Arrowhead Pharmaceuticals. In October 2019, Novartis added another non-alcoholic steatohepatitis therapeutic candidate to its pipeline with a USD 80 million license agreement with Pliant Therapeutics.
A check of the Clinical Trials website revealed over 74 active studies for NASH in the United States. These include the affects of other drugs on NASH, direct intervention such as bariatric surgery, physical fitness, monoclonal antibodies, GLP-1 receptors and more. In addition to the pharmaceutical trials registered on Clinicaltrials.org dozens and dozens of academic institutions have thrown their hat in the ring in the fight to develop a treatment for NASH.
To compete with these pharmaceutical behemoths and others in the space it might be in the best interest of CYDY to find a partner for any of their drug candidates. A partner could go along way in earning milestone payments, offset trial costs, establish royalties and improve the balance sheet. The current agreement with Samsung Biologics to manufacture LL will save time which is essential when going head to head with billion dollar global drug companies.
Stock Dilution
While efforts to maintain a sizable balance sheet for operations are a major challenge for small cap non-revenue generating biotechnology companies, the responsibility falls on the CEO’s to network and generate interest by doing short presentations at investor conferences, meeting with financiers, structure loans, offer private placements, negotiate partnerships and authorize the timely selling of shares. This is necessary as interest brings investment and cash is what keeps the doors open until revenue is generated. While it is necessary, some of those activities require shareholder approval. On August 31, 2022, that is exactly what CYDY is going to do. Cytodyn is asking shareholders to authorize and approve an additional 350,000,000 shares to be added to their current authorized share amount of 1B shares.
According to the proxy filed with the SEC, here is how the funds are expected to be used:
The primary reasons for the increase in authorized shares of common stock are to have sufficient shares available: (I) to satisfy the Company’s existing obligations to issue shares of common stock upon the conversion of outstanding convertible notes and the exercise of certain outstanding warrants; (II) for future financings to provide needed capital to fund the Company’s operations, including potential negotiations with third parties to satisfy the Company’s existing payment obligations in shares of common stock rather than cash; (III) for possible acquisition or other strategic transactions or partnerships; (IV) for future equity awards as compensation to employees, officers, directors, consultants, and other advisors, including equity incentives for performance; and (V) for other general corporate purposes, as further described in this proxy statement under Proposal 1.
Approval would give CytoDyn 1.35B authorized shares. Currently, 810M are outstanding. The risk of dilution is all but unavoidable in order to keep the doors open and I don’t have a problem with voting to approve the addition of more. However, shareholders should not stick their head in the sand and not be concerned of the potential for reverse stock split.
There are several reasons why a company may decide to execute a reverse stock split and reduce its number of outstanding shares in the market. To prevent being delisted, boost the company’s image and to draw more attention from analysts and Wall Street investment firms who have minimum share price limits structured into their by-laws which prevent them from owning stocks under certain limits, such as $5.00. Once a reverse split occurs and the share price can stay above these limits, many biotech exchange-traded funds (“ETFs”) are interested in owning them as part of a broad ETF biotech portfolio. Of course, the downside is the appearance that a company is using some accounting magic to hide their financial problems.
Technical Analysis
Latest Trend
As a student of “trend trading” I don’t trade biotech stocks due to their extreme volatility. Rather, I buy into a story based on the science and hold shares for years while the story unfolds. This is true for my biotech and medical device holdings in (INO), (MNKD), (AQST), (KPTI), (MYOV), (SENS), (MDVL) and (OTCQB:CYDY). I’m long in each of these based on their stories, their potential and probability of success.
My trend trading strategy is to look back at the last 160-180 candles and determine the trend with the 50D, 100D and 200D moving averages in place. If the share price can stay above these averages, making higher highs and higher lows along the way I buy during the upward trend and ride the trend up. I adjust my stop losses as we climb, 2x below the average true range indicator. If the pattern breaks or the technicals signal an impending decline such as a bearish candle formation, I sell or my stop loss get’s triggered when I’m unable to follow the market. As you can see, trend trading does not work well with small cap biotech stocks, for me, due to the extremes in volatility. Let’s look at the chart of CYDY.
Several points to make regarding this analysis. First and foremost is I use charts to identify entry and exit strategies for stocks. I follow the technicals to keep myself informed of potential opportunities and I recommend you learn these tools as part of your investing strategy.
CytoDyn Daily Chart (TradingView)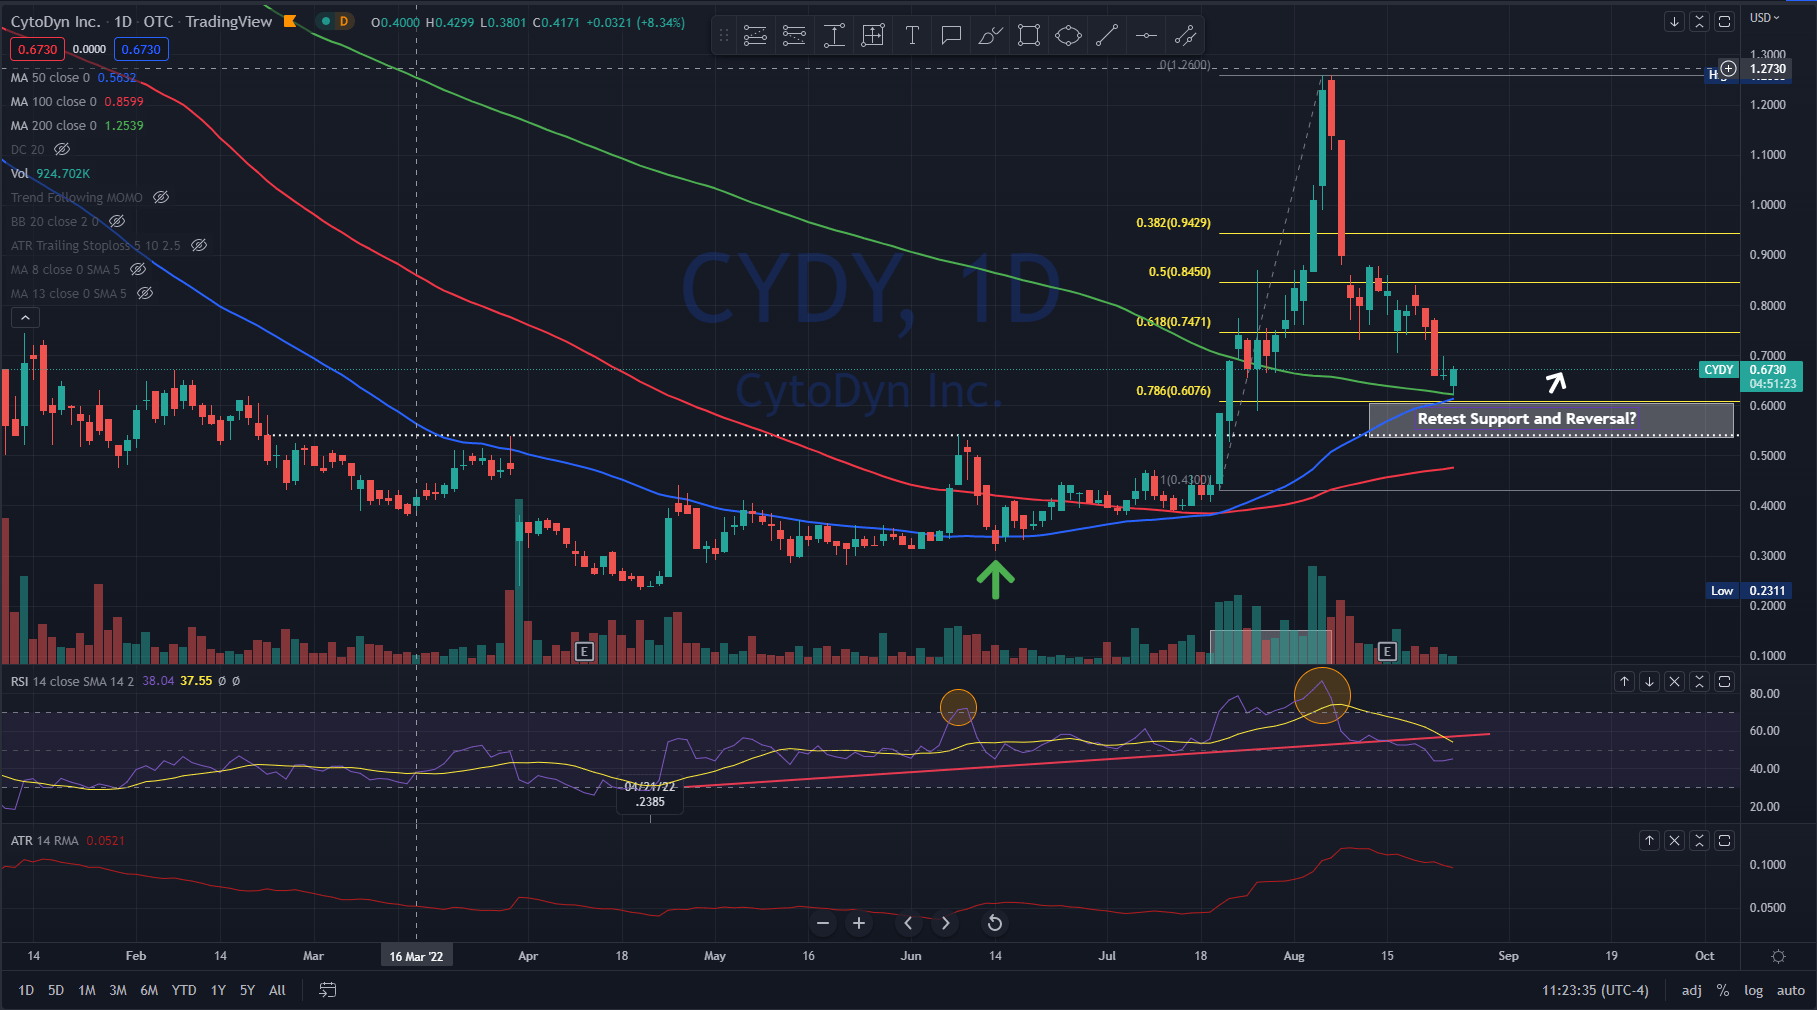
Takeaways
The first thing I notice is the convergence of the 50D and the 200D coming together right at the .786 Fibonacci retracement level. The 50D now appears ready to break through the 200D moving average and it was last above that level on April 12, 2021, some 18 months ago. This convergent area can be an area of support and it appears that as of today (August 24, 2022) it is being tested.
Also, the last time the 50D average (blue line) crossed above the 100D moving average (red line) was on December 02, 2021. This reversed upwards and crossed over on July 20,2022.
Another observation is the RSI indicator or Relative Strength Index indicating the stock has been overbought (larger orange circle) and there has been a decline well below the the upward trend that first started back to the 52W low of .2385 on April 21, 2022 (solid red line under chart). It appears that this downward trend is going to remain intact unless buyers step in at these levels. June 13, 2022 (green arrow-chart) has been noted by many economists and talking heads as the bottom of the major indices such as the DOW, NASDAQ and S&P500 after a miserable decline started for the first six months of 2022. Coincidentally, CYDY share price also bottomed near this period and began to reverse making new higher highs and higher lows. Then on July 20, 2022, the share price increased 32.95% on heavier than normal volume. For the day the share price rose .1450 on 6.768M shares traded. Over the course of 12 days (gray box), the volume was 62M shares and the price rose 192+% to $1.26 before being smacked back down into it’s current retracement level, down 78.6% off the high and currently trading at .6542 cents. The next area of support, if it doesn’t hold at the .786 retracement level, is .54 (white dotted line). I’m looking to make my next purchase near .54 if it can hold and break back above the .6076 price (white arrow).
As to the volume in July, the next 13F filings for the July, August, September period will be released 45 days after the end of the quarter, or near the middle of November. That should give curious investors an idea of who bought up 62M shares in a matter of two weeks.
Closing
If leronlimab is to be a platform drug that has the potential to be marketed for over a dozen or more indications beyond NASH and HIV in the future, as I stated earlier in this article, partnerships might be the best choice. This partnership model could be structured, as an example, to include partnership obligations that require payment to CYDY for low double digit royalties (low means under 49%) on (net or gross TBD) revenue by Pharma, manufacturing cost rebates to CYDY could greatly improve CYDY COGS (clear up any potential Samsung structured debt), commercialization, marketing and sales.
Clinical trials results are a key ingredient to the process of drug development in the pipeline and the POS. Each approval or failure can improve or reduce the drug candidate’s POS. Investors can see the binary nature of these trial outcomes due to the many moving parts attributed to the modeling by Wall Street, not to mention the volatility as the models price in the new information. Either a drug works or it doesn’t. As such, we see that quarterly earnings reports are not nearly as important to net present value of pre-revenue biotechnology companies and their share price as is the outcome of their clinical trials.
Potentially, leronlimab could develop into a platform drug. Looking forward, after any FDA approvals, this would put CYDY in a position to be able to negotiate better terms with their other top line leronlimab therapies already approved and, in many cases shorten future trials.
One of the best baseball movies produced and probably one of the most quoted lines from any movie comes from Field of Dreams. Ray Kinsella, played by Kevin Costner, is walking through a cornfield on his farm in Iowa when he hears, “If you build it, they will come.” Establishing a partnership in the early innings of the game leaves the door open for other drug companies to co-develop leronlimab as a therapeutic for other indications.
Finally, building a robust pipeline, establishing partnerships and creating a healthy balance sheet are essential with Wall Street analysts who apply models that project multiples on pre-revenue biotech’s. CytoDyn only needs one hit to extend the innings from any spot in the lineup, whether an inflammatory disease, infectious disease or oncology.
Be the first to comment