

dem10
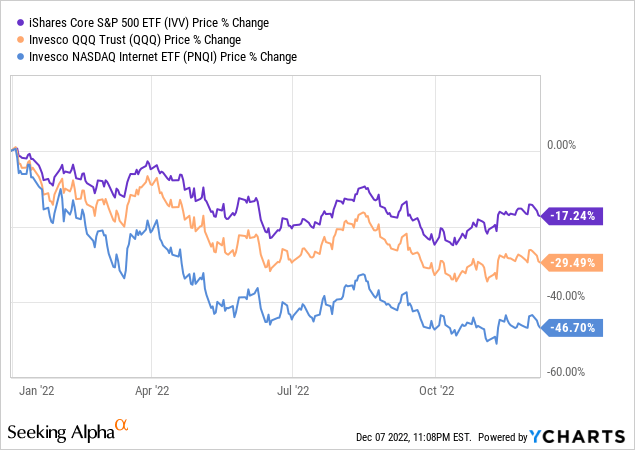
Investor exodus from growth stocks has been ruthless this year. Indeed, a few times inflation surprises lifted investors’ spirits like in July when the tech-heavy Invesco QQQ ETF (QQQ) delivered a 9.5% return, yet the revival appeared short-lived. The one the market is experiencing now may also finally appear misleading, with the headline question being what awaits us in 2023.
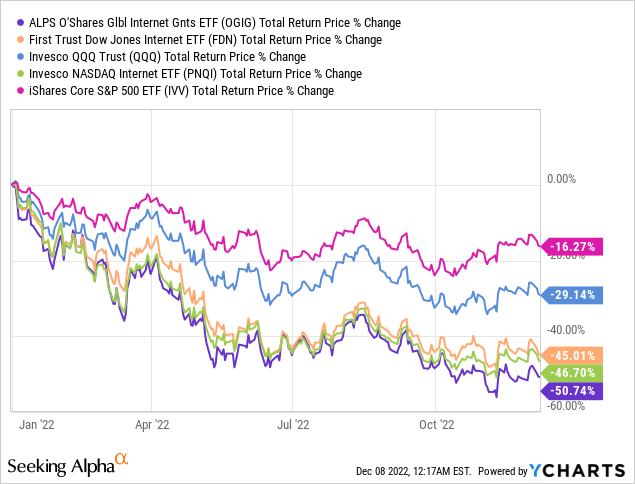
But what if the oil price surprises to the downside, inflation inches lower, and the Fed pauses rate hikes or reverses course? Perhaps, it is time to crank up bets on tech- and growth-heavy funds like the Invesco NASDAQ Internet ETF (NASDAQ:PNQI), which is down by around 47% YTD.
To answer that question, I would like to assess a few factors the ETF is most exposed to at the moment. For better context, I will compare the parameters of concern with the QQQ fund. This should help us to arrive at a balanced conclusion on whether the fund is worth considering at the current levels or not.
Investment strategy. PNQI and QQQ comparison
PNQI’s investment strategy is based on the modified market-cap-weighted Nasdaq CTA Internet Index. Eligible U.S-listed companies mostly provide internet-related services, i.e., offer relevant software, operate search engines, are active in web hosting and website design, or “Internet retail commerce as determined by the Consumer Technology Association.” Please note this list might include other types of services.
Micro-caps with market values south of $200 million as well as stocks with inadequate liquidity are shown the red light. To limit the impact of mega-size companies on the index’s performance, the methodology includes an 8% cap for the five highest-ranking names. Reconstitution and rebalancing follow a quarterly schedule.
In the current version, the PNQI portfolio features 80 stocks, with the top ten having about 60% weight. With top-heaviness clearly being an issue, a D- Risk grade the fund has at the moment is barely surprising.
The major three positions are Microsoft (MSFT), Alphabet (GOOG), and Disney (DIS), with weights close to or slightly above 8%. Overall, with two $1 trillion league members and over 55% allocated to mega-caps, PNQI’s weighted-average market capitalization sits at about $409 billion, still grossly below QQQ’s $743 billion, as per my estimates, which parked approximately 30% of the net assets in the $1 trillion club alone, including Apple (AAPL), as well as two share classes of Alphabet, while PNQI opted for Class C (GOOG) only.
Next, looking at the GICS sector exposure, it appears PNQI overweights communication services and consumer discretionary, meanwhile having substantially lower exposure to information technology, which might look counter-intuitive a bit, yet please bear in mind that Amazon (AMZN), Alibaba (BABA), Airbnb (ABNB), eBay (EBAY), and other internet industry players PNQI invested in and which likely do not need a lengthy introduction are considered the consumer discretionary players.
Created by the author using data from the funds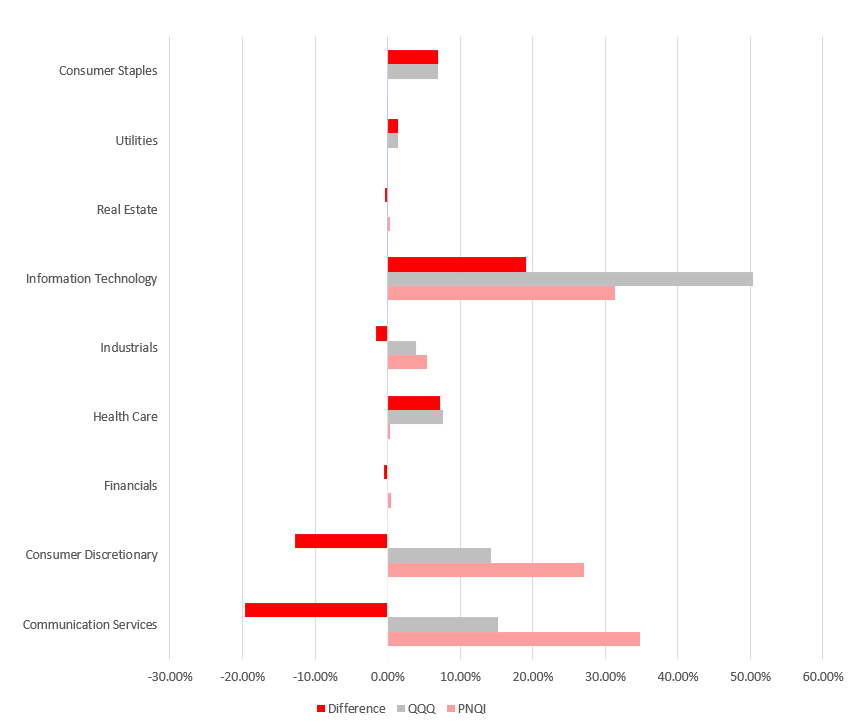
With such a massive WA (weighted-average) market cap, expect solid premia incorporated into both QQQ’s and PNQI’s multiples. To bring a bit more color, I have created the following chart.
Calculated by the author using data from Seeking Alpha and the funds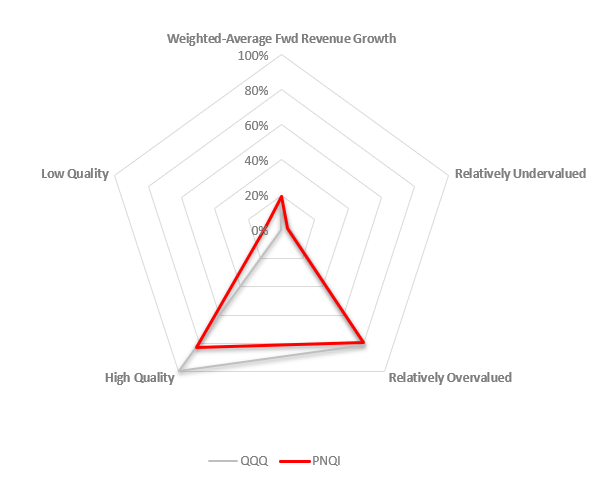
The essential difference that captures attention immediately is quality. QQQ has a much larger share of ‘high-quality’ stocks or those that have a Seeking Alpha Quant Profitability grade of B- or better, about 99% vs. PNQI’s around 82.6%. At the same time, though stocks with a D+ grade and lower account for 9%, while QQQ has almost no exposure to them, I would not say this is indicative of submerged fundamental issues since the result the Internet ETF has delivered is still more than acceptable. So the profitability test has been passed, yet there are caveats that I will return to shortly.
Now, value. Unfortunately, a dismal 47% price decline PNQI has experienced this year has not resulted in valuations across its portfolio becoming comfortable. There are growth and size factors amongst culprits.
Long story short, both QQQ and PNQI are similarly burdened by overappreciated stocks, with close to 81% share of companies with a D+ Valuation grade in the former and over 79% in the latter. Certainly, the market-cap weighting allowed the size premium to affect these figures. In the meantime, the share of undervalued players is just 4.5% and 3.6%, respectively; in the Internet fund, names that trade at a discount are principally mid- and small-caps (partly proving my remark on the size premium), with only Expedia (EXPE) and Trip.com (TCOM) representing large-caps.
Delving deeper, weighted-average multiples should also be assessed.
For instance, the weighted-average Price/Sales ratio is about 4.9x for PNQI, while it is 6.2x for QQQ. The Enterprise Value/Sales ratios tell the same story, being 4.8x for the former and 6.2x for the latter. Investigating whether this difference could be explained by the growth rates, I encountered a strange deviation; in fact, PNQI is ahead of QQQ, sporting an about 19% weighted-average forward revenue growth rate vs. just around 14.2% in the case of the Nasdaq 100 ETF, yet its P/S is lower.
Besides, there are a few ways of looking at the earnings yield. For instance, if we divide each component’s net income by its market cap and then calculate a weighted average (including negative figures), the formula will return 0.61% for PNQI. The earnings yield for QQQ calculated using the same method is around 3.8%. Why the difference is such meaningful? It boils down to the fact that over 16% of the Internet ETF’s holdings are loss-making vs. just about 3% in the case of QQQ (and the weighting schema is partly to blame). So, as I said above, its high quality has caveats.
Final thoughts
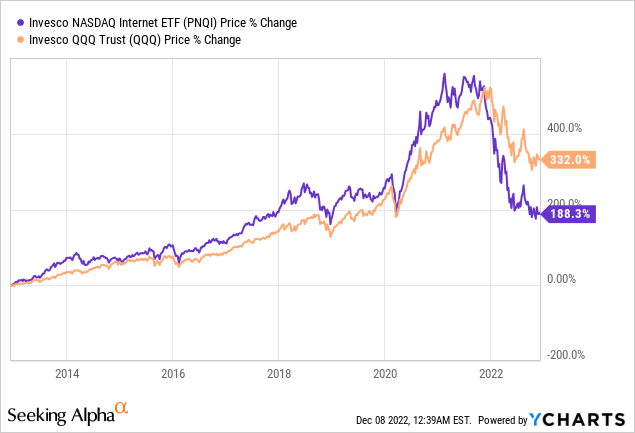
In the past, PNQI’s performance was nothing short of exceptional. The next table compares its returns to QQQ. As my dear readers can see, there are plenty of green cells that indicate periods when the Internet fund outperformed it.
Created by the author using data from Portfolio Visualizer
However, after touching an all-time high in August 2021, the fund has been through the wringer.
In 2022, it has also marginally underperformed its peer First Trust Dow Jones Internet Index ETF (FDN), yet outperformed the ALPS | O’Shares Global Internet Giants ETF (OGIG) since the latter has meaningful FX exposure.
After all, its CAGR delivered over the July 2008 – November 2022 period (it was incepted in June 2008) is below QQQ’s, yet with elevated volatility and a much lower max drawdown.
| Portfolio | QQQ | PNQI | IVV |
| Initial Balance | $10,000 | $10,000 | $10,000 |
| Final Balance | $73,801 | $53,587 | $42,472 |
| CAGR | 14.87% | 12.35% | 10.55% |
| Stdev | 18.76% | 23.42% | 16.17% |
| Best Year | 54.68% | 88.00% | 32.30% |
| Worst Year | -34.02% | -43.70% | -28.51% |
| Max. Drawdown | -40.18% | -55.68% | -41.68% |
| Sharpe Ratio | 0.81 | 0.59 | 0.67 |
| Sortino Ratio | 1.27 | 0.9 | 0.99 |
| Market Correlation | 0.92 | 0.8 | 1 |
Created by the author using data from Portfolio Visualizer
So, 2022 has been nothing short of calamitous. However, needless to say, the internet economy’s growth prospects are not going anyway anytime soon. Does this imply it is worth cranking up bets on QQQ or PNQI? In fairness, I would not say I am satisfied with PNQI’s current factor exposure.
The fact is, I still prefer value with a substantial layer of quality as I believe the combination is the safest for an environment with capital shortage still being an issue. Unfortunately, most tech-focused ETFs offer little of the former, with the latter also being far from perfect in many cases. And although the Invesco NASDAQ Internet ETF has fairly decent profitability characteristics (with nuances touched upon above), its valuation is worrisome. The risks are too high and uncertainty still reigns. In this regard, I am of the opinion that neither PNQI nor its peer funds targeting high-growth stocks offer value at this point.
Be the first to comment