

Alexandros Michailidis/iStock Editorial via Getty Images
I am maintaining a positive risk/reward rating on Pfizer (NYSE:PFE) based on its aggressive growth strategy, rapidly increasing growth estimates, a deeply discounted valuation, and unusually strong technical support.
Risk/Reward Rating: Positive
If someone had asked me prior to 2021 to estimate the probability of Pfizer growing its sales by 140% over two years, my estimate would have been exceedingly close to 0%. That Pfizer accomplished this is testament to the sheer scale of the biotechnology opportunity set. It is also renders the growth potential self-evident.
Growth Estimates Ratchet Up
In fact, since my last report on 10-18-22, consensus sales and earnings estimates have risen substantially. The following two tables were compiled from current consensus estimates provided by Seeking Alpha. The consensus estimates from 10-18-21 were carried over from my last Pfizer report which also used consensus data provided by Seeking Alpha. I have highlighted in blue the current consensus sales estimates and in yellow the estimates as of 10-18-21 for ease of contrast. In the lower portion of the table, I display the change in consensus sales estimates over the past five months and highlight the enormity of the expected sales increases in blue.
Source: Seeking Alpha. Created by Brian Kapp, stoxdox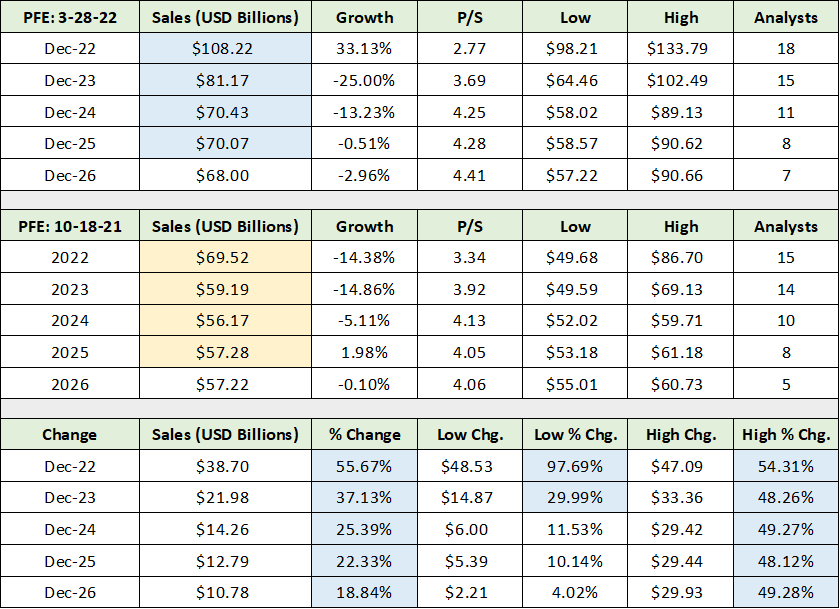
Please note that the change in sales estimates in the lower portion of the table are in billions of USD. The consensus analyst estimates for 2022 and 2023 have increased by $39 billion and $22 billion, respectively. On a percentage basis, estimates have increased materially through 2026 (highlighted in blue). From my prior Pfizer report:
Pfizer also offers upside surprise potential compared to the current consensus estimates… a perfect storm could be created for a materially higher share price.
Turning to the earnings front, the step change higher since the last report is incredible. I have highlighted in yellow the current consensus earnings estimates for 2022 through 2026 as well as those as of 10-18-22 for the same years. I have highlighted in blue the valuation based on consensus earnings estimates. Of note, Pfizer’s valuation multiple has not expanded in response to the rapidly rising growth estimates through 2026, remaining pinned between 11x and 12x earnings estimates.
Source: Seeking Alpha. Created by Brian Kapp, stoxdox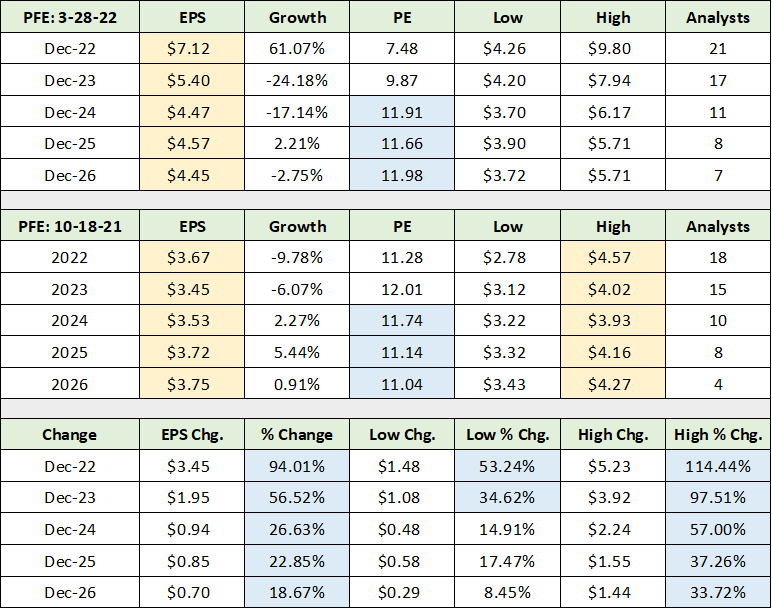
In the lower section of the table, I have highlighted in blue the percentage change in the consensus analyst estimates. The rates of change are remarkable by any standards; this is especially true for a company the size of Pfizer. The driver of the increasing estimates for 2022 and 2023 is clearly Pfizer’s COVID vaccine. Pfizer’s COVID vaccine leadership is on display on the left-hand side of the following slide from Pfizer’s Q4 2021 earnings presentation. Some might even categorize Pfizer as dominating the market at 70% market share in vaccine doses in the US and Europe.
Source: Pfizer’s Q4 2021 earnings presentation 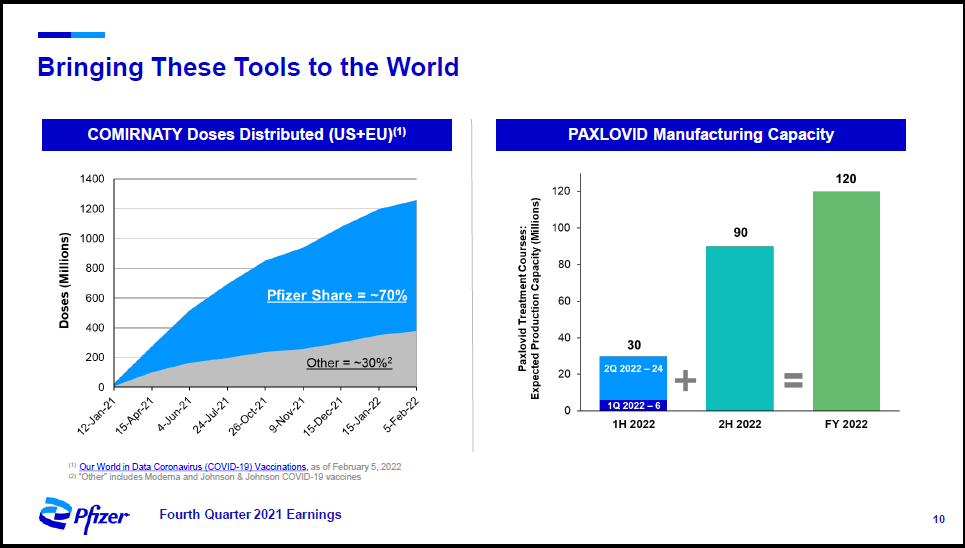
In addition to the COVID vaccine, Pfizer is innovating rapidly and has received approval for an oral COVID treatment in pill form (PAXLOVID). Pfizer is ramping up capacity as can be seen on the right half of the slide. The pill formulation is a significant contributor to the ratcheting higher of growth estimates for 2022 and 2023 since the last report. COVID aside, growth estimates for Pfizer are rising broadly though 2026, hinting at increasing expectations for non-COVID related growth.
Growth Trajectory
Given Pfizer’s incredibly low valuation of 7x the 2022 consensus earnings estimate and 12x that of 2024, it is clear that the marketplace is struggling with the shape of Pfizer’s growth curve. Earnings appear to be heading lower starting in 2023 due to the anticipated peak in COVID-related sales. While this is most certainly the case, we have to remove the COVID spike from the equation to determine the underlying growth trajectory. In the following table, I calculate the annualized growth rate since 2020 (pre-COVID) using consensus earnings and sales estimates through 2026 (the Annualized 2020 columns).
Created by Brian Kapp, stoxdox 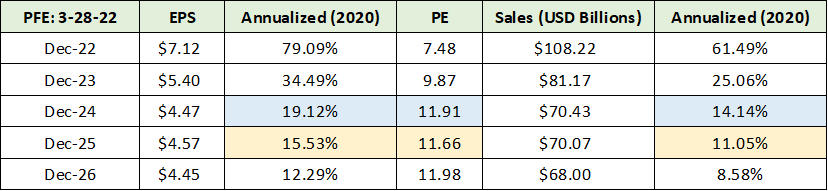
I have highlighted in blue Pfizer’s expected annual growth rate through 2024 using 2020 as the base year as well as the valuation on 2024 estimates. The same data for 2025 is highlighted in yellow. Assuming the COVID spike is in the rearview mirror in 2024 and 2025, consensus estimates are for Pfizer to grow earnings at 19% and 16% per year, respectively. The estimated annual sales growth trajectories of 14% and 11% through 2024 and 2025 are well-above general economic growth rates, placing Pfizer solidly in the ranks of top-tier growth stocks.
These are not growth rates that one associates with a valuation of 11x to 12x earnings. Current consensus growth estimates support a much higher valuation multiple. In fact, the current median valuation of the sector ranges from 21x to 29x earnings as can be seen below using data compiled from Seeking Alpha.
Source: Seeking Alpha. Created by Brian Kapp, stoxdox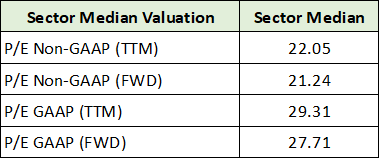
Pfizer’s underlying growth trajectory in the low- to mid-teens alongside its increasing growth estimates place its low valuation in the spotlight. There is ample evidence from the growth and valuation front in support of above-average return potential accompanied by below-average risk.
Segment and Product Detail
Pfizer’s below-average risk is on display when viewing its sales excluding COVID-related products. The following two tables were compiled from Pfizer’s 2021 10-K filed with the SEC and my previous Pfizer report which utilized Pfizer’s Q2 2021 10-Q filed with the SEC. I have highlighted in yellow Pfizer’s total sales excluding COVID-related products as well as the annualized growth rate over the past one and two years which is at 7% per year. The top-performing segments are highlighted in blue.
Created by Brian Kapp, stoxdox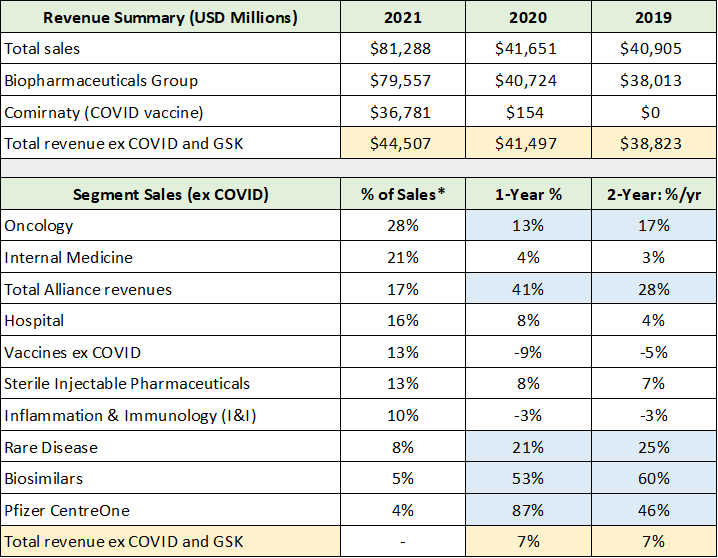
It is important to note that Pfizer has no rapidly slowing segments. The segments that are not growing rapidly are either expanding or contracting moderately. This dynamic is supportive of healthy overall sales growth as rapidly growing segments are not being offset by rapidly slowing segments. This is further evidenced by the product sales detail in the following two tables.
Created by Brian Kapp, stoxdox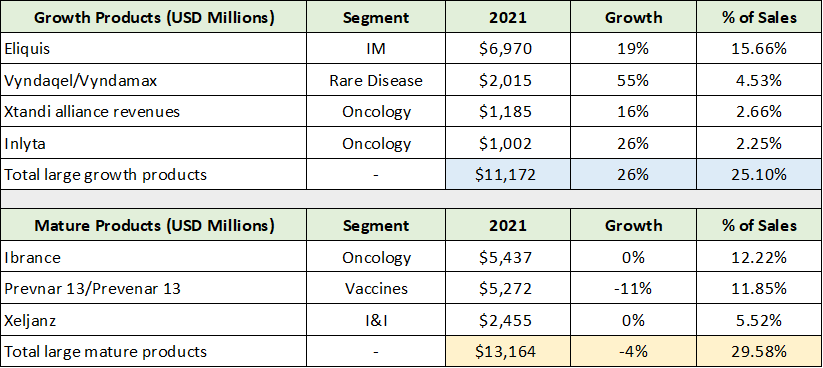
The above table displays Pfizer’s large non-COVID products and categorizes them as either growing (the upper portion of the table) or mature (the lower portion of the table). I have highlighted the summary data for ease of contrast.
Notice that Pfizer’s large growing products (highlighted in blue) are nearly the same size as Pfizer’s large mature products (highlighted in yellow). Additionally, they are growing much more rapidly than the mature products are slowing at 26% and -4%, respectively. This dynamic is once again supportive of healthy overall sales growth.
Outside of Pfizer’s largest products, the underlying theme remains the same for Pfizer’s drug portfolio, which is supportive of growth. The following table was compiled from my previous Pfizer article and is a summary of its total drug portfolio separated into those that are growing and those that are mature.
This data is for the first half of 2021. I include it here without updating it as of year-end because the summary portfolio data remains largely unchanged in terms of distribution, and thus Pfizer’s key portfolio characteristics remain unchanged. Please note that 1H stands for first half and that the % growth columns for Q2 2021 and 1H 2021 are compared to the same periods in 2020.
Created by Brian Kapp, stoxdox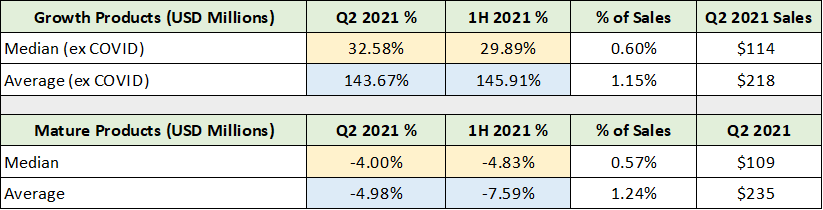
Once again, the underlying theme running throughout Pfizer’s portfolio is confirmed. Pfizer’s growth products are roughly the same size on average as its mature products, while its growth product sales are expanding much more rapidly than its mature product sales are contracting. I have colored coded the comparable cells for each category for ease of comparison.
The key characteristics of Pfizer’s drug portfolio support sustainable non-COVID related sales and earnings growth. Additionally, with the median drug contributing only 0.57% to 0.60% of sales, Pfizer’s portfolio is extraordinarily well-diversified which translates into below-average risk. The sustainable growth with below-average risk on display in Pfizer’s drug portfolio aligns perfectly with the evidence of above-average return potential accompanied by below-average risk on the growth and valuation front discussed above.
Aggressive Growth Strategy
Pfizer’s solid growth trajectory and below-average risk offer an ideal foundation from which to launch its aggressive growth strategy. When combined with the windfall profits emanating from the COVID vaccine success ($30 billion plus of annual free cash flow), I think the crux of the Pfizer investment case is summarized best by the following quote from my prior Pfizer report (emphasis added):
Pfizer is best viewed as a biotech growth opportunity fund operating with a substantial capital base, existing infrastructure at scale, and rapidly growing free cash flow for reinvestment and shareholder distributions. The primary focus in monitoring Pfizer’s future success will be placed on the capital allocation and investment choices made with its substantial financial resources.
At the time of my last report, there was some concern that Pfizer would choose large shareholder distributions in the form of share buybacks and special dividends for its windfall COVID profits. Pfizer communicated very clearly in its Q4 2021 8-K, 2021 10-K, and by its actions since my last report, that it intends to embark on an aggressive-growth strategy. This is excellent news for long-term growth.
Recent Investments
Pfizer’s actions since my report in October 2021 speak volumes. The following table was compiled from Pfizer’s 2021 10-K filed with the SEC and outlines its recent growth investment activity. I have highlighted in yellow the two largest investments. These were complete acquisitions and they comprise 90% of the roughly $10 billion invested since November of 2021 and 79% of the total since September of 2020.
Created by Brian Kapp, stoxdox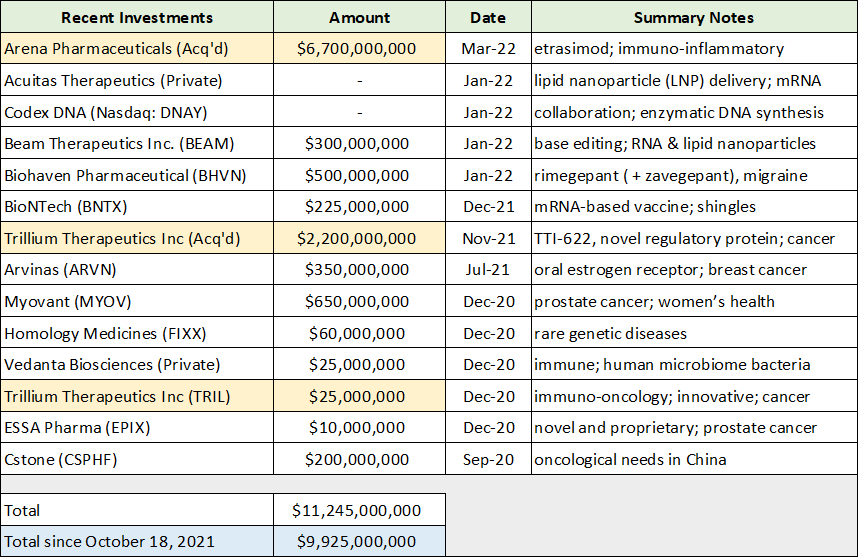
The Summary Notes column provides a very brief description of each investment and acquisition. Importantly, six of the thirteen investments are in the cancer segment, which is Pfizer’s top segment at 28% of total sales (excluding COVID). Oncology is also Pfizer’s fastest-growing product segment growing at 17% per year over the past two years. Cancer remains one of the largest growth opportunities in medicine.
Equally important, four of the investments are focused on cutting-edge RNA technology, which underlies Pfizer’s COVID vaccine. The asymmetric upside embedded in such technology is self-evident, while the larger opportunity surface has barely been scratched.
Arena Pharmaceuticals
Pfizer’s largest single investment was the acquisition of Arena Pharmaceuticals which is in the Inflammation & Immunology segment. While the $6.7 billion price tag raises some concern at first glance as to Pfizer’s investment discipline, it looks quite attractive upon further review. The following two slides from Pfizer’s Inflammation & Immunology Investor presentation summarize the acquisition. On the first slide, please note the bold-highlighted text in the lower left-hand corner.
Source: Pfizer’s Inflammation & Immunology Investor presentation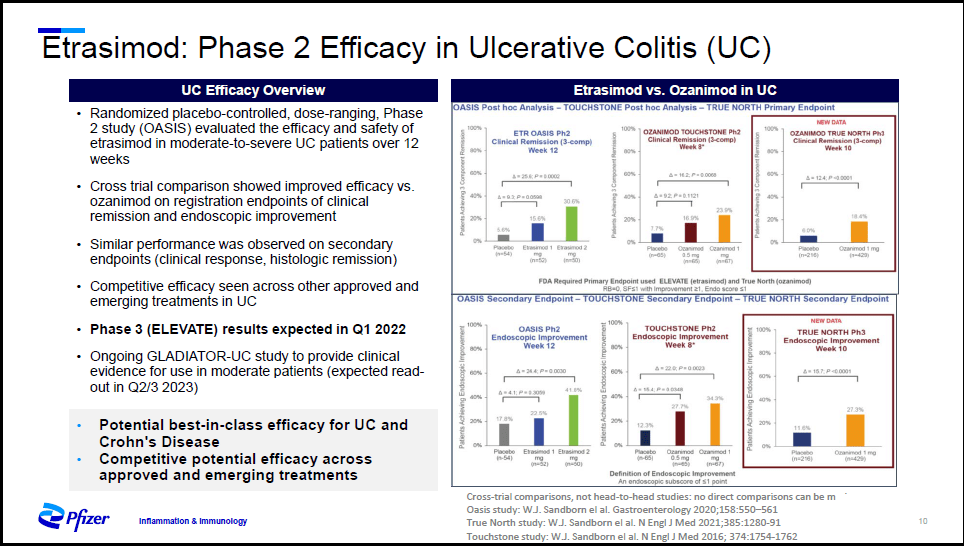
The potential for a best-in-class Ulcerative Colitis and Crohn’s Disease treatment (Inflammatory Bowel Disease) represents an extraordinary opportunity. By some estimates, the market opportunity could reach $28 billion annually by mid-decade. The next slide outlines the strategic rationale for the acquisition. In particular, notice that Etrasimod is expected to add to near-term growth in 2023, while adding material growth potential mid- to late decade (the green squares on the timeline).
Source: Pfizer’s Inflammation & Immunology Investor presentation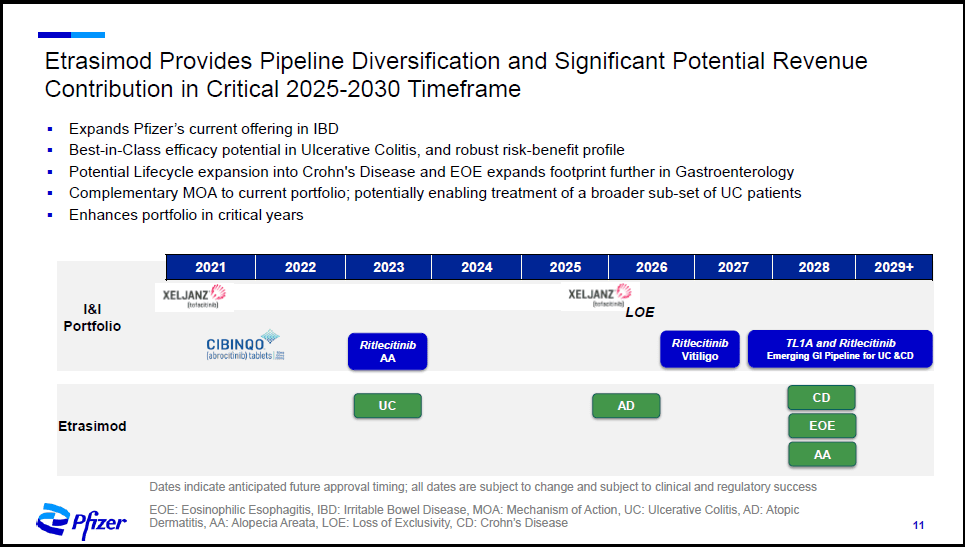
The added growth from Arena Pharmaceuticals is likely a meaningful contributor to the material increases in analyst growth expectations into mid-decade since my last report. This acquisition highlights Pfizer’s increasing growth profile resulting from the COVID capital influx and budding growth investment cycle.
Trillium
The second largest investment was the acquisition of Trillium, which is targeting blood cancers. Cancer is one of the leading causes of death worldwide rendering the opportunity self-evident. The following slide from the Trillium acquisition presentation summarizes the strategic reasoning for the investment. Please note the bold-highlighted text in the lower section of the slide: Value Rationale.
Source: Pfizer’s Trillium acquisition presentation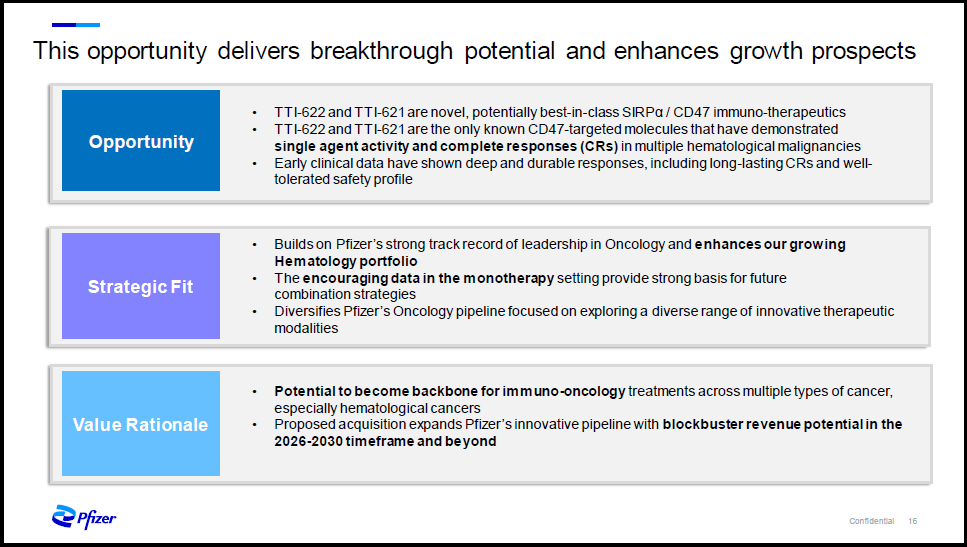
The largest challenge facing the long-term Pfizer investment case is its ability to continue to grow from such a large base in the latter half of the current decade. While the Trillium purchase price was substantial at $2.2 billion, the potential for blockbuster revenue in the second half of the decade places it in context. The added benefit of a potentially new backbone platform across various types of cancer is an incredible opportunity indeed.
Smaller Investments
The smaller investments are equally exciting as the two large opportunities discussed above. Rather than review each individually, I have summarized the growth profile of the investments using consensus analyst estimates for sales and earnings provided by Seeking Alpha for each public company investment (BNTX, BEAM, BHVN, ARVN, MYOV, FIXX, EPIX, and CSPHF). This summary approach captures the essence of Pfizer’s aggressive growth strategy by viewing the growth profile of its investment targets. In the first table, I have highlighted in blue the years for which extraordinary sales growth is forecast for each company.
Source: Seeking Alpha. Created by Brian Kapp, stoxdox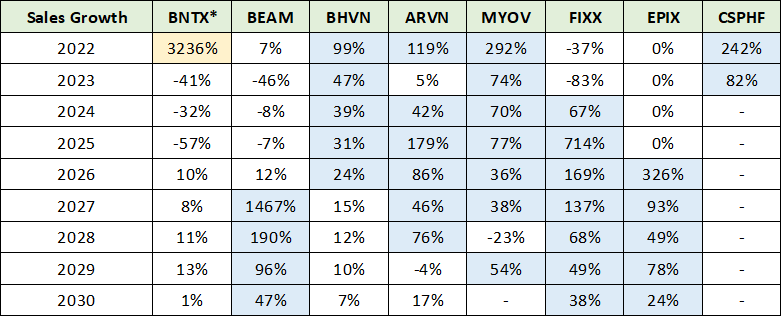
Notice that sales are generally on a rapid growth trajectory right now and that the growth expectations through 2030 are quite persistent and extraordinarily strong. This bodes well for Pfizer’s growth profile in the mid-decade time frame. The following table summarizes the valuation of each company based on PE (price-to-earnings) and P/S (price-to-sales). I have highlighted in blue the valuations that look to be incredibly attractive given the exponential growth potential in the biotechnology space.
Source: Seeking Alpha. Created by Brian Kapp, stoxdox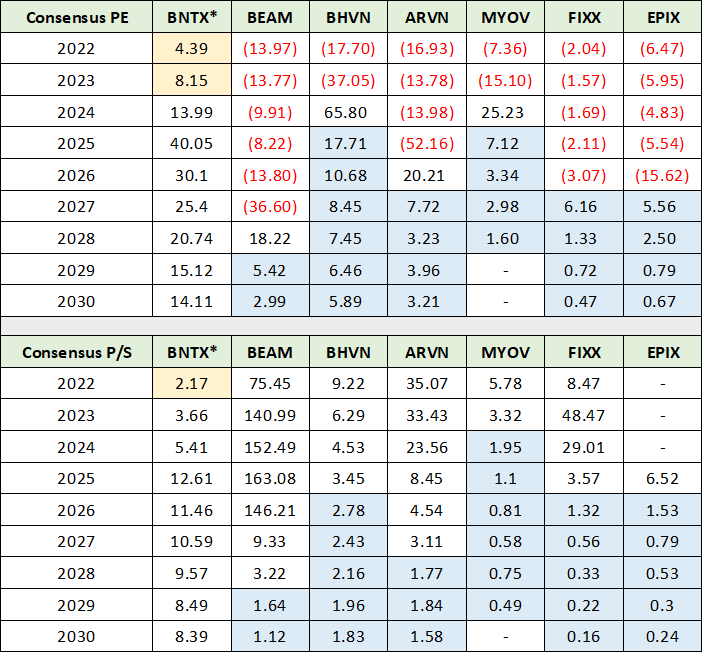
These valuations based on mid-decade to late-decade earnings and sales estimates point toward the incredible growth opportunity set in front of Pfizer. Pfizer will have a historic amount of capital to invest ($52 billion on its current balance sheet and $30+ billion of free cash flow in 2022) at what looks to be a technological and growth inflection point in the biotechnology industry. The situation is summarized perfectly by the following quote from the prior Pfizer report:
Pfizer now possesses all the ingredients needed for an explosive growth investment cycle.
Historic Growth Investment Cycle
It should be noted that Pfizer first invested in BioNTech (NASDAQ:BNTX) in 2018 (highlighted in yellow above). BioNTech is Pfizer’s COVID vaccine partner. The payoff from this investment after just four years has been extraordinary. While this type of investment success is unlikely to repeat, it is possible. BioNTech highlights the potential growth that could materialize from the historic investment cycle on which Pfizer is currently embarking.
The following two slides from Pfizer’s Q4 2021 investor presentation summarize the investment framework for the coming growth cycle. In the first slide highlighted in blue, Pfizer explicitly commits to maintaining and expanding its growth profile through the end of the current decade. Internal research and development is a given, while the business development expansion vector was touched on above in covering recent investments and acquisitions.
Source: Pfizer’s Q4 2021 investor presentation 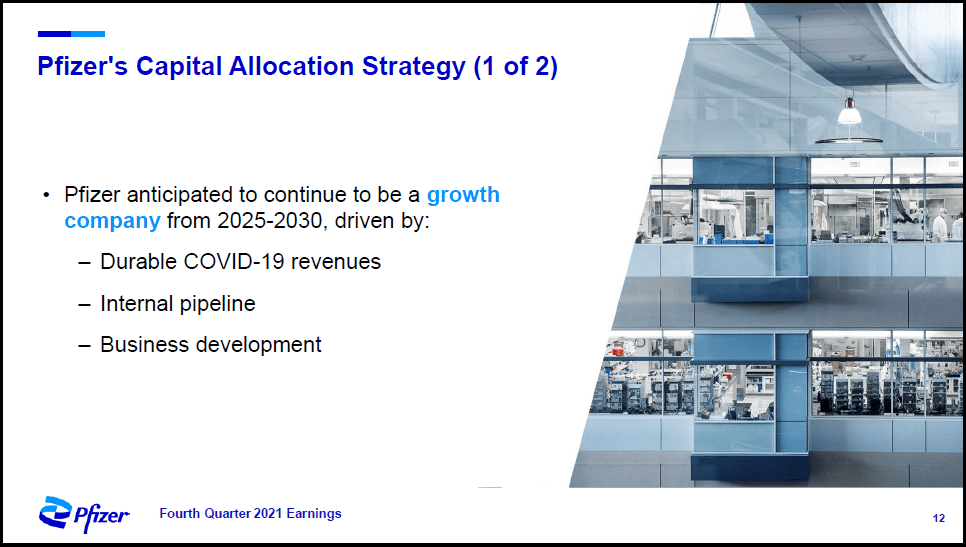
Of particular note, Pfizer anticipates durable COVID sales beyond 2022 and 2023. This remains an extraordinary opportunity that could continue to feed free cash flow into Pfizer’s investment machine at higher levels and for longer than is currently anticipated. This alone could enable Pfizer to continue surprising on the upside. The next slide provides further strategy details which are highlighted in blue text.
Source: Pfizer’s Q4 2021 investor presentation 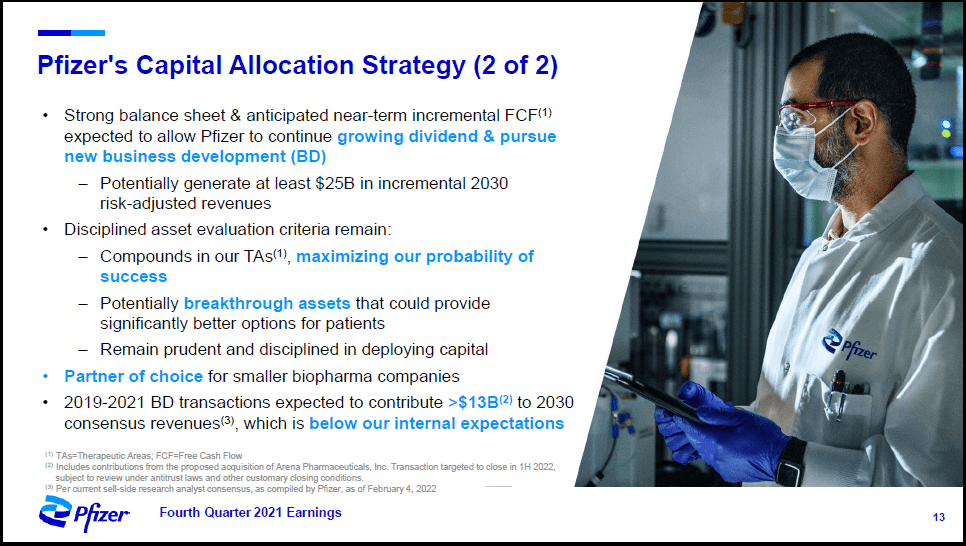
The most important growth vector will continue to be business development (investments and acquisitions) which is closely tied to being the partner of choice for smaller biopharma companies. Pfizer’s partnership with BioNTech highlights its competitive advantage from the perspective of smaller biotech firms. For those looking to maximize value by rapidly penetrating the global marketplace, Pfizer is now the obvious first choice.
Finally, the focus on maximizing the probability of success is a key concept for managing a drug portfolio given the nature of the industry. The industry is characterized by fat tails or infrequent but massive successes combined with many failures and more moderate success outcomes. Pfizer is approaching its portfolio management from a probabilistic, diversified perspective, which is the optimal business strategy for minimizing risk while maximizing expected returns.
Investment Potential: 2022 Guidance and Financial Strength
Pfizer’s guidance for 2022 is for over $37 billion of earnings using its per share earnings and share count projections. This compares to $25 billion in 2021 in which Pfizer generated $30 billion of free cash flow. In the table below, the earnings figures are highlighted in blue and the free cash flow for 2021 is highlighted in yellow. The table was compiled from Pfizer’s Q4 2021 8-K filed with the SEC.
Created by Brian Kapp, stoxdox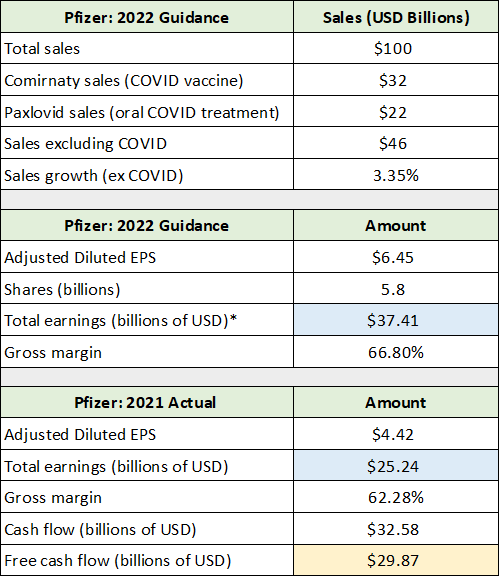
While the company did not provide free cash flow guidance for 2022, it appears to be incredible with earnings estimated at over $37 billion when applying a similar earnings to free cash flow relationship as was the case in 2021. This cash flow will be added to a balance sheet with over $52 billion of investments as of year-end 2021. The balance sheet investment details and changes compared to 2020 are summarized in the following table compiled from Pfizer’s 2021 10-K filed with the SEC. I have highlighted in blue the summary investment information.
Created by Brian Kapp, stoxdox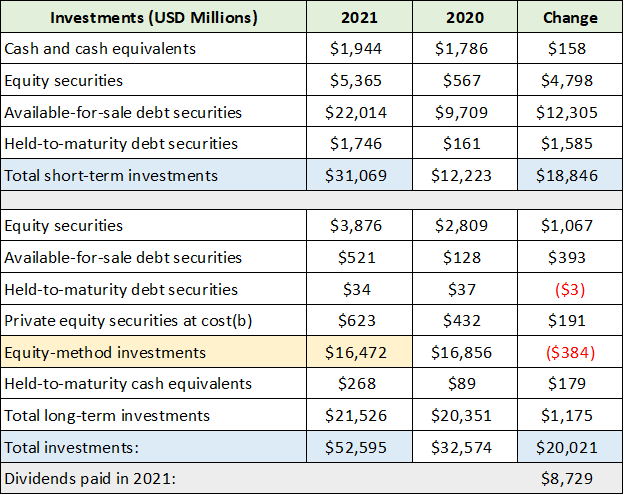
I have highlighted in yellow Pfizer’s 32% ownership of GlaxoSmithKline’s (NYSE: GSK) consumer healthcare business, which accounts for nearly all of Pfizer’s equity method investments at over $16 billion. This is important because GlaxoSmithKline plans to spin off the business in the middle of 2022 via an IPO. This will create an active market for Pfizer to liquidate this large investment in order to reinvest the proceeds into the much more rapidly growing biotech space, if it so chooses.
Please note that the total change in investments of $20 billion in 2021 (highlighted in blue) when added to the total dividends paid in 2021 (highlighted in grey) is nearly identical to Pfizer’s reported $30 billion of free cash flow in 2021. This also highlights the income generation aspect of the Pfizer investment case. With a dividend of $1.60 per share for 2022, Pfizer currently offers a 3% dividend yield on top of its asymmetric growth opportunities.
Technicals
Pfizer’s asymmetric fundamental backdrop is echoed by its technical backdrop. The picture is one of strong nearby technical support complemented by no discernible technical resistance levels. In essence, the shares are well supported to the downside while offering unbounded upside opportunity, technically speaking.
The following monthly price chart covering three decades sets the stage. I have highlighted key technical support levels with the colored horizontal lines. Please note that these levels remain unchanged from my prior Pfizer report, with an additional blue support level near $43 added. Additionally, the orange line near $46 is now support whereas at the time of the last report it represented all-time high resistance.
Pfizer max monthly chart (Created by Brian Kapp using a chart from Barchart.com)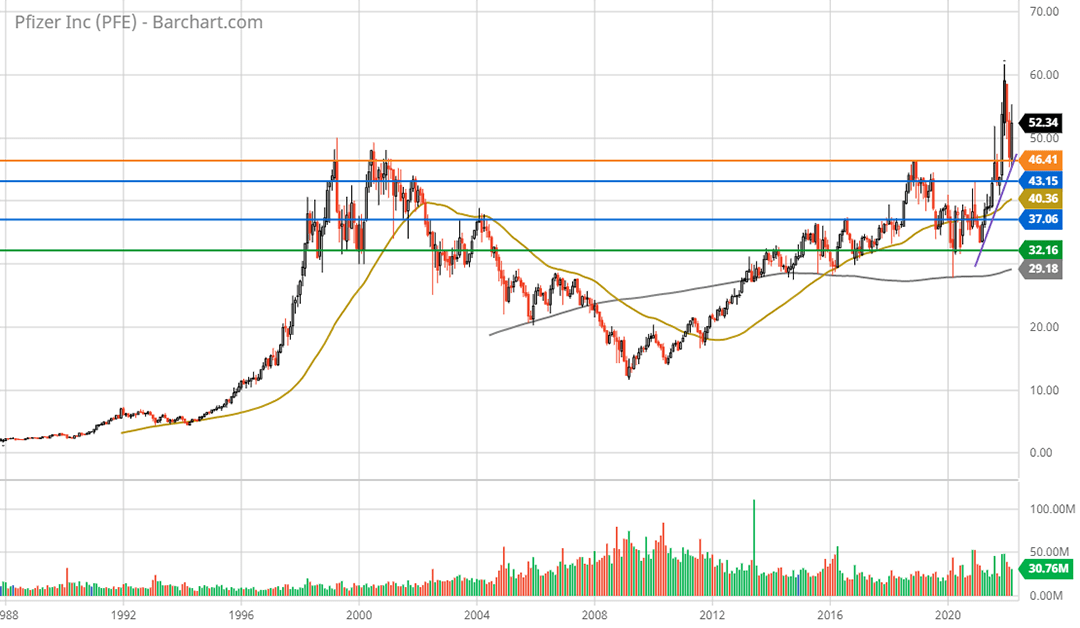
As can be seen on the chart, Pfizer has recently broken out to all-time highs which have been in place since April of 1999. The following 20-year monthly price chart provides a closer look at the long-term support lines and the recent breakout.
Pfizer 20-year monthly chart (Created by Brian Kapp using a chart from Barchart.com)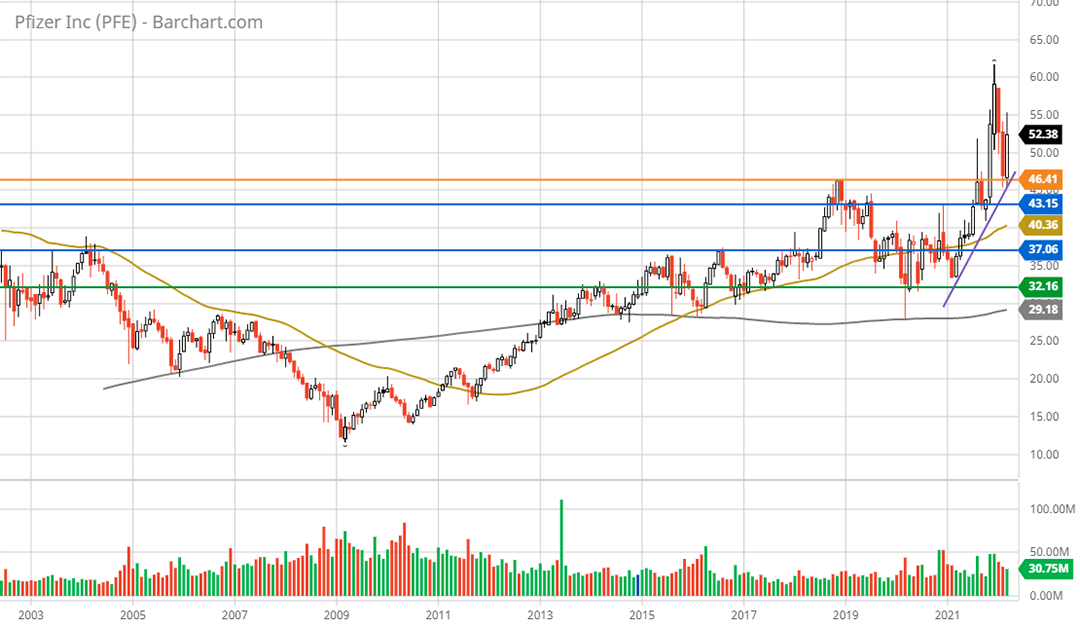
Please note that the purple upward-sloping trendline represents the current daily uptrend and was carried over from the daily price charts. Of note, Pfizer successfully tested support near $46 at the orange line following the 50% price rally from October 2021 to December 2021. Remember that the orange line was all-time high resistance. As a result, there is no visible technical resistance for Pfizer in the near term. The path of least resistance is higher.
The following 5-year weekly chart zooms in on the key support levels while illuminating the uptrend that began in July of 2021. The bull market in Pfizer’s shares remains quite young at just eight months.
Pfizer 5-year weekly chart (Created by Brian Kapp using a chart from Barchart.com)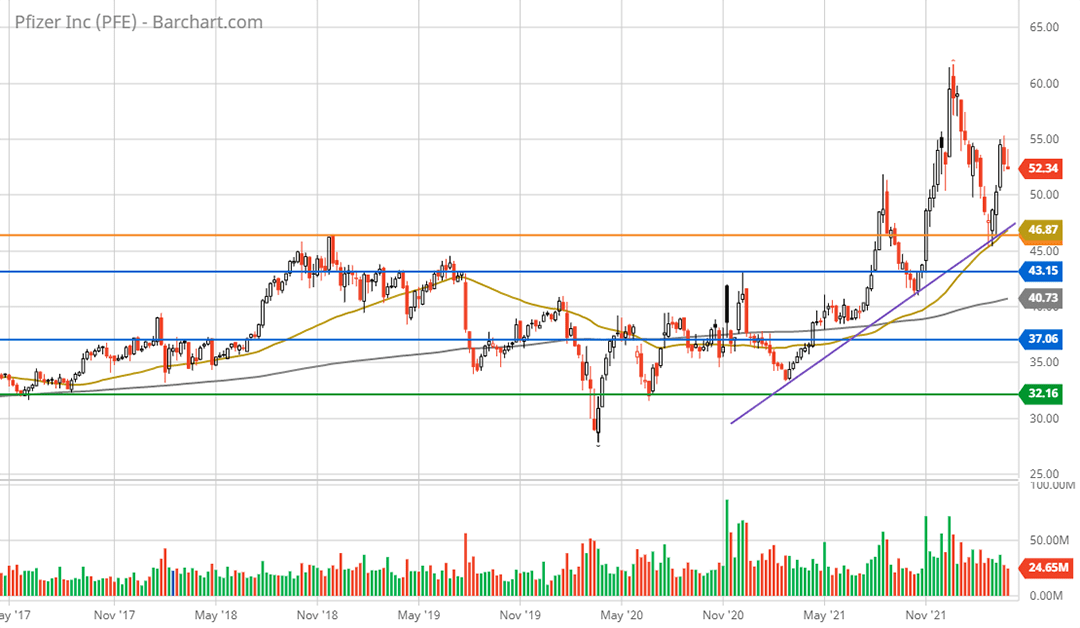
Importantly, the current uptrend is defined by the purple line which has crossed above the top support level at the orange line. This fact should reinforce the $46 area as an exceptionally strong support zone. If this were to fail, the blue line near $43 should act as exceptionally strong support as it was resistance throughout 2018 and 2019.
Additionally, the valuation at $43 would be exceedingly low at under 10x the consensus 2024 earnings estimate. As a result, the support levels near $37 (second blue line) and $32 (green line) look to be off the table for the foreseeable future, leaving $43 with potential down to $40 as the most likely worst-case scenario as things stand.
The gold and grey lines on all of the charts are the 50- and 200-period moving averages, respectively. On the monthly charts they are the 50-month and 200-month moving averages, on the weekly charts they are 50-week and 200-week moving averages, and so on. Notice that the 50-week moving average crossed above the 200-week moving average following the first burst or wave higher in July of 2021. This is a long-term trend indicator which is now flashing a bullish long-term uptrend signal.
With a clear all-time high breakout and recently re-established long-term technical uptrend in place, the following 1-year daily chart encapsulates the new technical bull market for Pfizer’s shares.
Pfizer 1-year daily chart (Created by Brian Kapp using a chart from Barchart.com)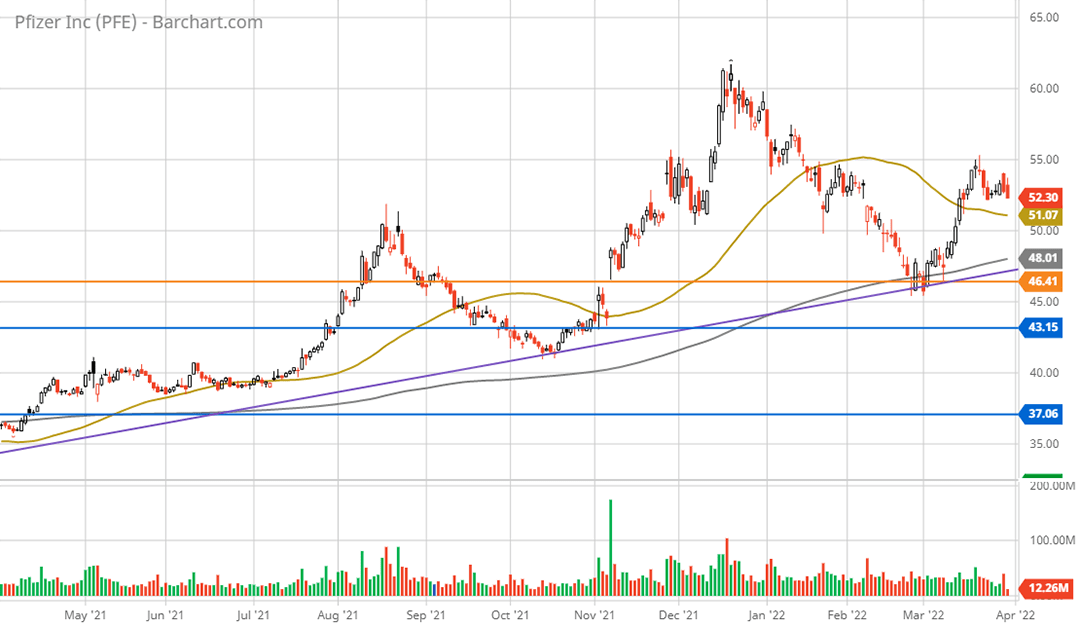
Notice that the new bull market began in July of 2021 which culminated in the first wave of the uptrend breaking above the orange line to new all-time highs, consummating a 29% price advance. This first wave higher confirmed the bullish golden cross that occurred in May 2021, with the 50-day moving average (the gold line) crossing above the 200-day moving average (the grey line). The golden cross provided an early signal of the bullish trend change.
The shares subsequently corrected the first wave higher and found strong support just beneath the blue support line near $43. This low coincided with the timing of my previous Pfizer report. Notice that the bottom in October of 2021 also coincided with the purple uptrend line cementing it as a likely upward trajectory.
The second wave higher peaked in December 2021 at a roughly 50% advance before correcting. It was materially more powerful than the 29% rally in wave one. The correction into March 2022 found immediate support at the orange support line as well as the purple uptrend line, as one would expect if Pfizer were in fact in a new bull market. The shares are now pausing after this bounce off support setting up an excellent accumulation opportunity. Pfizer is sitting just above the 50-day moving average and is within roughly 10% of what should be powerful support levels.
Potential Return Spectrum
Pfizer’s powerful technical setup combined with its incredibly low valuation and rapidly increasing growth profile point toward exceptional return potential accompanied by below-average risk. In the following table (using data compiled throughout this report), I outline a potential return spectrum for Pfizer that is well supported by fundamental and technical factors.
In the upper section of the table, you will find the technical details from the two waves higher of this new bull market as well as an estimate for the current wave 3 higher that began on 3-1-22. The middle section of the table contains price targets derived from fundamental factors using the 2024 consensus earnings estimate. I calculated a price target based on 15x, 20x, and 25x the 2024 consensus estimate. In the lower section of the table, I estimate the downside risk based on the three nearest technical support levels. I also show Pfizer’s valuation on the 2024 consensus earnings estimate if it were to trade down to these lower levels, thus providing fundamental context to the downside technical price targets.
Created by Brian Kapp, stoxdox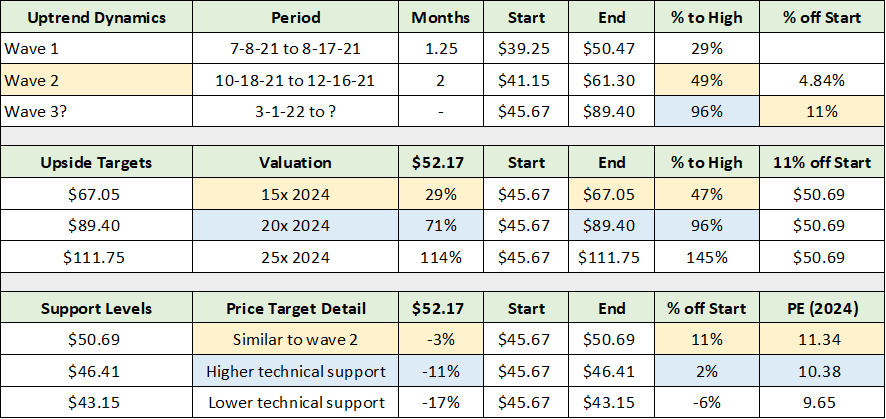
Please note that in the lower two sections the $52.17 column represents the return potential to each of the price targets in the far-left column, respectively. This return column defines the potential return spectrum from the current price of $52.17. I have highlighted in blue what I view as the most likely potential return range looking out 1-3 years. This return spectrum is -11% to +71%.
The yellow highlighted cells in the two lower sections represent what I view as an extremely high probability short-term potential return spectrum of -3% to +29%. Finally, the worst-case scenario looks to be -17% while the best-case scenario looks to be in the area of +114% within a 1-3-year time frame. I view a doubling of Pfizer’s share price to be well within the realm of reasonable medium-term possibilities.
Summary
Pfizer offers a rare asymmetric growth opportunity. The shares are unbounded to the upside while the downside is anchored by strong fundamentals, an incredibly low valuation, and long-term technical support. The investment case becomes incredibly enticing when considering that Pfizer is on the cusp of a historic growth investment cycle at a key technological inflection point for the industry. The opportunity set is further amplified by the remarkable pace of advancement in biotechnology, which is enabling innovation at speed and scale like never before. Pfizer is a profoundly asymmetric opportunity.
Be the first to comment