

Perrigo Company (NYSE: PRGO) has roughly 34% upside potential from current trading levels ($52.30). During this uncertain time, given the COVID-19 pandemic, it is important for consumers to have OTC medicine available to them. Because of this, I have a Buy recommendation on PRGO with a price target at $70. I have also priced in roughly 14% to the downside, where the stock would be trading at $45. During the COVID-19 market selloff, the stock hit lows around $40, but I believe the true low end of trading for PRGO is better around $45.
Background
According to the company’s annual 10-K:
We are dedicated to making lives better by bringing “Quality, Affordable Self-Care Products™” that consumers trust everywhere they are sold. We are a leading provider of over the counter (“OTC”) health and wellness solutions that enhance individual well-being by empowering consumers to proactively prevent or treat conditions that can be self-managed. We are also a leading producer of generic prescription pharmaceutical topical products such as creams, lotions, gels, and nasal sprays.
Company Overview
PRGO reports revenue in three distinct business segments, which include “Americas, International, and Prescription RX.” In each distinct segment, they offer a wide variety of products for their clients including pain medication, sleep medication, vitamins and minerals, personal hygiene, digestive health medication, etc. All of their medications must meet the same standards the FDA (or the respective oversight bodies in other countries) establishes for the brand name products. This can lead to volatile price movements around decisions about new and existing medications the company produces or has produced. However, their products are established and are trusted by consumers, so I only see this being a problem if their developmental drugs get shut down by the FDA.
Americas Segment
According to the company’s 10-K:
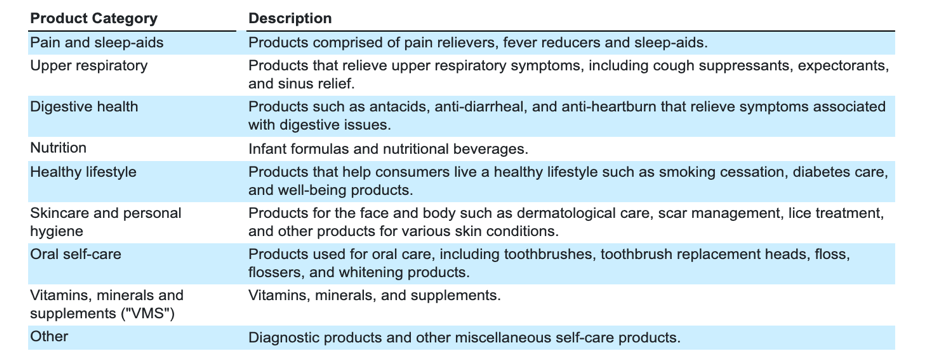
“the CSCA segment is focused primarily on the sale of store brand, self-care products in categories including upper respiratory, pain and sleep-aids, digestive health, nutrition, vitamins, minerals and supplements, healthy lifestyle, skincare and personal hygiene, and oral self-care in the U.S., Mexico, Canada, and South America. We are a leading provider of self-care products sold to consumers via store brands.
The company is continually funding R&D products as well, in all of their segments, to provide high-quality products and medications for their clients.
Below is a chart of the company’s products in the Americas segment:
*Obtained from the company’s annual 10-K statement.
As can be seen from the chart, PRGO is well-diversified, even broken down by segment. In their 10-K, they also break down the revenues from each product category, which I have listed below:
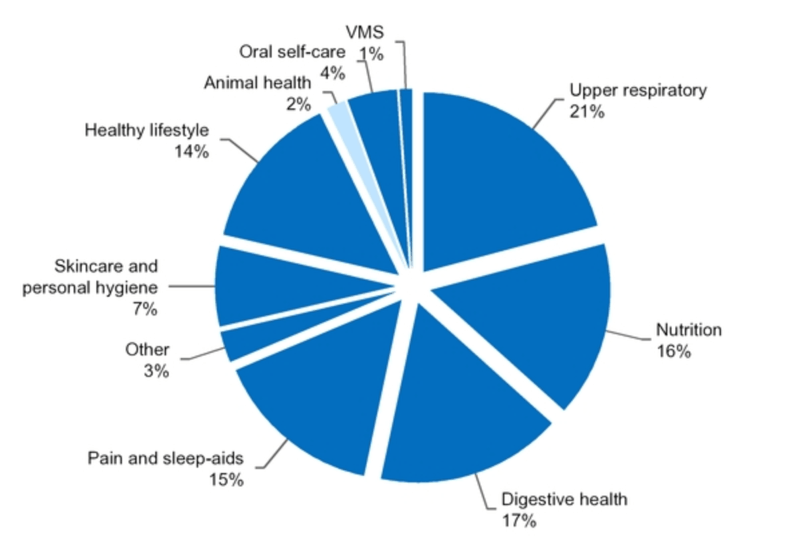
*Chart obtained from the company’s 10-K statement.
There are some categories that make up more of the company’s revenue than others, but that can be expected from a company with a vast array of products. It is important to note that the company continually funds their R&D, which is important, especially in the healthcare space.
International Segment
The International segment of PRGO does similar work as the Americas segment, with the main difference being they sell products in Europe, Australia, the United Kingdom, and parts of Asia. They compete in over 30 countries, and their products have “market-leading positions” (according to their 10-K) in the markets they compete in. As like in the “Americas Segment” section of this report, below is a breakdown of their products and revenue breakdown:
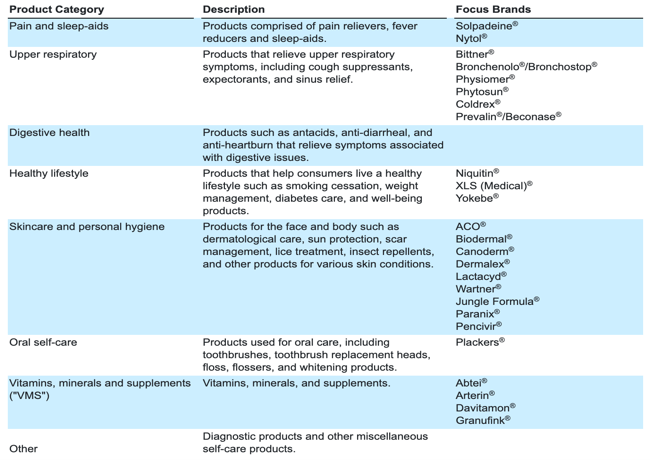
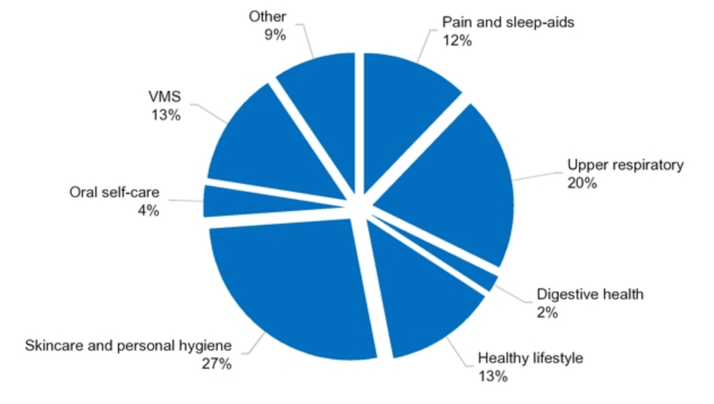
*Both charts obtained from the company’s 10-K statement.
Revenues in the International segment are more diversified than in the Americas segment. I contribute this to the fact that revenues are reported from over 30 countries. This creates a more normal distribution of revenues compared to the Americas segment, which is revenues reported from 3 countries.
Prescription RX
The RX segment of PRGO’s business is a little different compared to the other segments. According to their 10-K, “the RX segment develops, manufactures, and markets a portfolio of generic prescription drugs primarily for sale in the U.S. We define this portfolio as predominantly “extended topicals”, as it encompasses a broad array of dosage forms such as creams, ointments, lotions, gels, shampoos, foams, suppositories, sprays, liquids, suspensions, and solutions. The portfolio also includes select controlled substances, injectables, hormones, oral solid dosage forms, and oral liquid formulations.”
PRGO specializes in the production and manufacturing of topical solutions, but they also fund and develop their oral liquids, inhalers, and injectables products. Some of these products can take longer to develop because they rely on help from third parties. In this segment specifically, their R&D projects focus on complex formulas, many of which will require expensive costs and/or clinical trials (which will need to be approved by the FDA or other, country respective, governing body). Their products are listed below:
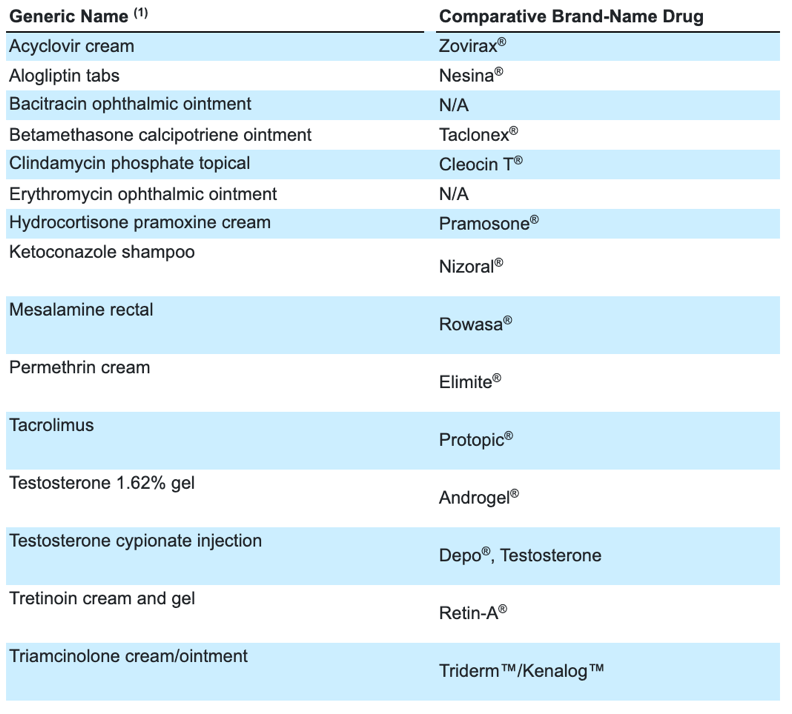
*Chart obtained from the company’s 10-K statement.
Competition/Market Share
PRGO competes in a very competitive market. Competition can be broken down by each segment and product and geographic region; however, most of their competitors only compete for certain parts of an industry. It is rare to find that other companies compete with PRGO in every product category which the company offers. Some of their competitors, however, do have a larger market share in certain areas of PRGO’s expertise. This can have an adverse effect on PRGO’s products in such a market. Also, larger brand name companies typically have more resources they are able to commit to marketing and R&D. These companies, if they so choose, could also manufacture store brand products, rather than prescription-only products. PRGO also competes with smaller, regional, or local companies for market share. However, PRGO believes that they have competitive advantages in sales, marketing, and product development. This will result in consumers choosing PRGO’s products over smaller, and sometimes even larger, companies.
The RX segment of their business is extremely competitive. From smaller biotech companies to large drug manufacturers, drug development is a very competitive market that is hard to be an established player in. Large companies are able to produce generic versions of their own drugs, giving them a larger consumer base; this process is known as “authorized generic.” Mari Edlin does a great job of further explaining this process and why it can be important to the revenues of drug manufacturing companies.
Valuation
I have created different models and examined different metrics to try to value PRGO effectively. The models I have created are a comps analysis, ratio analysis, full-projection model, DCF model, and I built a sensitivity analysis based on the results of these models. I also analyzed metrics such as ROA, ROE, P/E ratio, etc. to try to get a better understanding of the company’s overall position in the market.
Comps Analysis
For my comps analysis, I compared PRGO to respective competitors JNJ and TARO. Although much larger, I believe JNJ is a good company to analyze alongside PRGO because they sell similar products. TARO is a better competitor when analyzing the model simply based on the fact they have more comparable numbers. Below is my model:
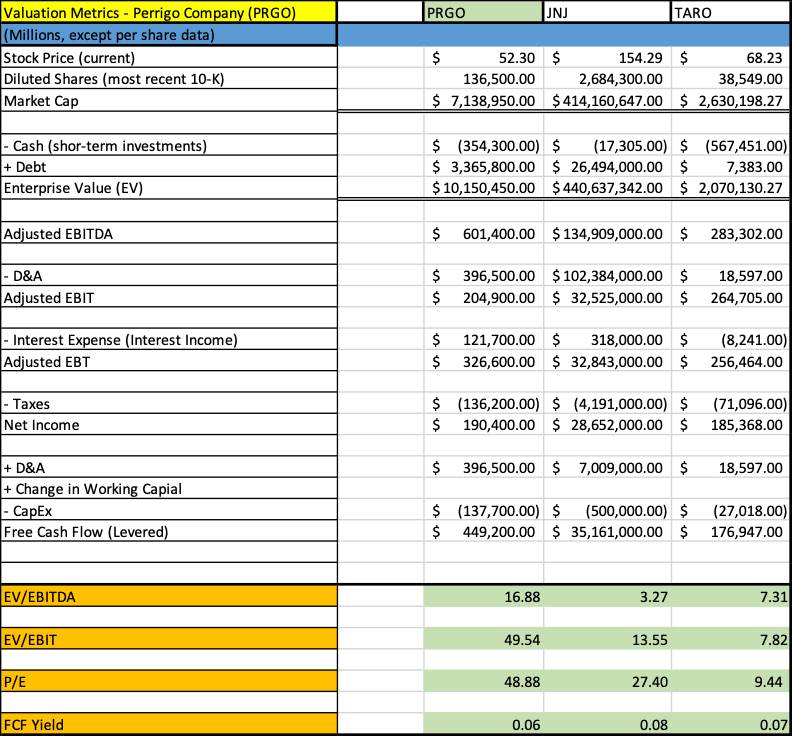
*Created by the author using data obtained from respective companies 10-Q statements.
Based on the above comps analysis model, it can be seen that JNJ has the largest market cap and PRGO is the second largest in terms of market cap. I believe that PRGO is positioned well to perform well and grow at a strong rate based on their P/E ratio. Some people are turned away from a large P/E ratio, but I am a believer that this ratio is pretty consistent when trying to determine growth perspectives of companies.
Ratio Analysis
When building my ratio analysis, I am looking to determine a few specific metrics that a company has had over the last few years. Below is the model that I built:
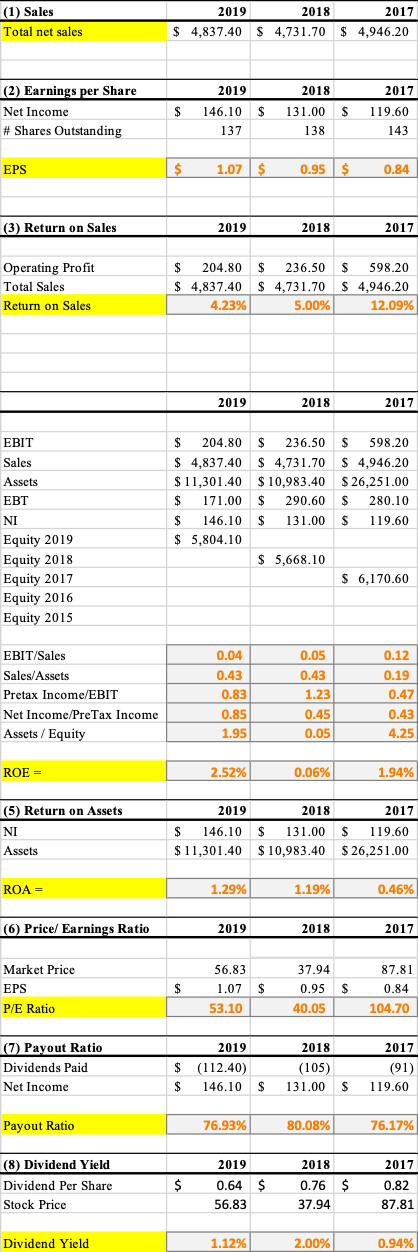
*Created by the author using data obtained from 10-K statements.
This model is specifically built to analyze PRGO from 2017-2019. In this model, I analyze the growth/decline of EPS, ROS, ROE, ROA, P/E ratio, Payout Ratio, and Dividend Yield. PRGO’s EPS has been increasing YoY, signaling strength in the company’s Net Income. PRGO has an impressive Payout Ratio, signaling how much of the company’s earnings they are paying out to shareholders.
Full-Projection Model
For the projection model I built out, I project the company’s three financial statements for the next five years. This model allows me to have a better understanding of growth trends and margins moving forward. Below is my model:
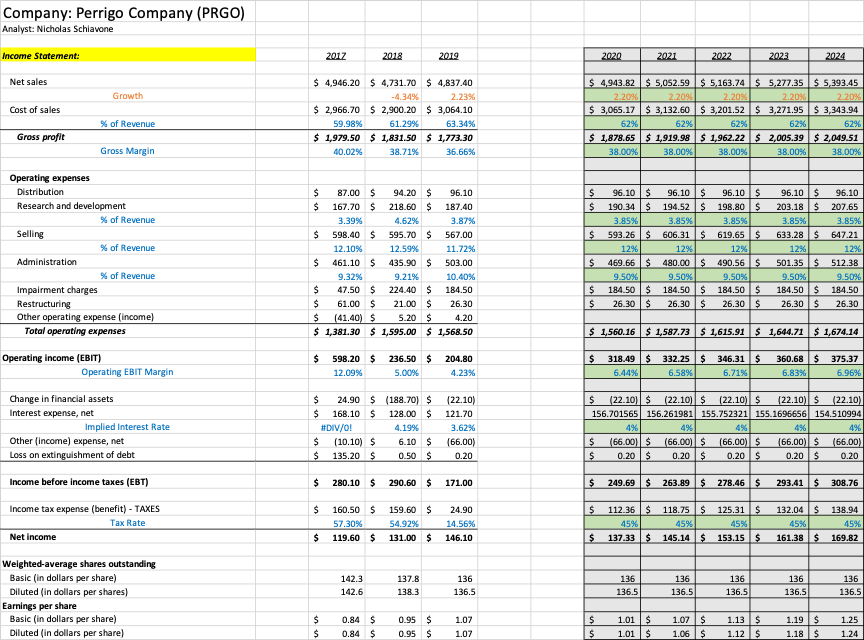
*Created by the author using data obtained from the company’s 10-K statements.
My projection model allows me to build out my DCF model. I use the projections in this model to build out the DCF model which leads me to an intrinsic value for the company. Below is the model I created:
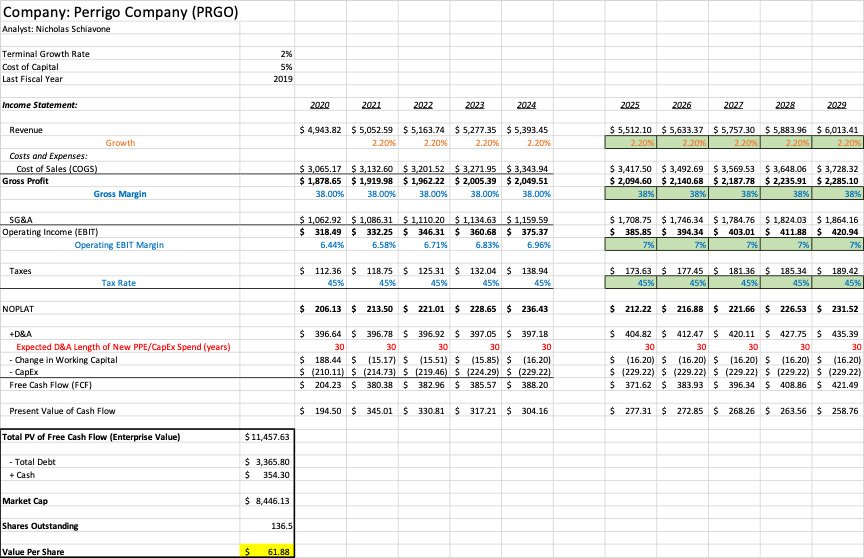
*Created by the author using data gathered from Full-Projection Model.
Sensitivity Analysis
Based on this model, the intrinsic value for PRGO is $61.88, which represents it is still currently undervalued. At the current trading price of $52.30, this model signifies 13% upside potential. However, I still like to build out a sensitivity analysis to determine a fair-trading range for the company, which then determines an intrinsic value for the company. Below is the sensitivity analysis I built analyzing different growth rates and WACCs:
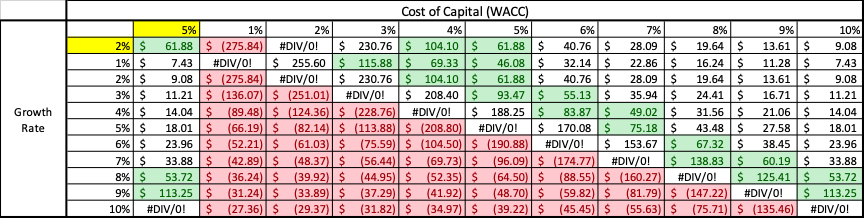
*Created by the author analyzing different growth rates and WACCs from the DCF model.
In the green highlighted boxes, I have determined these numbers to fall into a normal trading range for PRGO. The average of these numbers is determined to be $81.31, which I used in determining a final price target recommendation for the stock. The numbers in red highlighted boxes indicate a negative price, which obviously doesn’t make sense when considering an investment in a stock. This model gives negative numbers at some WACCs and growth rates because of the DCF model intrinsic value calculation.
Final Price Target Recommendation
Using all of the data I have obtained and analyzed, below is my model for determining an intrinsic value for PRGO:
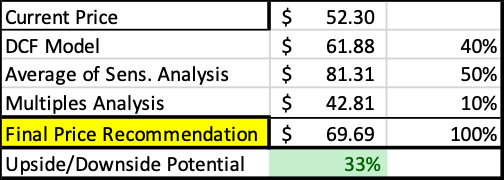 *Created by author showing how final price recommendation was achieved.
The chart above pulls all of my intrinsic value calculations and is given a percentage weight, based on how much I deem that model to be appropriate of the overall stock value. I then multiply each intrinsic value by its respective weight and sum the numbers together to get the final price recommendation of $69.69, which I have simply rounded up to $70 for my price target.
Risks to Consider
When considering investments in a portfolio, it is always smart to analyze the risks associated with the investment. Based on FDA approval process and the volatile nature of healthcare stocks, I wanted to calculate the beta for PRGO. To do this, I analyzed monthly returns for the past five-years for PRGO and ^GSPC. I then did the beta calculation of the covariance of PRGO to ^GSPC divided by the variance of ^GSPC, to determine that the beta of PRGO is roughly 1.22. Below is the model I built to determine this:
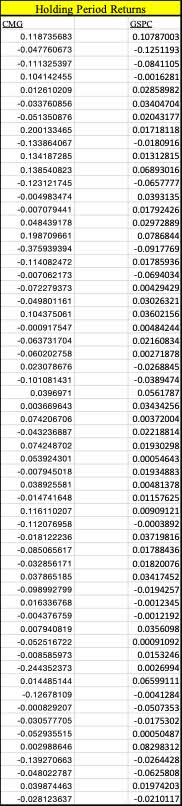
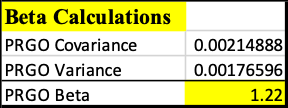
*Both of the above charts were created by the author analyzing monthly returns for PRGO and GSPC.
The beta of the overall market is considered to be 1.00, so with PRGO having a beta of 1.22, they are seen to be more volatile, or risky, than the overall market. I believe this is strongly in part due to them being subject to FDA and other governing bodies’ approval processes for their products. This makes the stock more volatile because investors will be turned away from the stock if the drug trials are shut down by the FDA.
Another risk to consider is the “authorized generic” drugs manufactured by other companies. Larger companies with well-established brand-name drugs are a large risk for PRGO. These companies obviously know what is in their brand-name products, so they are at an advantage when creating similar drugs that cost less. PRGO will first have to, essentially, reverse-engineer the drugs to determine what specific products are in each drug, and then determine a cost-effective way to recreate the drugs.
Conclusion
In conclusion, I’d like to emphasize my bullish sentiment on PRGO. I believe the company will continue being the leader in the OTC healthcare space, which in turn will continue to drive their stock price higher. My price target is strong at $70, and I will put a downside risk at $45. I am projecting 34% to the upside and 14% to the downside. Based on the company’s competitive advantages and ability to cost-effectively recreate brand-name drugs, I believe PRGO is positioned well, even in the current COVID-19 pandemic, to perform well.
Disclosure: I/we have no positions in any stocks mentioned, and no plans to initiate any positions within the next 72 hours. I wrote this article myself, and it expresses my own opinions. I am not receiving compensation for it (other than from Seeking Alpha). I have no business relationship with any company whose stock is mentioned in this article.
Be the first to comment