


sankai
Investment Summary
From the Portfolio Manager’s desk
Following its latest set of numbers, I’ve sized up our position and reiterated our buy call on PerkinElmer, Inc. (NYSE:PKI) shares. Here, we run through the synopsis backing the call. Our first price objective from here on is $155, eyeing further upside targets should it punch through this level.
The stock has bounced from a double bottom in October in unison with the SPX, with its covariance structure shifting up at the same time. With PKI now at an equity beta of 1.1 to the benchmark, the prospect of outsized gains with the SPX’s latest rally are intensified in my estimation. Net-net, reiterate buy.
Exhibit 1. PKI 3-year price action, equity beta lifting with latest capital gains
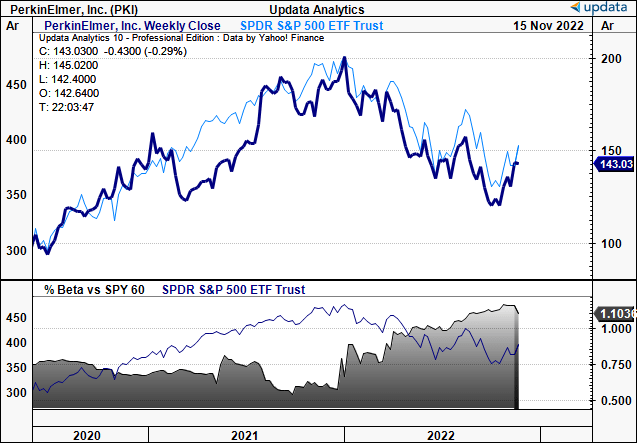
Data: Updata
PKI recent developments
On 14 November PKI announced the FDA had authorized marketing of its EONIS SCID–SMA assay kit, part of its broader EONIS platform.
The test kit can simultaneously detect [in-vitro] spinal muscular atrophy (“SMA”) and severe combined immunodeficiency (“SCID”) in newborns. Notably, this is the first of its kind in the US and has several advantages.
Firstly, there are 35 core and 26 secondary disorders included in the Recommended Uniform Screening Panel (“RUSP”). These are recommended by the Sec. Dep. of Health and Human Services’. Since the list’s inception, there’s been an ongoing challenge to screen for an expanding number of conditions. Costs, labor, operating budgets, available tests, etc., are all considered within the doctrine.
PKI’s EONIS assay therefore provides a breakthrough in the SMA/SCID diagnostics segment. It provides a cost-efficient method to preserve the real state from a patient’s dried blood spot card, to screen both SMA and SCID in one process. For laboratories, this adds direct leverage to operating margins and enables them to examine multiple markers in one set of analytics. This has large appeal in my estimate and could result in accelerated user adoption.
SMA was added to the RUSP list in 2018. It remains a leading cause of genetic infantile mortality. Recent therapeutic developments mean FDA approved treatments have become available for SMA. These include Nusinersen and Zolgensma, although, both differ in mechanism of action.
The former is an antisense oligonucleotide drug, whereas the latter is a viral vector-based gene therapy, aimed for paediatric SMA patients. Nevertheless, both are medical breakthroughs in the segment. Therefore, early detection of SMA is quintessential for maximum benefit of these therapies.
SCID screening was added to the RUSP in 2010. Newborn testing allows early diagnosis of pre-symptomatic infants. This facilitates early treatment such as cell-transplantation [or immunoglobulin infusion for other immunodeficiency disorders].
When combined with the rest of the EONIS platform, the assay kit rounds out the offering and provides PKI income from initial testing all the way downstream.
Hence, the assay kit has potential to be a large mid to long-term growth catalyst for PKI in my estimation.
PKI Q3 Earnings: in-line with longer-term ranges
The company reported mixed Q3 numbers, with a 12% YoY decline in revenue to $1.03 Billion (“Bn”). The weakness was underscored by Covid-related weakness in China, causing a double-digit YoY decrease. Meanwhile, acquisitions added ~800bps of revenue accretion [$0.64/share]. In particular, BioLegend turnover added $54mm [$0.42/share] for the quarter. Management foresees BioLegend clip a $25mm terminal run rate from Covid-related revenue from Q4 FY22.
After carving out and divesting its applied, food and enterprise services (“AFES”) businesses to private equity manager New Mountain Capital in August, management remain confident on achieving a 60% gross margin in the remaining business [versus long-term average in the 45–50% range]. I estimated the deal to be worth $15.80/share in incremental value to the PKI share price at the time.
There wasn’t much talk on the Q3 earnings call of the spinoff in terms of where, and at what pace, PKI will deploy capital afterwards. The strategy will likely be towards dividend growth, strategic buybacks or M&A in my estimation – especially as it retired $50mm of variable rate debt in Q3, and already another $45mm of short-duration debt in Q4.
It now has $3.2Bn of debt on the balance sheet tied up in fixed rates at 2.6%. Management’s capital budgeting preference will be very interesting considering this data. On the one hand, it could reverse some of the dilutive effects incurred from the spin. Although, with a rising cost of capital, M&A also looks attractive for companies with struggling balance sheets.
This is also a point to consider given PKI’s restructuring plans across FY22 YTD. It has scaled back its workforce and freed up liquidity and completed the divestiture in August. As such, net operating profit after tax (“NOPAT”) per share of $1.50 and EPS of $0.67 have pulled back to long-term ranges, as seen in Exhibit 2.
Despite this, the ‘leakage’ from NOPAT to net income has remains relatively steady at ~$0.75/share in Q3. To me this demonstrates a high degree of operating cash flow backing PKI’s valuation, versus if the trend was widening.
Exhibit 2. Steady leakage/spread of NOPAT to earnings implies a high degree of operating cash flow backing profits and valuation for PKI
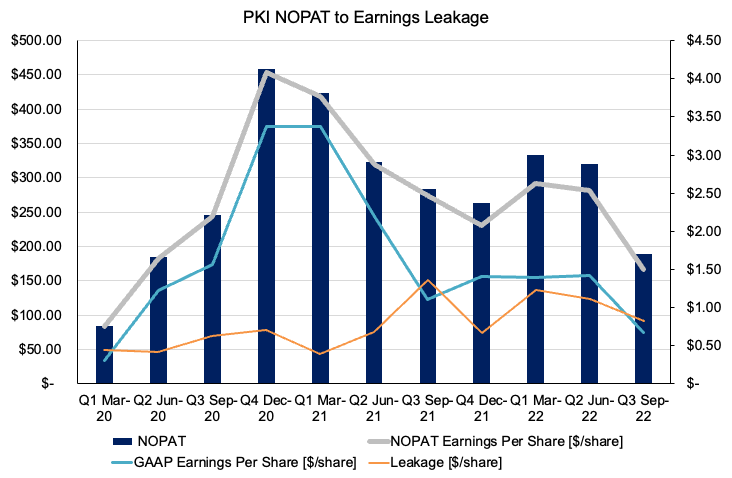
Note: Earnings leakage represents the degree of tax-adjusted operating cash flow relative to net income. Here it is represented in a $/share format for shareholder value. The stable, tight spread indicates a high degree of NOPAT backing PKI’s profit. (Data: HB Insights, PKI SEC filings)
Market data suggest latest rally could extend
As seen in Exhibit 3, fund managers have increased net exposure to PKI over the past 6 months from August lows. I’d like to see more evidence of institutional buying over the coming weeks. If trends continue, future price action could be well supported by serious buyers. I’d be looking to see net exposure return to June levels, as shown in Exhibit 3.
Exhibit 3. Fund exposure increasing – question is, will it continue?
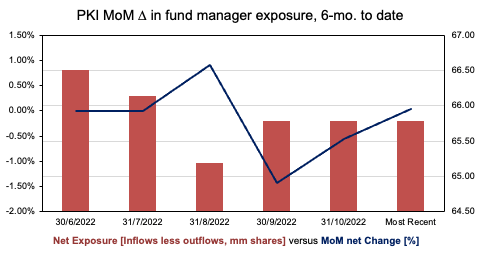
Data: HB Insights, Refinitiv Eikon
Meanwhile, as seen in Exhibit 4, PKI has continued in a 46-week long downtrend that’s been in situ since December FY21. The key pivot occurred in December as weekly volume started evaporating. The 50DMA/250DMA cross in March then sealed the fate of the move in my opinion.
After the first down-wave, PKI made an attempt to reverse course with the June bounce in equities. It traded sideways and closed and closed above the 50DMA for 6 weeks.
However, equity beta was low in June whilst relative strength to the SPX continued declining [seen below]. This and poor volume into the move showed substantial counter-weakness and therefore heavy resistance to any further rally. The entry into the base was also wide and loose, then straight up, which is a poor formation in my understanding.
In the latest attempt from October, however, we’ve seen a volume breakout and reversal and a large counter-gain against the SPX in relative strength. Shares have closed above the 50DMA 5 weeks in a row now and the base is far tighter, pulling towards the 250DMA.
Question is if investors have put the brakes on for PKI or if this is just another wave of the long-term channel. My estimation is that, given volume trends and the chart formation, there’s good evidence to suggest this latest rally can extend beyond PKI’s previous highs.
Exhibit 4. PKI weekly price evolution, May FY21–date.
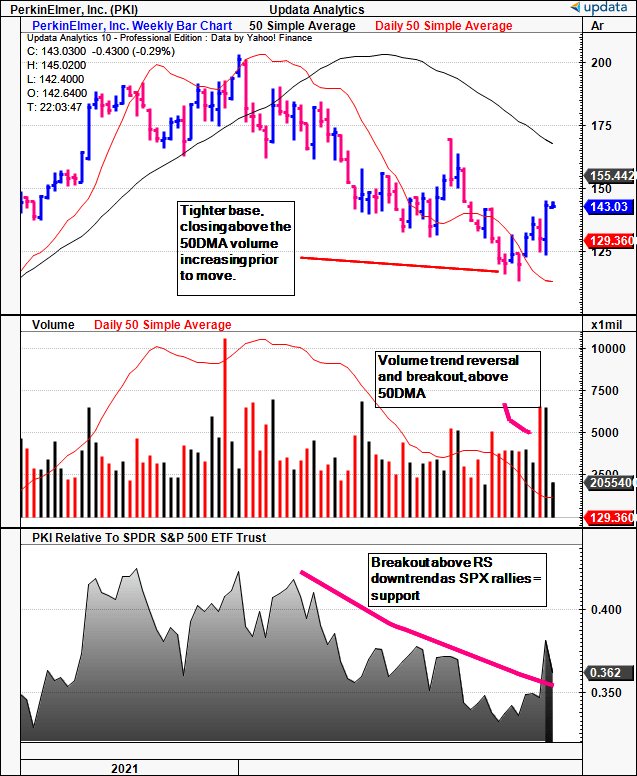
Data: Updata
Valuation
To gauge visibility on where the market will price PKI, I’ve combined technical and fundamental studies.
First is shown below, tracing the fibs down from the August high. Presuming PKI bottomed in October, it is currently testing 61.8% of the channel. The next implied target is $153, then $163 from this assessment.
Exhibit 5. Evidence of price objectives to $153, $163
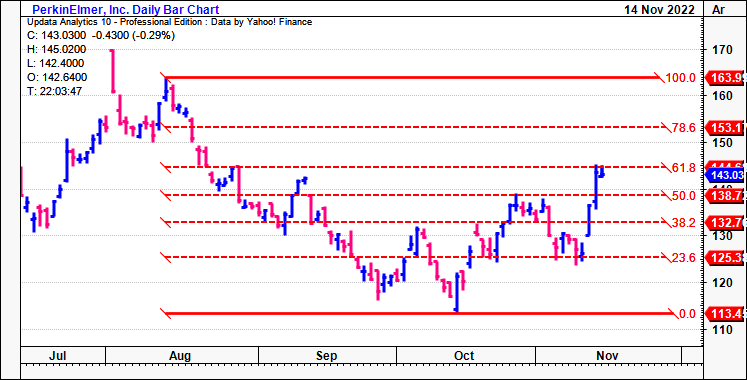
Data: Updata
Meanwhile, point and figure charting suggests an upside target to $154 on the latest price action. The $153–$154 point looks well supported at this stage. A break above the resistance line shown below would validate this move in my opinion.
Exhibit 6. More upside targets to $154.
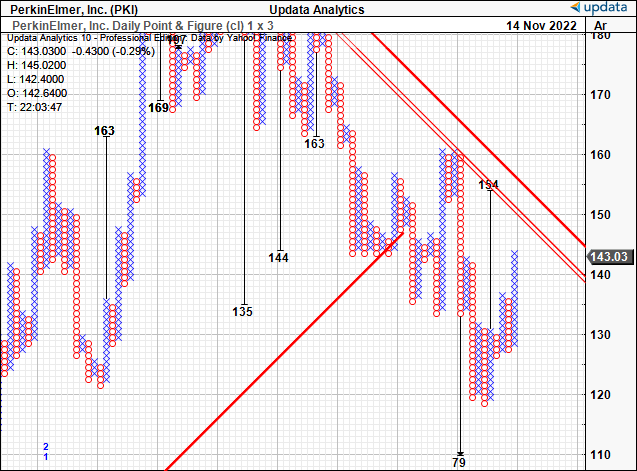
Data: Updata
In addition, we’ve forecasted PKI’s FY22 EPS within a range of $5.40–$7.90 in the base and upside case, respectively. This is a YoY decline from FY21, but a steady growth on TTM EPS of $5.01. Our summarized projections are posted in Appendix 1.
As seen in Exhibit 7, using the current TTMS EPS, we estimate PKI should trade on a fair forward P/E of ~28.8x, leading to price objectives between $155–$228:
- [28.8 x $5.40 = $155.90]; [28.8x $7.90 = $228.08].
The current S&P 500 forward P/E estimate for December is 18.18x. I therefore expect PKI to create shareholder value if the stock trades at or above this level. Further still, the $155 target corroborates with upside price targets obtained earlier, giving confidence on the accuracy of that number.
Exhibit 7.
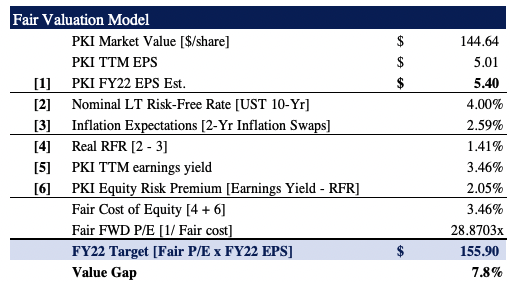
Note: Fair forward price-earnings multiple calculated as 1/fair cost of equity. This is known as the ‘steady state’ P/E. For more and literature see: [M. Mauboussin, D. Callahan, (2014): What Does a Price-Earnings Multiple Mean?; An Analytical Bridge between P/Es and Solid Economics, Credit Suisse Global Financial Strategies, January 29 2014]. The FY22 price target is calculated by multiplying the fair forward P/E by the FY22 EPS estimate. (Data: HB Insights Estimates)
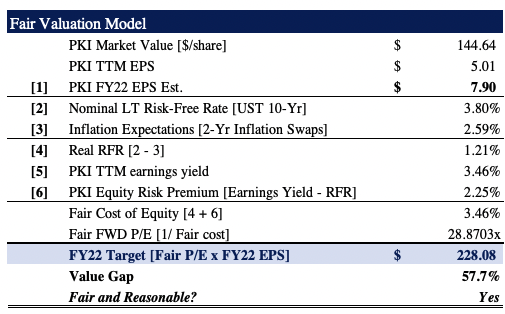
Note: As above. (Data: HB Insights Estimates)
Appendix 1. PKI forward estimates
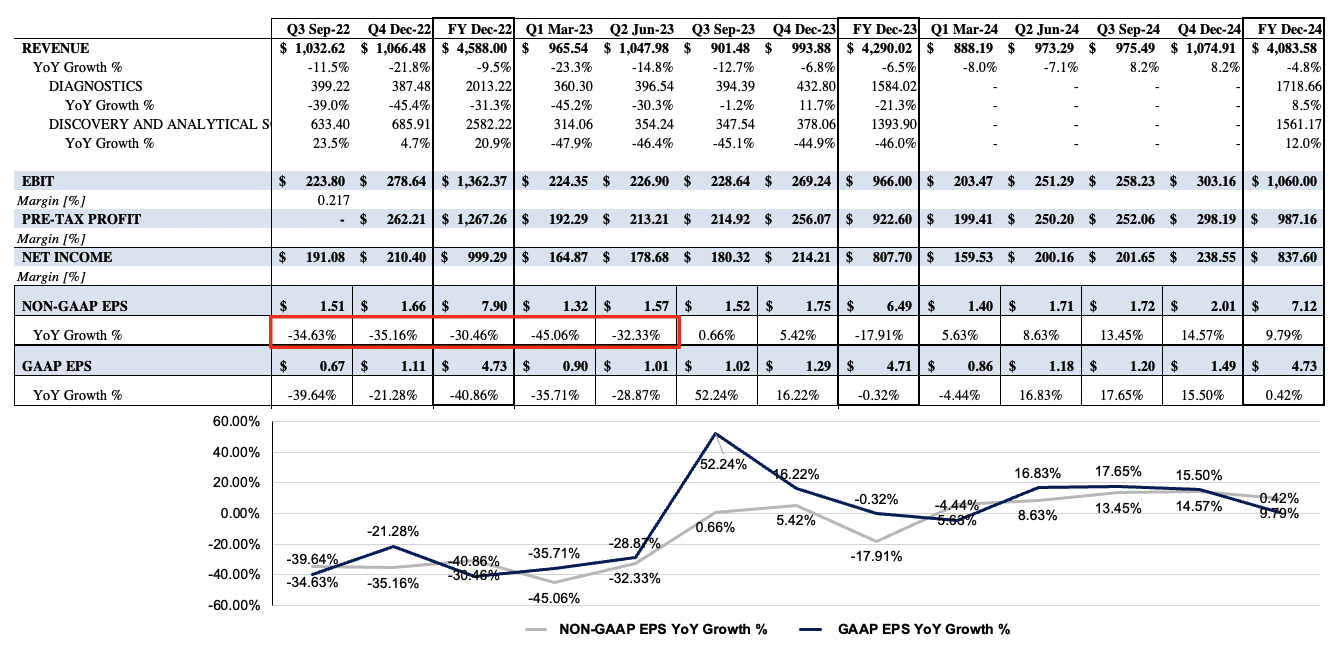
Data: HB Insights Estimates
In short
Net-net, I continue to see PKI as a buy on multiple mid-term growth levers. I’ve discussed several of these now in the last 2 reports on the company. Shares have upside potential to $155, with confidence around this estimate from 3 inputs. Should it punch through this mark I’d be looking to potentially add further to the name. Rate buy.
Be the first to comment