

bjdlzx
Written by Nick Ackerman, co-produced by Stanford Chemist. This article was originally published to members of the CEF/ETF Income Laboratory on September 3rd, 2022.
Adams Natural Resources Fund (NYSE:PEO) is a fairly unique energy fund. Many of the closed-end funds that focus on energy/infrastructure will incorporate significant exposure to MLPs and midstream companies. In the case of PEO, they invest with a majority of their exposure in the oil majors. They also have some exposure to the more volatile exploration and production companies.
Another fund that first came to mind that is somewhat similar is BlackRock Energy and Resources (BGR). They share significant overlap in their top allocations, seemingly concentrating on a select few of the highest quality companies. Interestingly, they actually both carry significant weighting to their top holdings. PEO’s top ten come to 67.5% of the fund. BGR’s top ten is a nearly identical concentration at ~68% of the total portfolio.
The funds also share another characteristic; that’s both funds trade at deep discounts. Their distribution policy and investment strategy are where they start to diverge a bit. Beyond just investing in natural resource companies, BGR utilizes a call-writing strategy in its portfolio.
My personal view is I’m more bullish on energy short-term, but longer term, I’m less optimistic. Renewables will become more and more viable every day as costs come down and cut into fossil fuel demand. That isn’t to say that oil and natural gas won’t play a role; I believe they’ll be around forever. Renewable growth outpaces fossil fuels, and that faster pace of growth is set to continue.
The companies that PEO invests in are some of the largest that I believe will survive and have the capability of transitioning along with the industry. That makes them quite appealing as an investment option.
The Basics
- 1-Year Z-score: 0.76
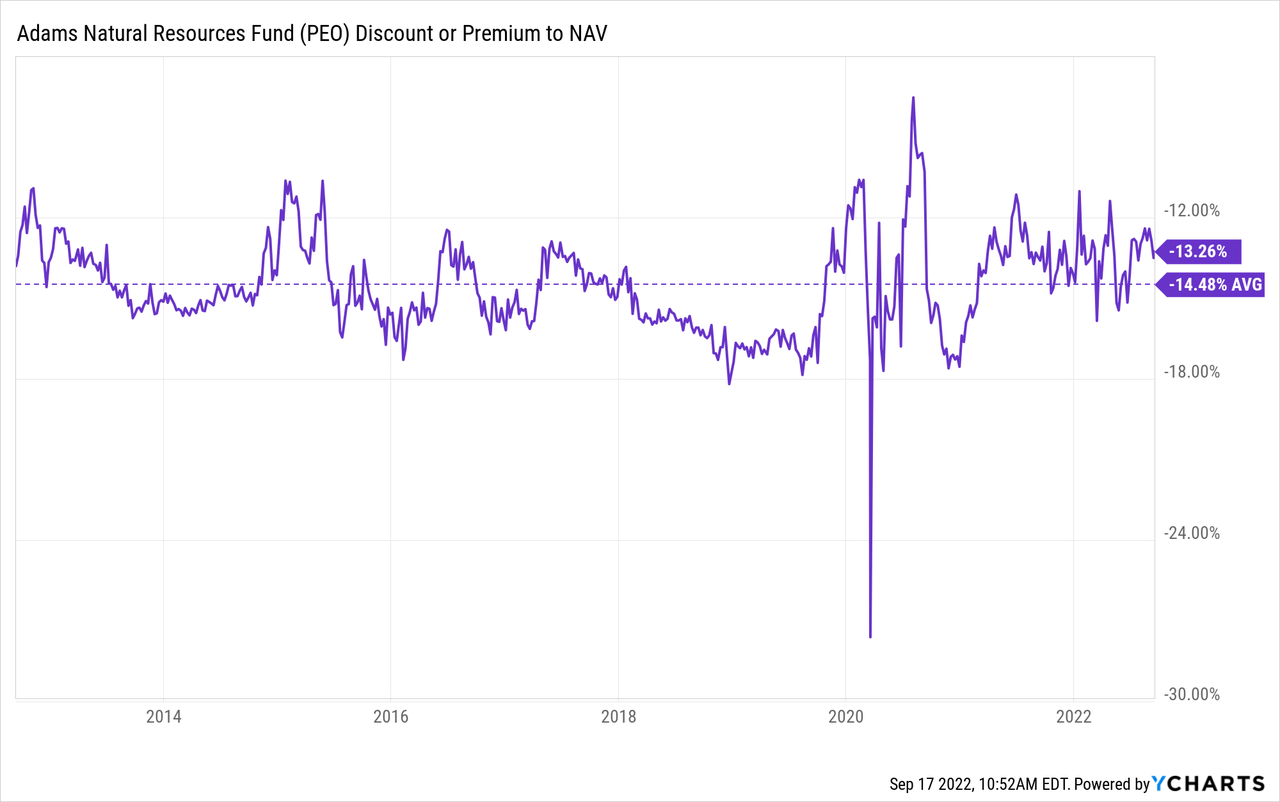
- Discount: -13.26%
- Distribution Yield: 1.86% (regular distribution only)
- Expense Ratio: 0.63%
- Leverage: N/A
- Managed Assets: $603 million
- Structure: Perpetual
PEO “seeks to deliver superior returns over time by capitalizing on the long-term demand for energy and materials. The Fund invests in energy and natural resources stocks and seeks to generate returns that exceed its benchmark as well as consistently distribute dividend income and capital gains to shareholders.”
Similar to the other Adams fund, Adams Diversified Equity Fund (ADX), PEO has an incredibly long history. The inception date goes back to 1929. PEO also went through a name change when ADX had. Formerly, the fund was known as the Petroleum & Resources Corporation.
Another similarity with ADX is that the fund doesn’t utilize any leverage. That can be a positive, especially when your underlying investments are volatile enough.
The fund’s expense ratio is incredibly low for the closed-end fund space – another characteristic that is present in ADX. However, it’s still on the higher end if it was competing against an ETF. In 2021, the average expense ratio for an ETF was 0.49%.
Performance – Competitive To Its Benchmarks
Energy has been an incredibly volatile sector to invest in. They are cyclical stocks and go through booms and busts. A couple of years ago, we saw negative prices for oil, and then we started to see some of the highest prices earlier this year. Now, we are back down significantly.
YCharts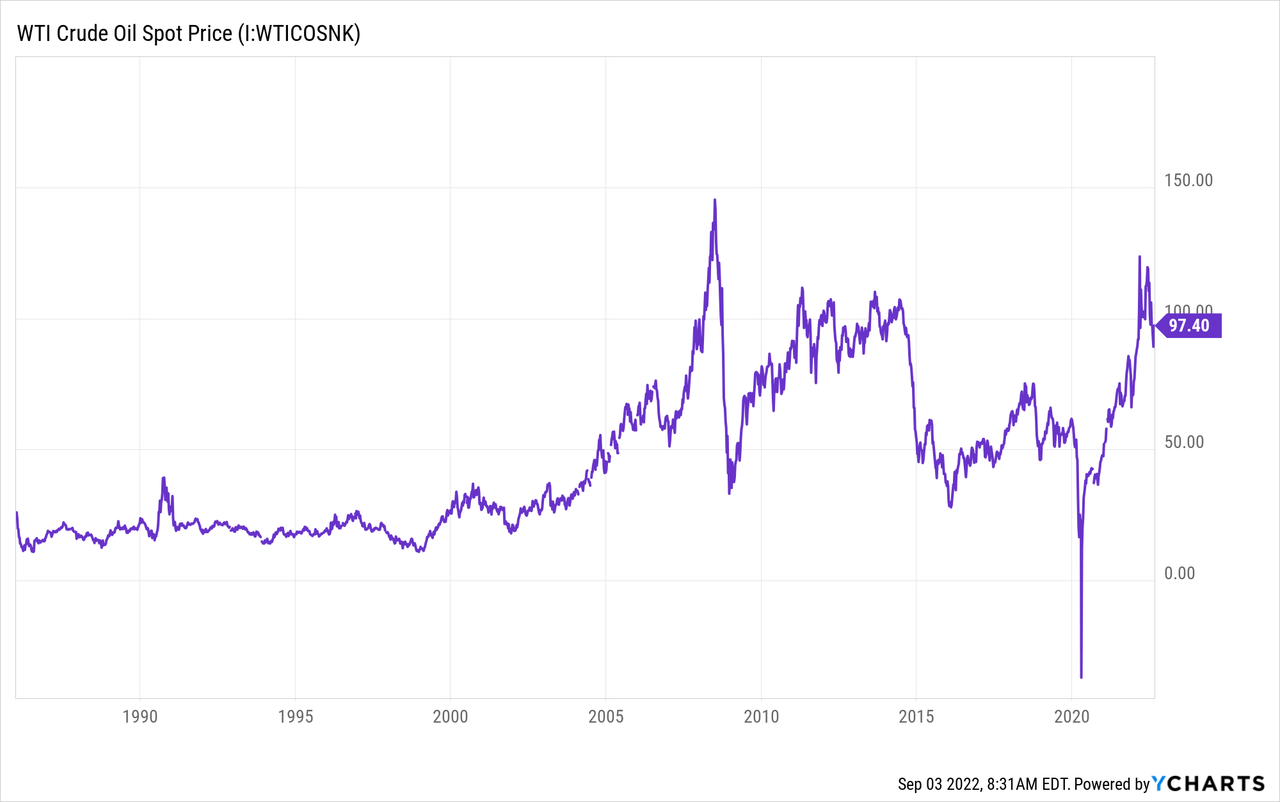
Where the price can go next, nobody knows. But I would suspect it continues to be quite volatile. From 2015 to 2020, there was a lot of pain in the sector. However, it seems to have left the companies better off concentrating on strengthening their balance sheets and rewarding shareholders now that they can.
The longer-term results for PEO reflect this, with the longer-term results rather poor, but more recently, the performance has been looking much better. They use the S&P 500 Energy Sector Index and Materials Sector Index as their benchmarks. We can see both periods where PEO has outperformed its benchmark, meeting its goal of delivering “superior returns.”
PEO Annualized Returns (Adams Funds)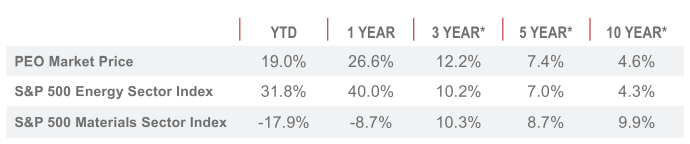
These better results for the sector have seemed to get some attention from investors. PEO trades at a deep discount but still higher than the decade-long average discount. Still, I’d say the fund is still attractively discounted, and discount expansion from this level back to the average wouldn’t be too painful.
I’d be more concerned about the overall energy market already making a massive run. If we enter into anything more than a mild recession, these are the types of stocks that will get hit significantly.
When comparing the results between PEO and BGR, we can see that PEO came out ahead quite significantly over the last decade. This had really picked up after the bottom of 2020. One of the reasons for this is that BGR’s options strategy during a bull market will be a drag on its performance. The position will either be called away, limiting the upside, or the fund will have to close the position, generating losses.
YCharts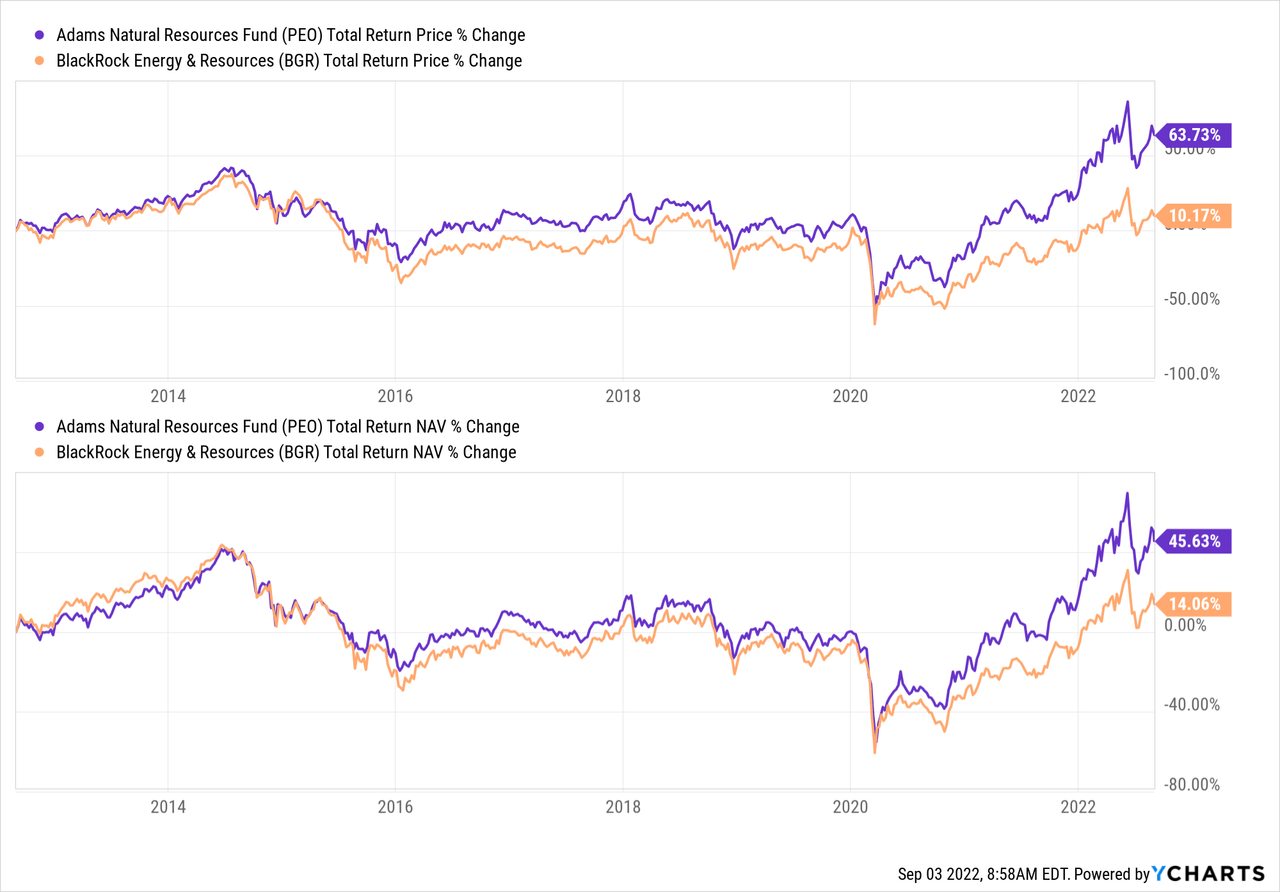
Covered call writing strategies can work best in a flat market. It can provide a bit of a hedge when there are shallow declines.
Distribution – 6% Minimum Policy
Another similarity between PEO and ADX is their 6% minimum distribution policy. These funds pay out a small regular quarterly distribution. A large year-end special then tops it off to achieve that minimum level.
PEO Distribution History (Adams Funds)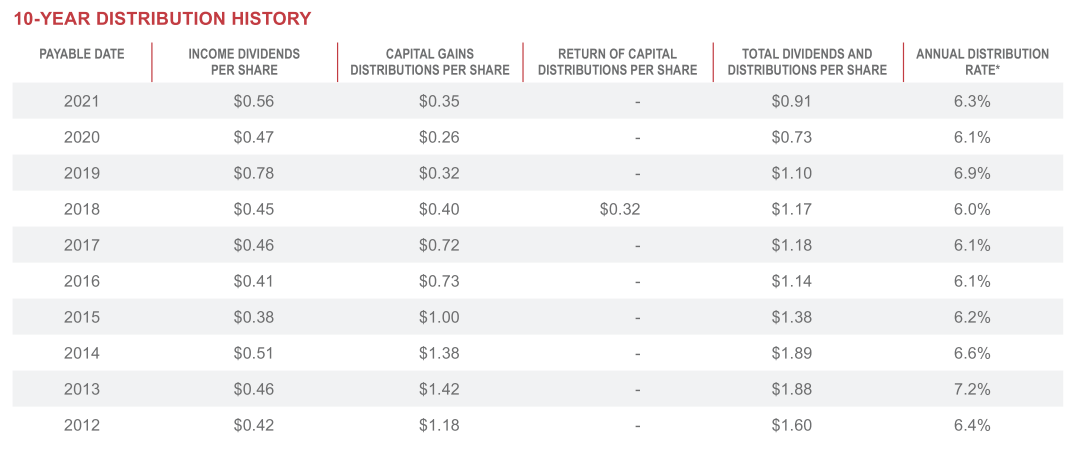
The latest regular distribution works out to $0.10. They’ve paid that going back to 2009. Since they adjust the year-end and pay out a minimal amount throughout the year, it’s pretty easy for them to keep the regular rate stable.
In 2021, they didn’t pay a massive year-end that some investors might have been looking for. The reason for this is that it appears they didn’t realize the majority of their portfolio. Instead, they kept their gains mostly as unrealized appreciation. In that way, they wouldn’t be required to make any sort of significant payment.
PEO Semi-Annual Report (Adams Funds)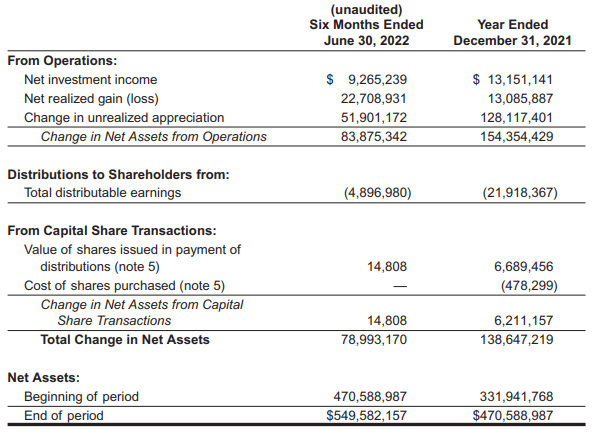
Based on what we see above, they look set to deliver a larger year-end for 2022. That would be the assumption at this point, with the fund realizing more gains at this midway point. Additionally, the fund looks like the net investment income is set to surpass last year’s NII as well.
It’s still a little early to make any guess, though. They release quarterly reports, so when we see Q3, we’ll get a better idea of what the fund might be able to pay out.
For tax purposes, the bulk of the distributions in 2021 was investment income. A sizeable portion was characterized as short-term capital gains, too.
PEO Tax Character 2021 (Adams Funds)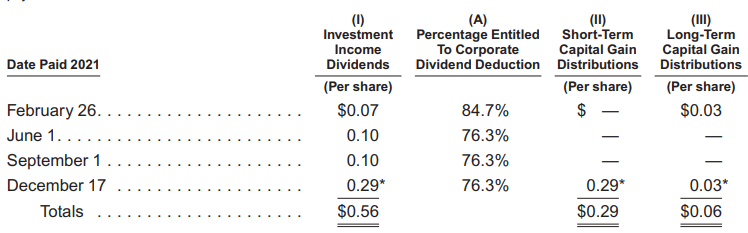
77.5% of the distribution was considered qualified dividend income. That would have helped make it a bit more tax-friendly for investors. The tax character can change drastically from year to year, so it is something that will always have to be monitored.
PEO’s Portfolio
The bulk of PEO’s portfolio is invested in integrated oil majors, as mentioned above. E&P also makes a sizeable allocation. We are then given some smaller exposure to chemicals, refining and marketing, equipment and services, as well as storage and transportation industries.
PEO Industry Weighting (Adams Funds)
There is a little bit of exposure to every industry. When looking at the integrated oil plays, you are essentially getting exposure to each of these smaller subset industries. Overall, I think it creates a pretty balanced approach to “natural resources” investing.
On the other hand, I think you are running some concentration risk here, which isn’t generally said about a CEF as they are naturally providing exposure to different companies. We made a remark about the top ten above being highly concentrated, but two of the largest positions here are most noteworthy. The top two here make up 35.5% of the entire portfolio.
PEO Top Ten (Adams Funds)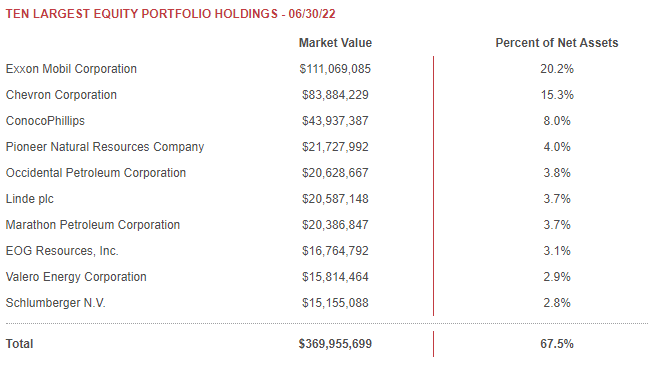
Fortunately, Exxon Mobil (XOM) and Chevron (CVX) are in that major oil player basket. I don’t see these companies going anywhere anytime soon, as they can transition as needed and adapt. Both of them have already been putting some capital to work on renewable and lower carbon projects, even if they aren’t the most boisterous about these projects.
Both of these companies have also been rewarding shareholders through growing dividends for decades now. They made it through negative oil prices without a cut to the dividend.
YCharts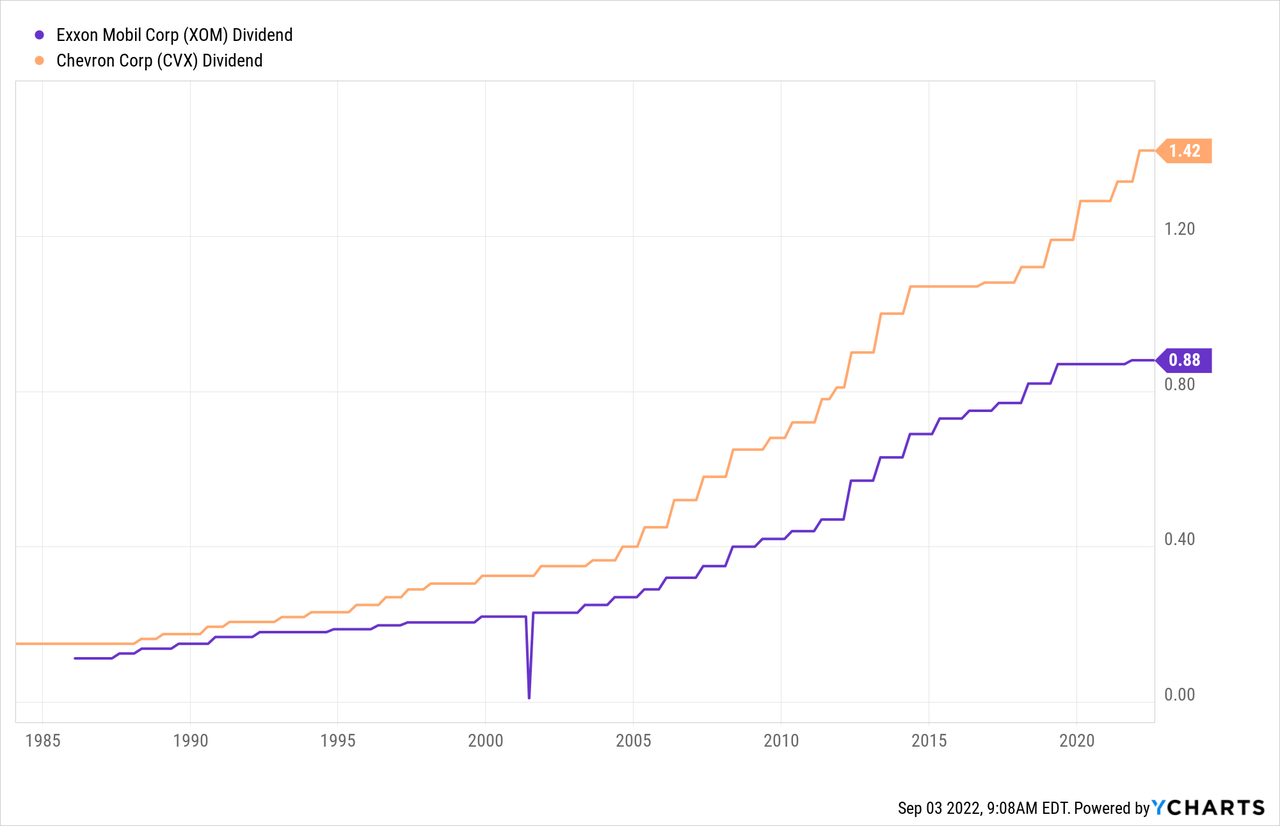
Though some would point out that the dividends were actually paid for by raising debt. If they weren’t paying the dividends, they could have avoided raising debt in the more recent years. Now it would appear they are paying down the debt and heading in the right direction.
YCharts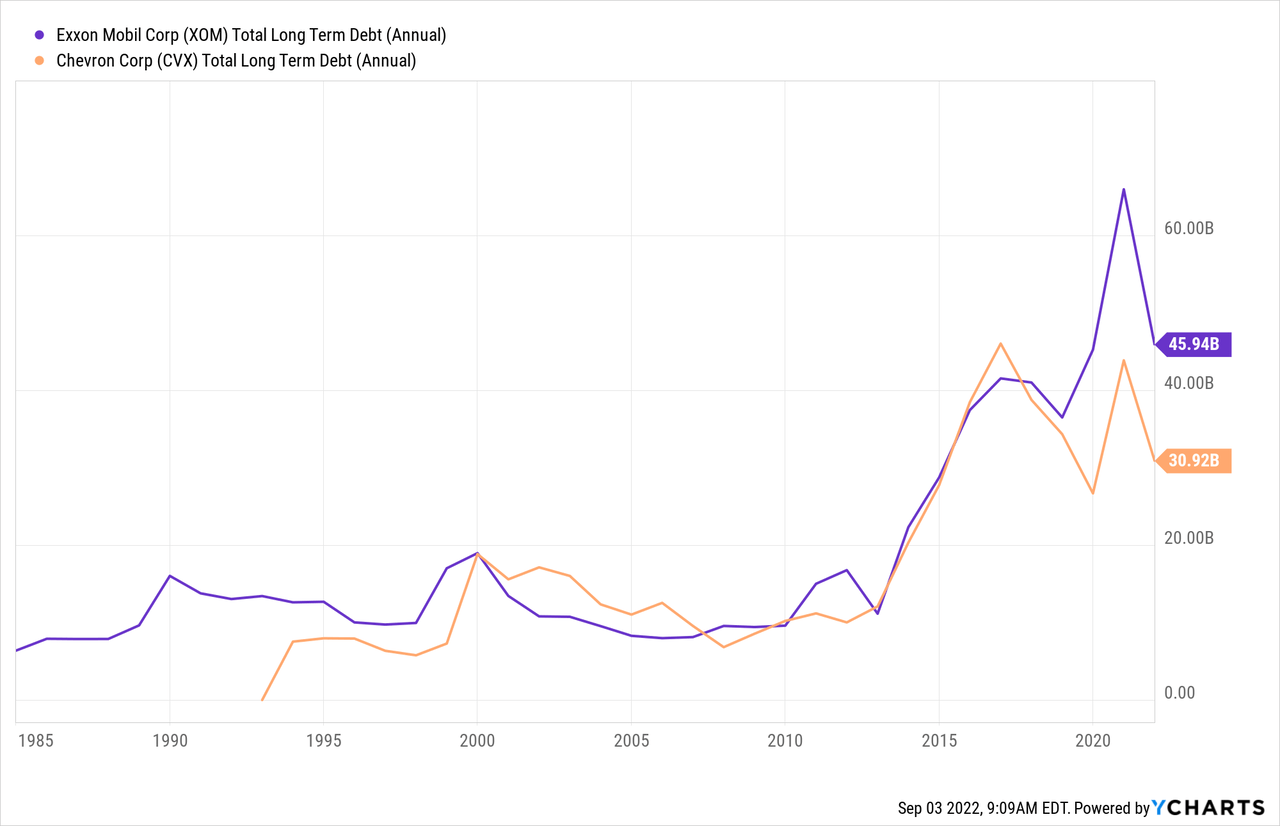
Conclusion
PEO is an interesting name to play the energy space. You get a package of mostly oil majors, which is a change from other CEFs that offer mostly midstream/infrastructure exposure. The distribution policy is likely to appeal to a rather small group of investors, similar to what we’ve seen with ADX. The high concentrations in the top few holdings could make it easier for investors to replicate PEO’s exposure. At the same time, they’ve shown they have been able to put up respectable returns through their management too. For some investors, that could be enough to have this fund be the “set and forget” of their energy exposure.
Be the first to comment