

Seems like this train’s on track to keep providing stable monthly income for a lad. umdash9/iStock Editorial via Getty Images
PIMCO Dynamic Income Fund (NYSE:PDI) is a closed end fund (CEF) focused on generating income first and capital appreciation second. At the end of last year, two other PIMCO funds which traded as PCI and PKO were merged into PDI, which is how some may have come to this fund. Here’s an overview from the fund’s website:
The fund normally invests worldwide in a portfolio of debt obligations and other income-producing securities of any type and credit quality, with varying maturities and related derivative instruments. The fund’s investment universe includes mortgage-backed securities, investment grade and high yield corporates, developed and emerging markets corporate and sovereign bonds, other income-producing securities and related derivative instruments.
The fund will normally invest at least 25% of its total assets in privately issued (commonly known as “non-agency”) mortgage-related securities. The Fund may normally invest up to 40% of its total assets in securities of issuers economically tied to emerging market countries. The fund will normally maintain an average portfolio duration of between zero and eight years.
We can see from this that the portfolio universe is quite diverse across different sectors, markets, and security types. It’s managed by Dan Ivascyn, Alfred Murata, and Joshua Anderson. A Morningstar article from August about another PIMCO fund managed by the trio had this to say of them:
Pimco veterans Dan Ivascyn, Alfred Murata, and Joshua Anderson have leveraged the firm’s robust mix of macro research and bottom-up analysis to focus on generating consistent payouts in addition to performance. The latter has been roughly average over the past few years, but the strategy has avoided the worst of the market’s biggest problems.
Fund Basics For Reference
|
1-Year Z-score |
0.41 |
|
Current Premium/Discount |
6.20% |
|
Distribution Yield |
13.52% |
|
Expense Ratio |
2.64% |
|
Leverage |
44.85% |
|
Managed Assets |
$7.943b |
Distribution History
If we put things into the context of the fund’s primary objective (providing stable income) distribution history for the fund has been stellar. Not only have they never missed a monthly distribution since 2012, seven out of the last ten years shareholders received a bonus year-end distribution. These bonus distributions are as a result of management outearning their normal distribution.
Seeking Alpha: PDI All Time Distribution History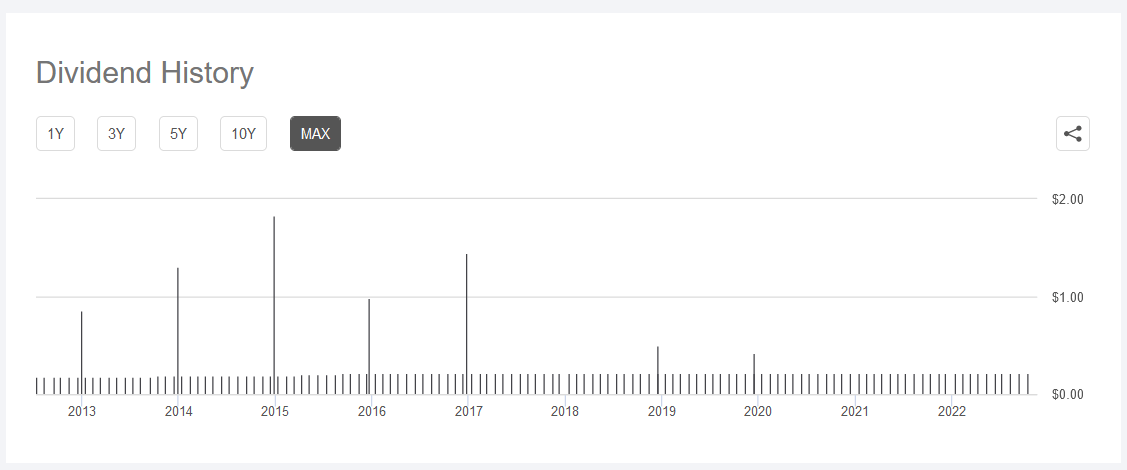
The monthly distribution amount has increased from $0.1770 at inception to where it sits now at $0.2205. Almost all of these distributions have come from income generated by the fund meaning there has been little return of capital. So if we consider the fund’s objective of generating income, they are at least managing to do this and providing shareholders with a stable monthly distribution that has never been cut in ten years.
Overall PDI Performance History
Thus far we’ve seen the fund is generating stable monthly income which it pays out to shareholders. Yet we should consider the performance of the CEF overall as the distribution alone cannot paint the whole picture. PIMCO published an article entitled “Measuring closed‑end fund performance: Net Asset Value (NAV) versus Market Price” which outlines their opinion about how to best measure performance of CEFs overall. Here’s a piece of what they had to say with emphasis added:
There are divergences of opinion on how best to evaluate closed-end fund performance. Performance may be measured as a percentage change in the market price or the NAV, including or excluding distributions. PIMCO believes a CEF’s total return on net asset value, including fund distributions, is one of the most important indicators of a portfolio manager’s ability to add value.
A competitive yield or distribution rate can have a positive impact on a closed-end fund demand and, thus, may favorably influence a fund’s market price. Steady monthly or quarterly dividends often are the key selling point for CEFs. However, it is critical to look at distributions in the context of a fund’s earning profile, as the board of a fund may change distributions from time to time depending on how the fund’s earnings profile changes.
If we take total return on net asset value as the preferred measurement of success for PDI, we can review their performance from data provided in their filings. Here’s a table of PDI’s performance:
Company Filings: PDI’s Certified Shareholder Report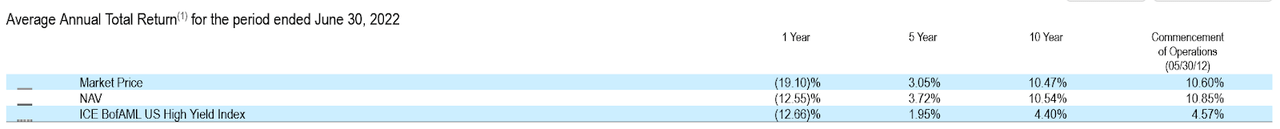
From this, we can see that average annual total return since inception has been 10.85% if measured against NAV. Those are good results over the long term. The piece that is worrying is the 5-year average annual returns coming in at just 3.72%. That’s 66% lower than their long-term average and may suggest some challenges.
Let’s take a closer look at their portfolio to investigate further.
PIMCO Dynamic Income Fund Portfolio Review
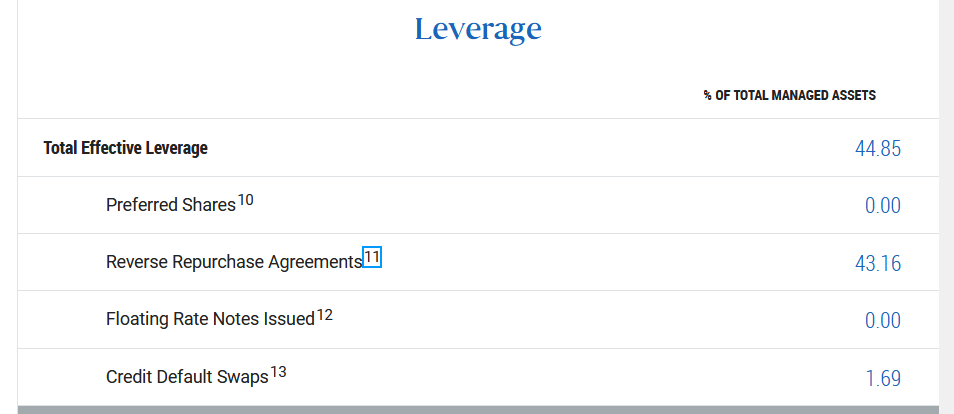
The first thing I note about the portfolio is that total effective leverage is 44.85% which is predominantly through reverse repurchase agreements.
Also known as reverse repos (RRP), reverse repurchase agreements are contracts where the fund sells a security to a buyer with a commitment to repurchase that security back in the future at a higher price. These are recently very popular short-term credit devices which an article from the Brookings Institution highlighted see daily average trading volume of $2-4 trillion.
The fund itemizes each of their RRPs in their filings which in total have a value of $4.083 billion as of 6/30/22. There are dozens of these agreements with multiple different counterparties, yet most of these have maturities before October 2022. What this means is that it’s likely their leverage details will look notably different next time they report on them as they will need to refinance. And with interest rates rising that means the fund will likely be refinancing at higher rates.
A review of their itemized list shows most RRPs have a borrow rate below 2%. If we look at the Fed’s reverse repo operations we can see that as of 10/24/2022 the borrow rate was 3.05%.
According to data on the fund’s site, the total value of leverage has come down from $4.083b to $3.562b as of 9/30/22. This is a positive sign though we should note the CEF must maintain a minimum 200% asset coverage ratio on this debt. The current ratio is 210.26%. If the ratio goes below this then the fund may need to sell off assets to pay down these debts directly.
So the leverage is something that I would be concerned about moving forward.
If we look at the balance sheet more directly, we can see that the grand majority (~90%) of their assets are tied up in investments. What this means is that in order to refinance and work through their maturities they may be forced to sell securities for liquidity.
Company Filings: Assets on Balance Sheet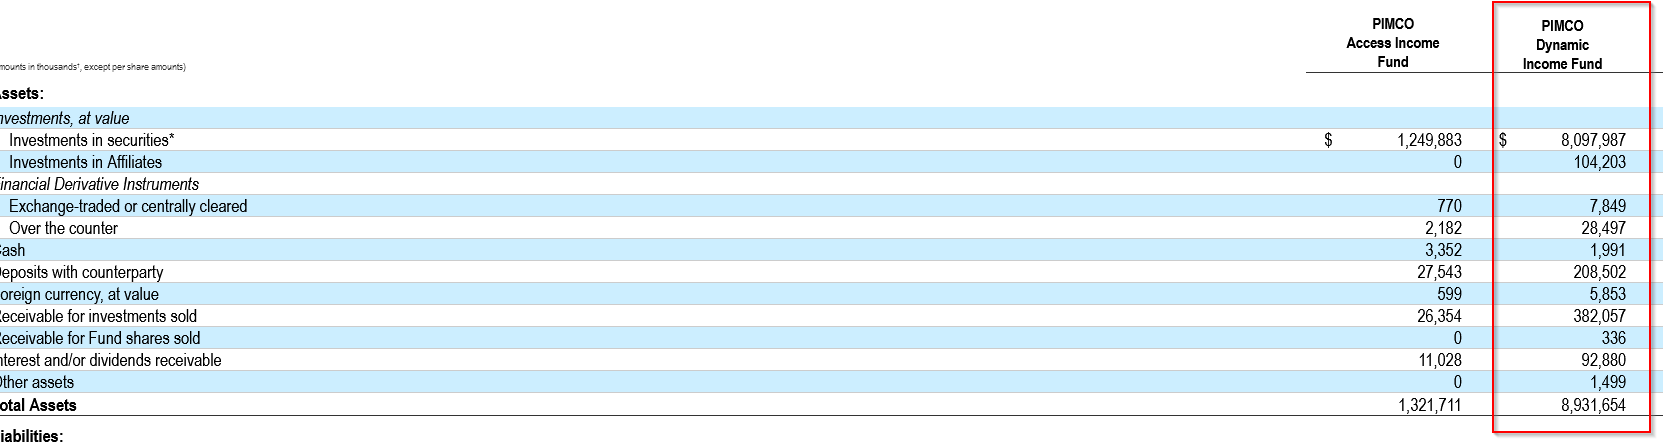
This leads us to our next question: what are they holding that they might sell? According to data from CEF Connect the fund managed 1478 different positions as of 9/30/22. So there’s a lot in there. Let’s look at their sector allocation to start.
Fund Website: Sector Allocation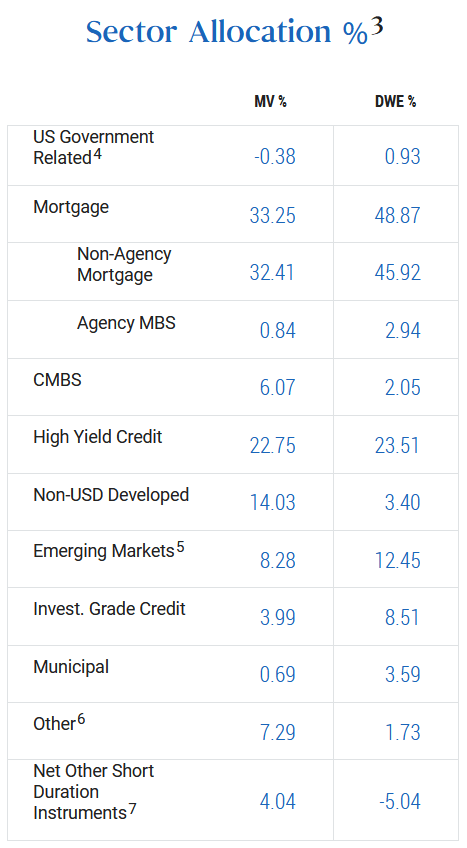
From this, we can see that the majority of the fund is allocated in non-agency mortgages (32.41%). High yield credit investments are second highest (22.75%) with non-USD developed coming in at third (14.03%). Combined these three sectors represent nearly 70% of the portfolio.
With such a high allocation to non-agency mortgages, we can see that the fund’s performance is likely tied to this sector. These securities are considered more risky than agency mortgages backed securities which are backed by the federal government. Essentially, they are mortgage loans which do not conform to agency standards.
Most of their investments here seem to be in various mortgage trusts with long dated duration and low (<3%) fixed rates. With interest rates rising the values of these positions are likely declining. Just take a look at this screenshot of just one page (there are a couple more) of their list of non-agency mortgage positions. Almost anywhere you look the market value is below principal value.
Company Filings: Non-Agency Mortgage Positions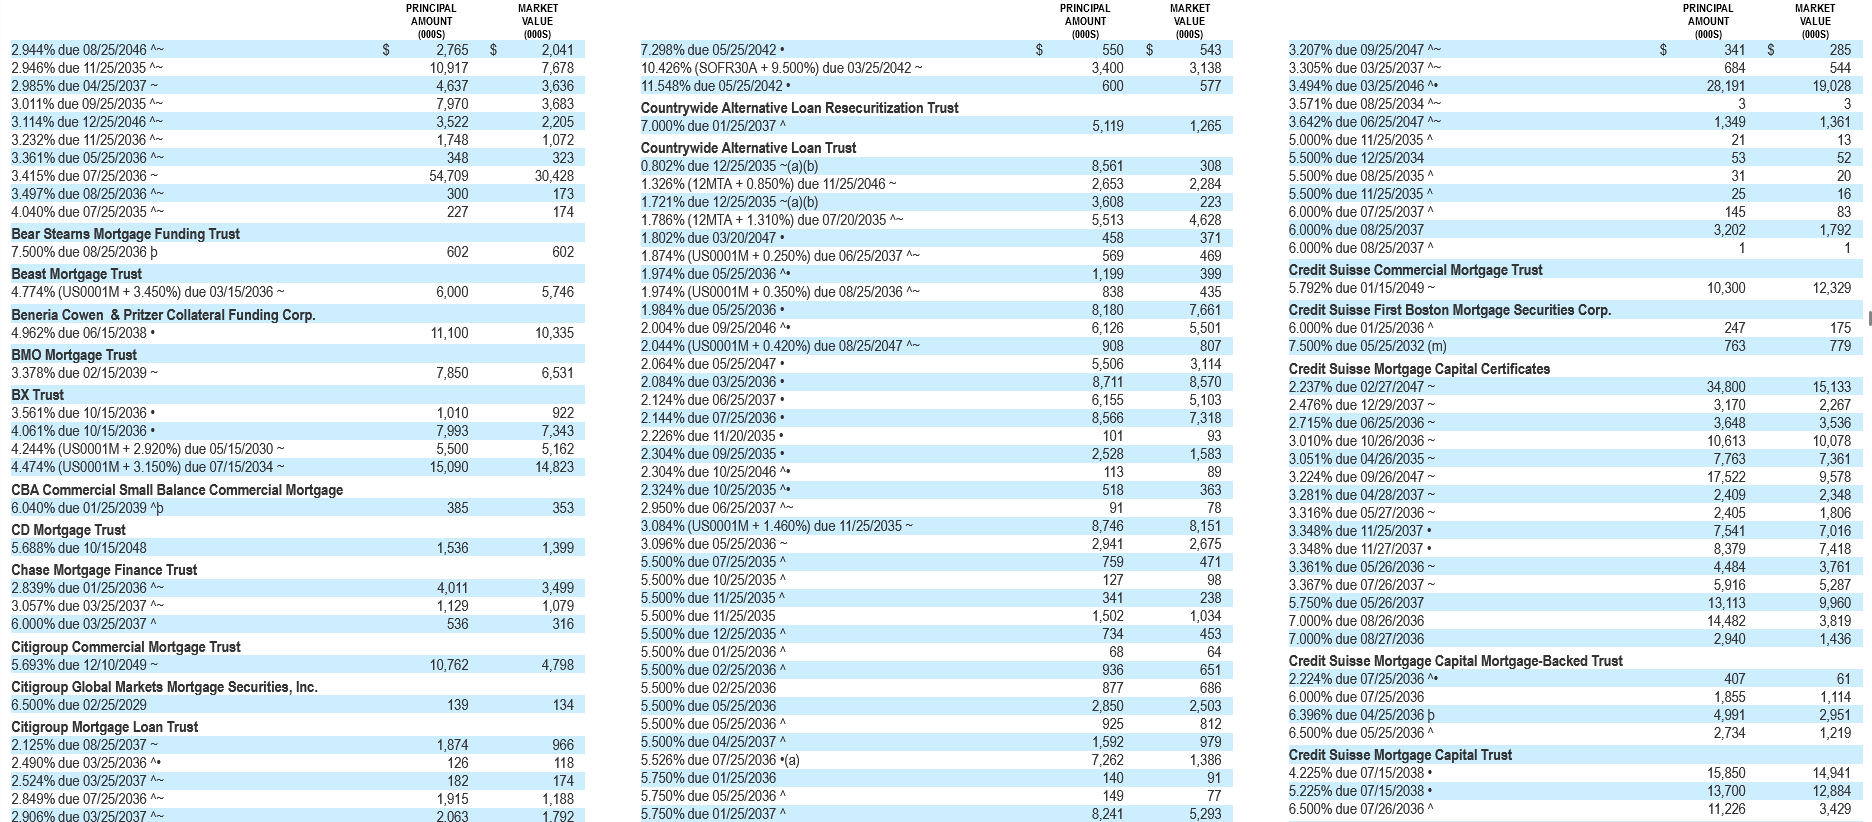
If the fund had to sell positions here to fund their refinancing efforts the result likely is permanent NAV loss.
The high yield credit allocation is largely in corporate notes and weighted towards industrials (~58%). Many of these investments are fixed rate as well so are seeing pressure on their market value as well with rising interest rates.
All of this tracks so far with the reality that the markets have not looked great these last six months. With the refinancing the fund has needed to do in the last couple of months it’s possible they needed to generate liquidity by selling positions at a loss in the market.
Net asset value as of 10/21/22 was reported at $18.45. At the beginning of July 2022, it was $19.76. Market price for PDI currently is $19.60 meaning the fund is trading at a 6.2% premium to NAV. This is an above average premium for the last year, though over the longer term it’s below average.
CEF Connect: Historical PDI Premium/Discount Data 
With current dynamics in the market, it’s hard to see how their portfolio will not continue to see some declining values. Interest rates will hit them both on the non-agency mortgage and corporate bond sides as these seem to be predominantly at fixed rates.
From what I’ve gathered the portfolio seems at risk of continued pressure in terms of rising rates. With their preferred debt vehicle being reverse repos, it means that the short-duration nature of these will make the impact more immediate on the fund. While a negative in the near-term, whenever rates turn back the other way the fund will see this immediacy as a benefit.
With the fund’s balance sheet tied up in securities the process of refinancing may cause permanent loss to NAV as the fund may be forced to sell positions trading at a loss due to current conditions.
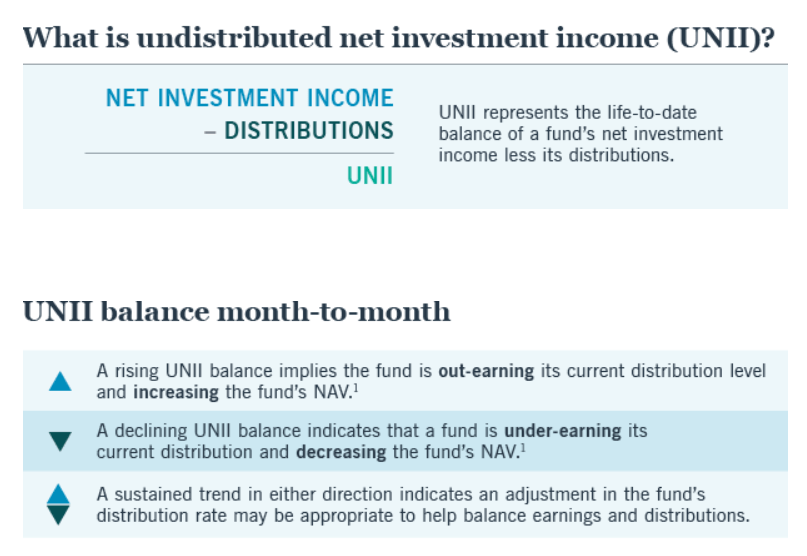
Undistributed Net Investment Income
As noted earlier the fund has seen in many years a bonus distribution. We’d be remiss if we didn’t investigate the possibility of this happening again. One way we can review this is by looking at the fund’s reported undistributed net investment income or UNII. For those that are unfamiliar with UNII, here’s a graphic from Nuveen which helps to contextualize
As of 9/30/22, PDI reported an estimated UNII per share of $1.01 which is up from the August number of $0.940. Ultimately this is a good thing in reflection to the leverage issue we were noting above as it indicates the fund has been out earning its distribution this year which should help give liquidity.
It may also indicate that a year-end distribution may be in store for shareholders. Compared to all of PIMCO’s funds (~20 funds), the average UNII is just $0.1877. The reason here is that funds are required to pay out 90% of net investment income. If we use the current UNII of $1.01 we can estimate that they need to pay out a $0.9090 distribution to bring that balance in line.
At current prices of $19.60 that special distribution could provide a 4.6% bonus yield for shareholders.
It’s possible that current market dynamics may eat into UNII a bit before the year’s end but it likely means at the very least the current distribution is not at near term risk. A monthly distribution of $0.2205 annualizes to $2.65 in distributions and implies a 13.52% yield on current prices.
In Conclusion: PDI is a Hold
This PIMCO fund has seen historically good total return performance. The fund has been able to grow NAV over time while also maintaining a stable monthly distribution for over ten years. And in some years shareholders received a bonus distribution given management’s out earning the distribution.
In recent years the fund’s performance has not been as good. And a review of the portfolio shows they use a fair degree of leverage in their strategy which may work against them in the near term. Their two major sector allocations (non-agency mortgages and corporate) are seeing pressure from rising rates and could see increased defaults.
This is balanced by the reality of high UNII at the fund currently which may result in a year-end bonus distribution.
Overall, I’d rate the fund a hold at current levels. With PDI trading at a 6.2% premium to NAV and a macro environment suggesting continued NAV decline over the next six months, I think one might find better opportunities to buy down the line. For those interested in deploying cash in PDI now a dollar cost average approach is never a bad idea.
The breadth of the portfolio and size of the fund overall should help it to weather the next credit cycle. Depending on one’s opinion about rates long term, the fund’s medium-to-long duration holdings may see some market value correction and ultimately full principal return. Time will tell. In the near term though they will likely see continued NAV pressure.
Be the first to comment