

Nuthawut Somsuk
Thesis
The High Income Securities Fund (NYSE:PCF) is a fund-of-funds with a small assets under management (“AUM”) of only $135 mm. The vehicle is organized as a closed-end fund (“CEF”) and reminds us of the Special Opportunities Fund (SPE) through its composition. PCF counts as its largest holdings other CEFs (26%), business development companies (“BDCs”) (17%), preferred stocks (20%), special purpose acquisition companies (“SPACs”) (20%), and money market funds (11%).
The vehicle currently has a targeted distribution policy for 2022, looking at 10% per annum of the $8.75 net asset value for the fund recorded as of the last business day in 2021. That translates into a 11.3% current dividend yield. The distribution is not supported, with a 20% return-of-capital component for the dividend during the current fiscal year. The fund has fairly mediocre analytics and a long term average annual total return closer to 6%. While the fund technically shows de-minimis leverage at 1%, in reality through its holdings, PCF has significant embedded leverage. The underlying CEFs in the portfolio for example have leverage ratios between 20% and 35%.
When comparing PCF to its peer SPE we find that the Special Opportunities Fund significantly outperforms long term with much better 5- and 10-year total returns. As a fund of funds PCF is currently trading at a discount to NAV and we do not expect any narrowing here. PCF has not generated any outsized alpha to warrant a tight discount or a premium to NAV. PCF is a fund-of-funds with good recent performance but mediocre long term one. For investors looking for a fund-of-funds SPE looks like the much better alternative at this stage.
Analytics
AUM: $0.135 billion.
Sharpe Ratio: 0.31 (5Y).
St Deviation: 12.3 (5Y).
Yield: 11.3%.
Expense Ratio: 1.57%.
Premium/Discount to NAV: -5.29%.
Z-Stat: -0.5.
Leverage Ratio: 1%
Risk Factor: Fund of funds (CEFs, BDC, SPACs, Preferred Stock).
Holdings
In its semi-annual report the fund gives a detailed breakdown of its holdings:
Portfolio Composition (Semi-Annual Report)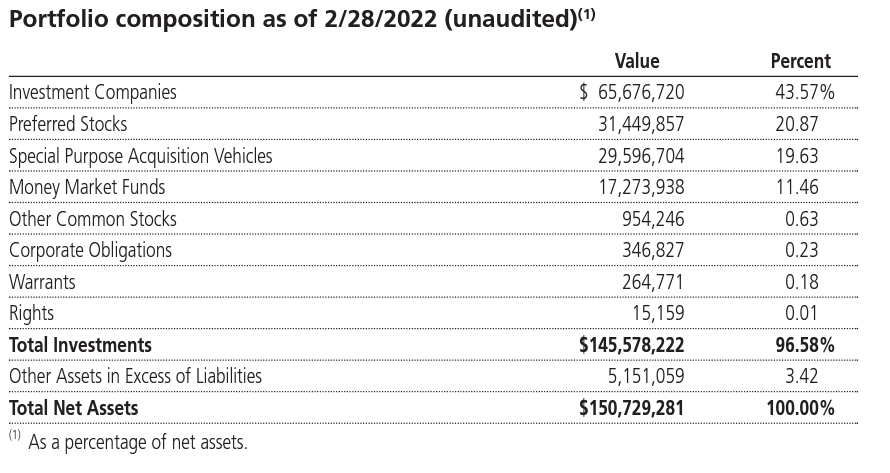
The “Investment Companies” section, which is the largest, contains CEF and BDC holdings. If we drill down into the composition we find the following:
Holdings (Semi-Annual Report)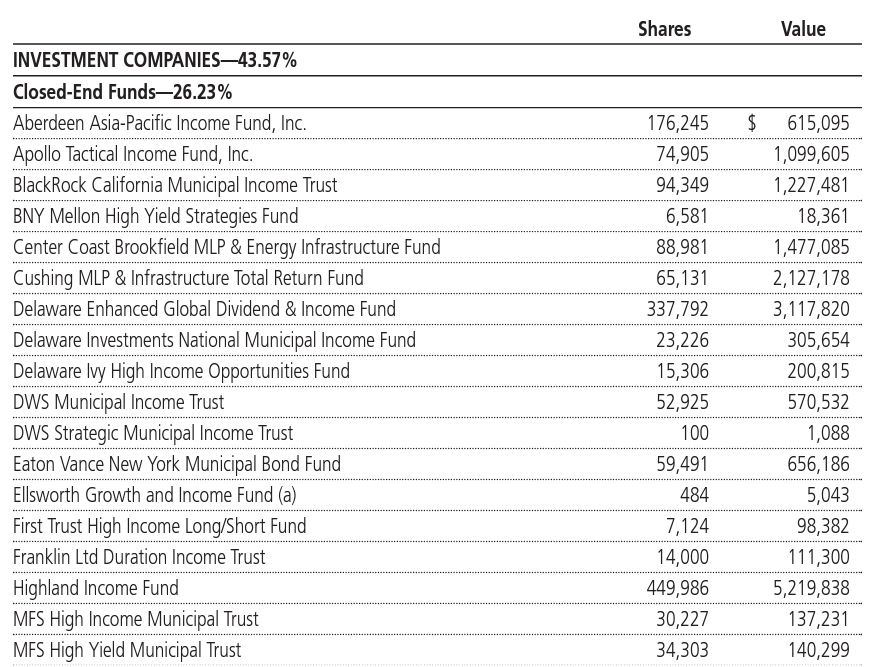
We can see that 26.23% of the CEF is composed of other CEF holdings. When looking at the names in the portfolio we can see a large representation of the Delaware Funds family, which is actually currently being sold to Aberdeen due to the poor performance of its funds and constant large discount to NAV.
BDCs represent roughly 17% of the overall fund:
Holdings (Semi-Annual Report)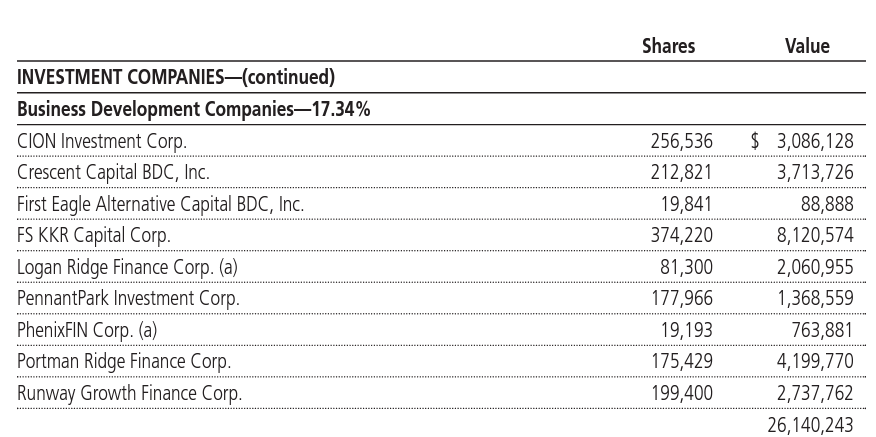
We can observe that the fund holds smaller, more obscure BDCs. For example Logan Ridge (LRFC) is a publicly traded BDC but has a market cap of only $50mm.
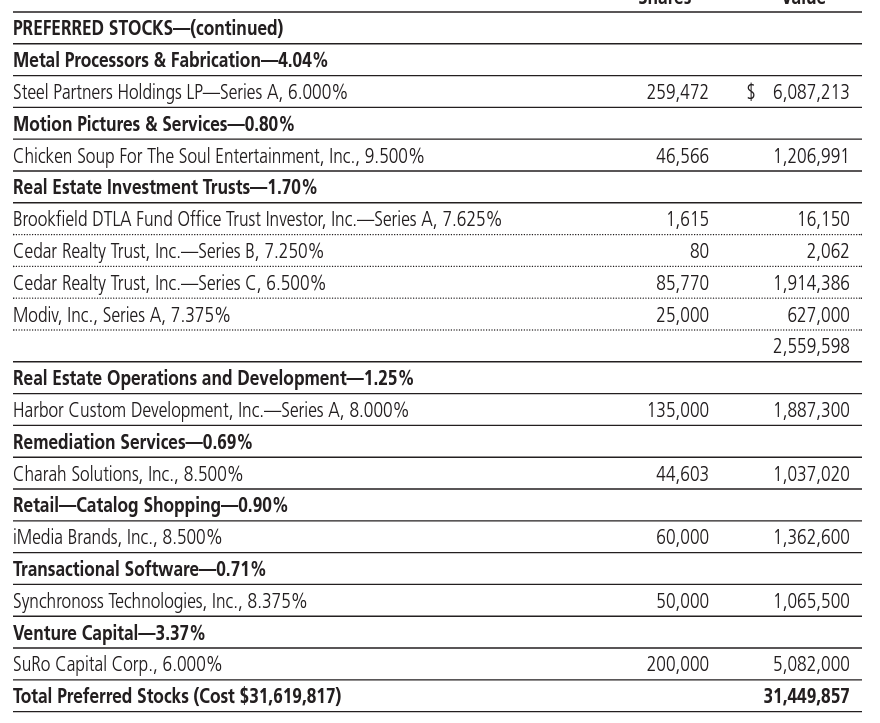
The preferred stock slice is well diversified and fairly granular with some CEF preferred holdings:
Holdings (Semi-Annual report) Slicing (Semi-Annual report)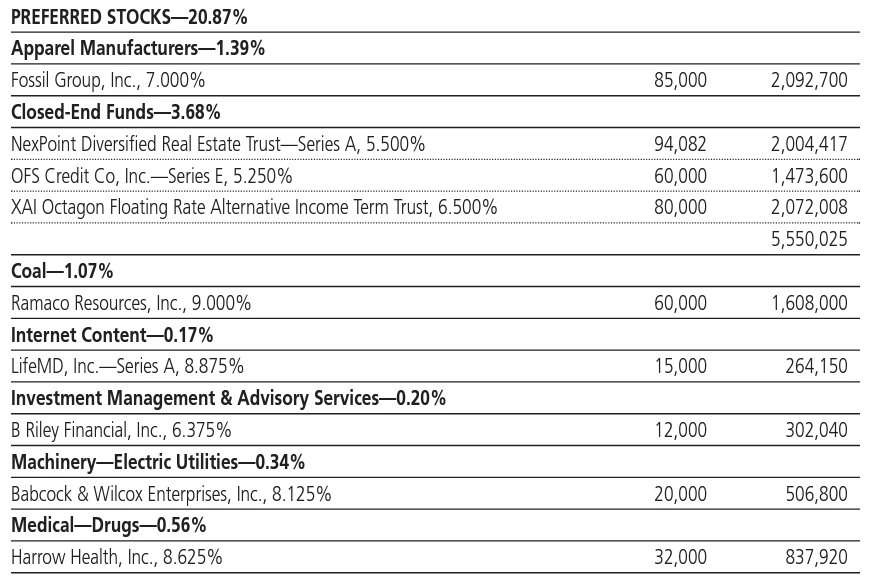
Similarly on the SPAC side the fund exposes good granularity and diversification:
SPAC Holdings (Semi-Annual Report)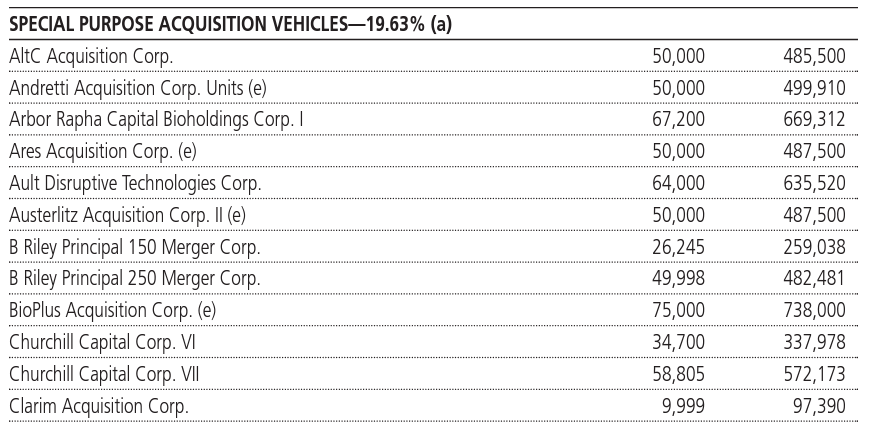
Performance
The fund is down year to date but it slightly outperforms its peer the Special Opportunities Fund:
YTD Performance (Seeking Alpha)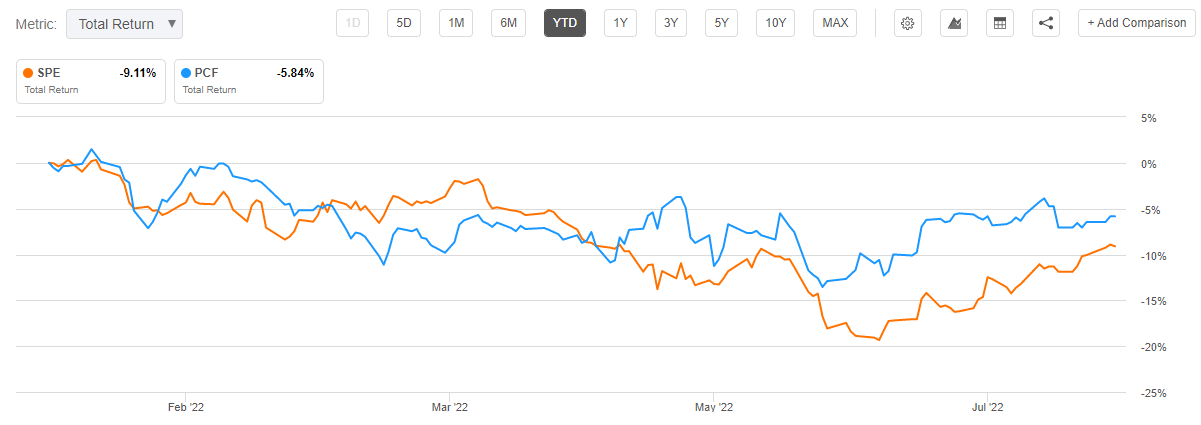
On a 3-year time frame, the two vehicles have similar total return profiles:
3-Year Total Return (Seeking Alpha)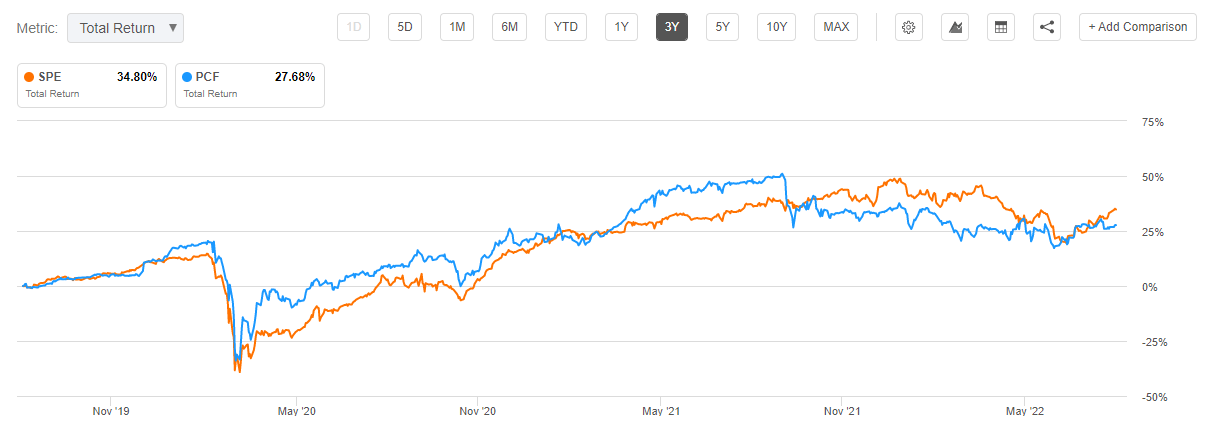
We can see that over the past three years the 2 funds of funds have annual total returns close to 10%, with a very similar return distribution profile.
Long term nonetheless SPE outperforms:
5-Year TR (seeking alpha) 10-Year TR (seeking alpha)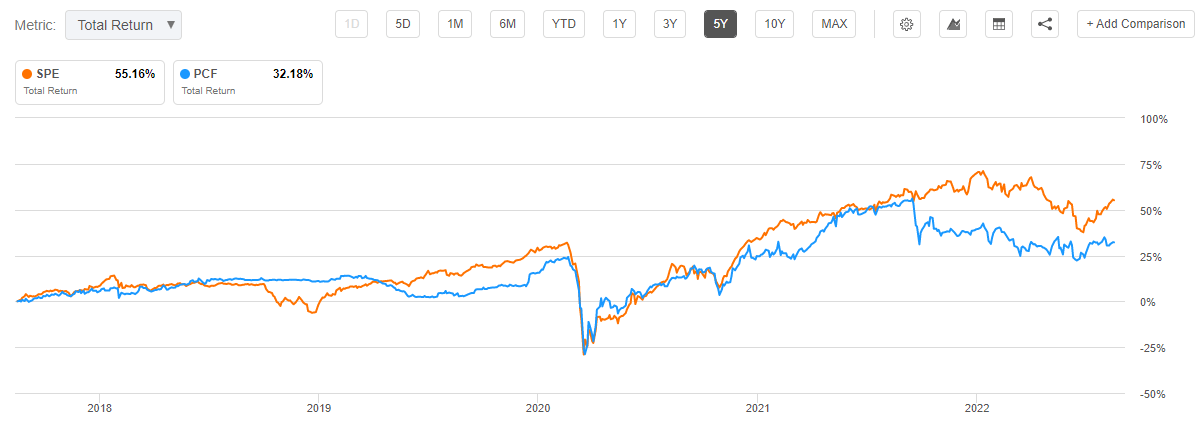
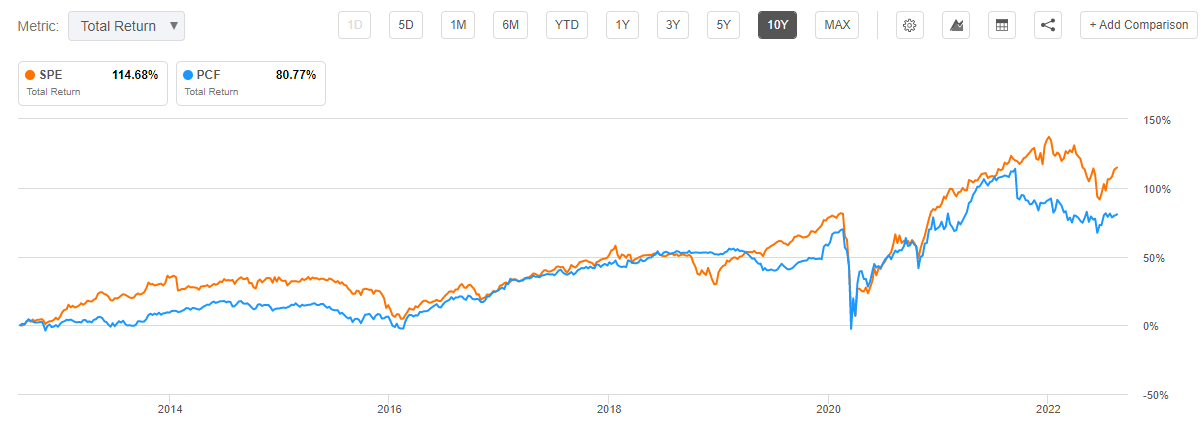
We can see from the 5- and 10-year charts that long term the SPE management team does a much better job of selecting good momentum names with long periods of net and historic outperformance.
Distributions
The fund has a targeted distribution policy for 2022, looking at 10% per annum of the $8.75 net asset value for the fund recorded as of the last business day in 2021:
19a Notice (Fund)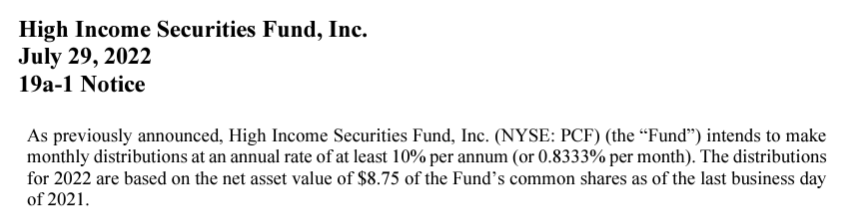
The vehicle achieves its targeted distribution by utilizing a large return of capital percentage:
Distribution Partition (Fund)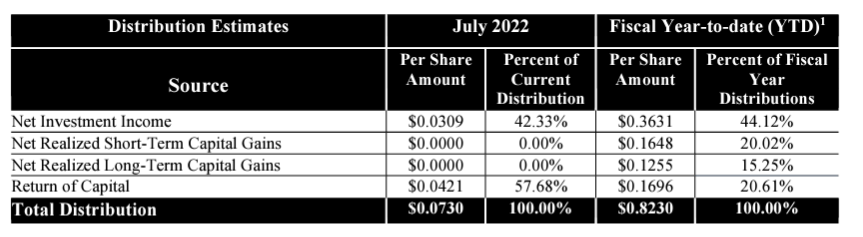
We can see from the above year to date table that the fund currently has a 20% return of capital percentage for the fiscal year to date. We are not big fans of high ROC distributions because they ultimately erode the fund NAV and purely represent a return of principal rather than a true yield.
Premium / Discount to NAV
The fund historically has traded at discounts to net asset value:
Premium/Discount to NAV (Morningstar)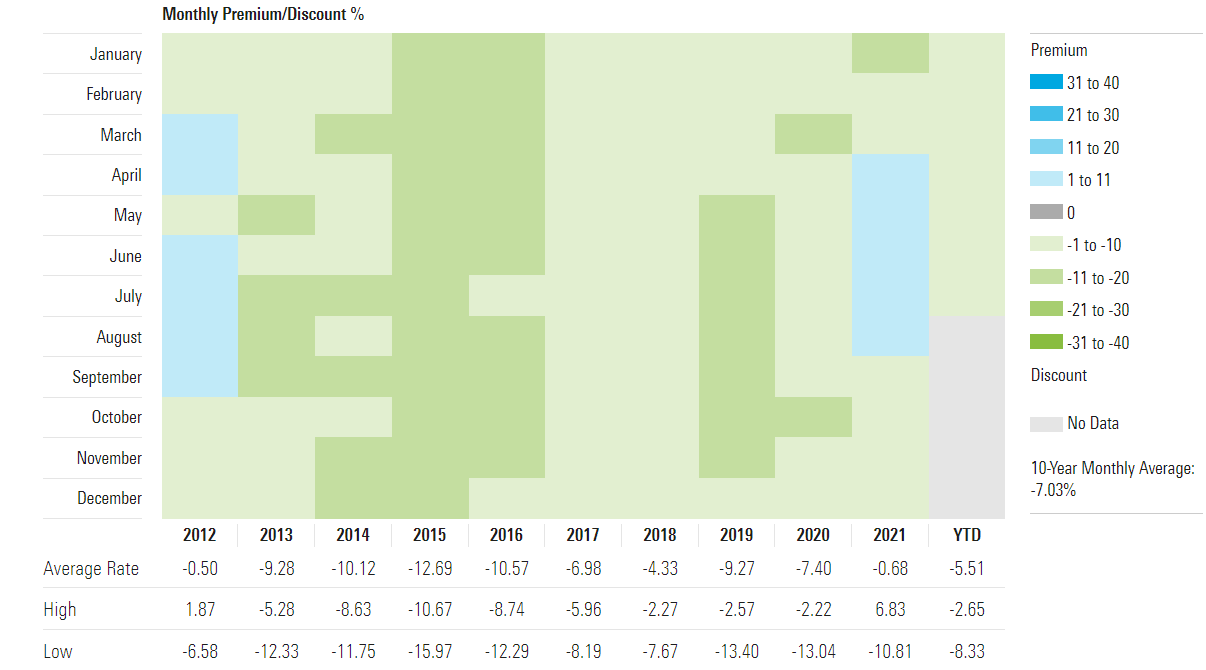
We can see from the above table that outside of 2012 and 2021 this fund has always traded at a discount to net asset value. The current discount is right in the middle of the historic average rate. We do not expect for this discount to narrow and outside periods with unusually low interest rates we expect the CEF to be at a discount. Funds of funds, due to their complex build will always tend to trade at a discount, unless they show substantial alpha generation capabilities versus the broad market.
Conclusion
PCF is a fund-of-funds with a broad base of holdings – other CEFs (26%), BDCs (17%), Preferred Stocks (20%), SPACs (20%) and Money market funds (11%). The vehicle is reminiscent of the Special Opportunities Fund through its composition. While its recent performance is robust, PCF has mediocre long-term annual total returns which clock in closer to 6%. The vehicle is currently trading at a discount to NAV and will continue to do so due to its poor record in generating significant long term alpha. PCF also underperforms SPE on a long term basis. For investors looking for a fund-of-funds SPE looks like the much better alternative at this stage.
Be the first to comment