

Aajan
Investment Thesis
Two months ago, I initiated coverage on the TrueShares Low Volatility Equity Inc ETF (NYSEARCA:DIVZ), a relatively unknown actively-managed fund managed by Austin Graff, a CFA Charterholder with 15 years of experience at Goldman Sachs and PIMCO. Despite my overall positive review, I didn’t rate DIVZ a buy because of its short two-year track record and high 0.65% expense ratio. After following the ETF closely in the last two months, there isn’t enough evidence yet for an improved rating since it’s lagged behind the lower-cost, passive benchmark I had set for it previously. However, the fundamentals are strong, and for dividend or low-volatility investors wanting the benefits of active management, DIVZ is one to keep your eye on.
ETF Overview
Background
For those unfamiliar with my research, I focus mostly on U.S. ETFs, updating dozens of fundamental and performance metrics regularly to identify the best opportunities. Currently, there are 865 ETFs in my database, and DIVZ first came to my attention when I noticed it was among the best-performing low-volatility ETFs over the last year. Its relatively high dividend yield, currently expected above 3%, was a bonus, and a deeper dive was warranted.
I discovered that DIVZ’s portfolio manager prefers to focus on a select group of large-cap companies (25-35) that pay attractive dividends, have reasonable growth expectations, trade at favorable valuations, and provide capital appreciation opportunities. DIVZ adds a low-volatility component, which reminded me of the low-beta anomaly I studied years ago. The linked paper highlights how the least-volatile stocks often produce the highest returns, contrary to most investors’ high-risk, high-reward mindset. Additionally, DIVZ’s portfolio manager:
- considers how securities interact with each other
- takes a bottom-up approach informed by fundamental analysis
- prefers businesses with stable free cash flows
- doesn’t expect inflation to fall much in the near term
- is bullish on the Energy sector, believing we’re in a secular trend
Sector Exposures and Top Holdings
The following table highlights DIVZ’s sector exposures relative to the SPDR S&P 500 ETF (SPY) and the WisdomTree U.S. High Dividend Fund (DHS), which I previously identified as a suitable passive alternative. In short, if you like DIVZ’s strategy but require more of a track record before buying a high-fee ETF, DHS is an excellent choice.
Morningstar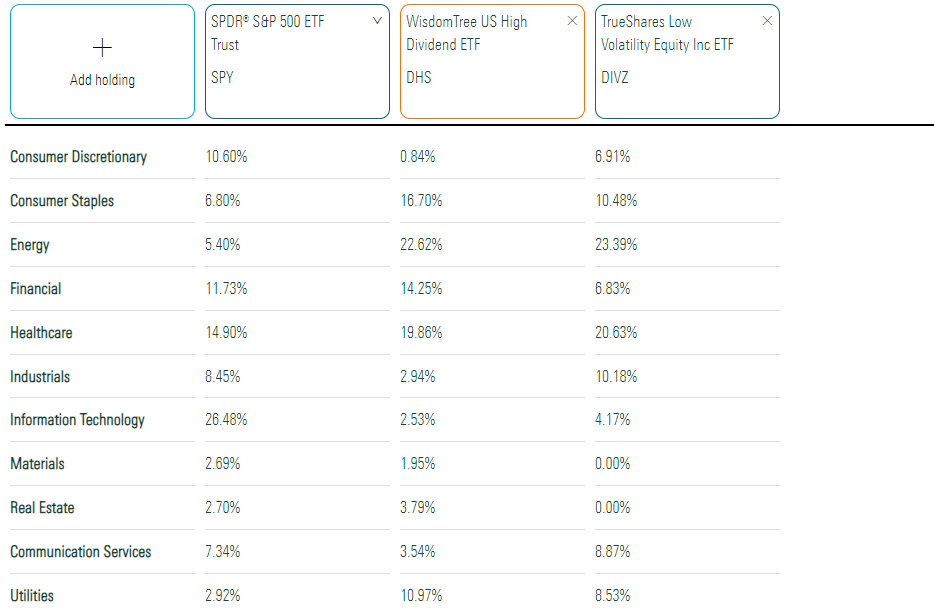
Relative to SPY, DIVZ is overweight Energy (23.39%) and Health Care (20.63%), similar to DHS and more than what I reported in September. However, it has less exposure to Consumer Staples and Financials, two sectors often favored by defensive investors. Exposure to these two sectors has dropped by about 3.50% and 5.00% in the last two months, with Utilities also down 3.50%.
The portfolio has also increased its cash reserves from 1.95% to 5.10%, and DIVZ is more concentrated than before. The top 25 holdings account for 94.81% compared to 88.20% in September, with the top ten listed below.
TrueShares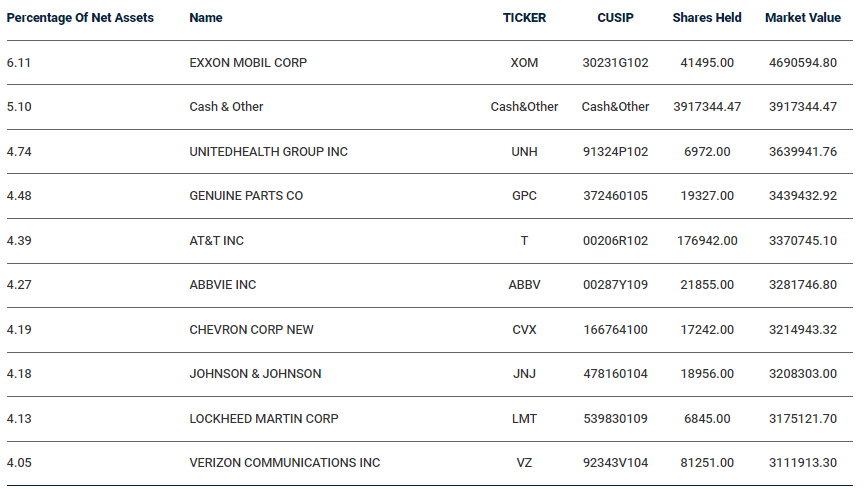
Exxon Mobil (XOM) is the top holding with a 6.11% weighting, followed by UnitedHealth Group (UNH) and Genuine Parts (GPC). Additions compared to September include Medtronic (MDT) and Target (TGT), while deletions include Walgreens Boots Alliance (WBA), Avangrid (AGR), and U.S. Bancorp (USB). Here’s how these five stocks have performed over the last two months:
Seeking Alpha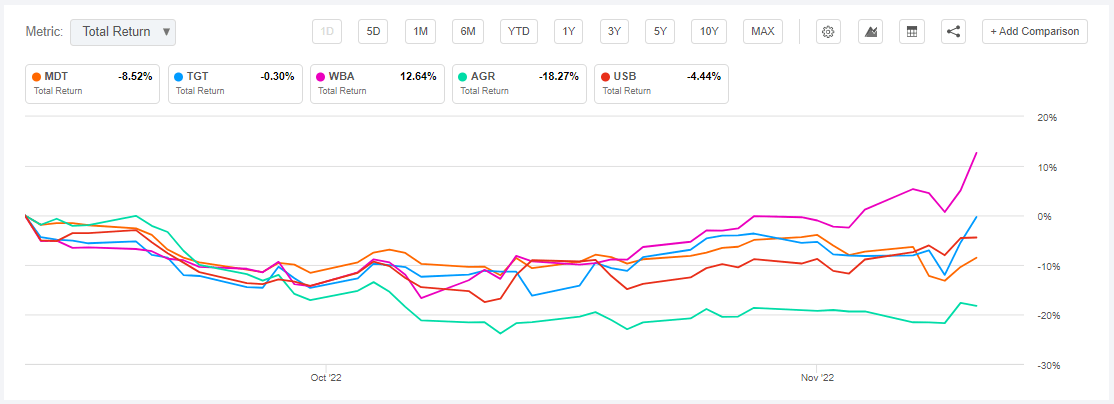
Since the results are mixed, DIVZ is not bottom-feeding by simply buying the cheapest valued stocks. Instead, it looks like more the opposite. WBA had a weak 3.75% earnings beat last quarter. AGR missed by 11.37%, and USB was flat at 0.42%, so these are good reasons to sell. MDT and TGT will report over the next week, so it will be interesting to see how these picks pay off.
Performance Analysis
Compared to 89 other low-volatility or dividend-focused U.S. ETFs, DIVZ was the eighth-best performer in the three months between August and October and the seventh-best over the last year. Here’s a snapshot of the top 25 ETFs in these categories, sorted by one-year returns.
The Sunday Investor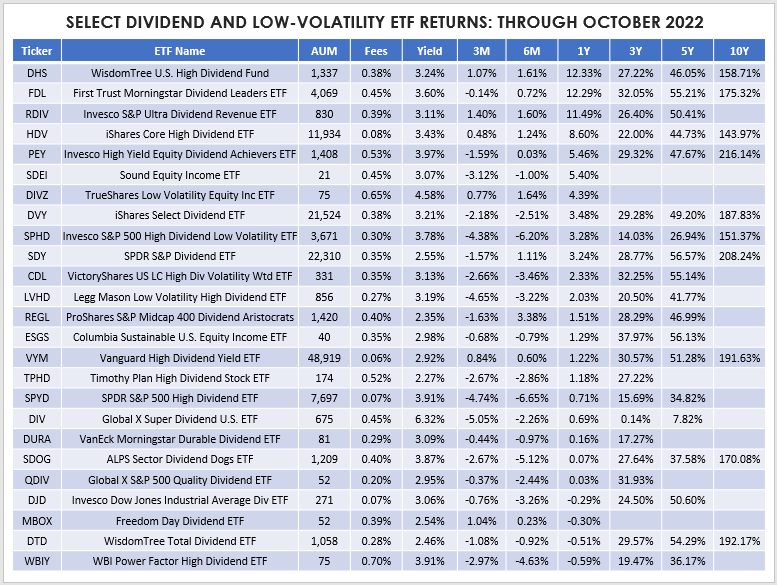
One thing most top performers have in common is high exposure to Energy stocks. DHS, FDL, RDIV, and HDV have 20%+ exposure to the sector, so before we give the strategies too much credit, we should acknowledge this fortunate composition. Current top performers like DHS are up only 158.71% over the last ten years, nearly 100% lower than the 252.16% for the Schwab U.S. Dividend Equity ETF (SCHD).
As a rule of thumb, the more concentrated a portfolio is, the more critical it is to change gears when the time is right. Passive ETFs are at the mercy of their pre-determined rules, but DIVZ may have a better chance of success. Energy is a wildly volatile sector, so I’ll be looking to see if Graff changes gears if energy demand dries up due to a recession. That’s how it often plays out, as the graph below indicates (shaded areas indicate recessions). Furthermore, I’ve yet to meet an analyst who can accurately forecast oil prices for the next month, let alone multiple years.
St. Louis Federal Reserve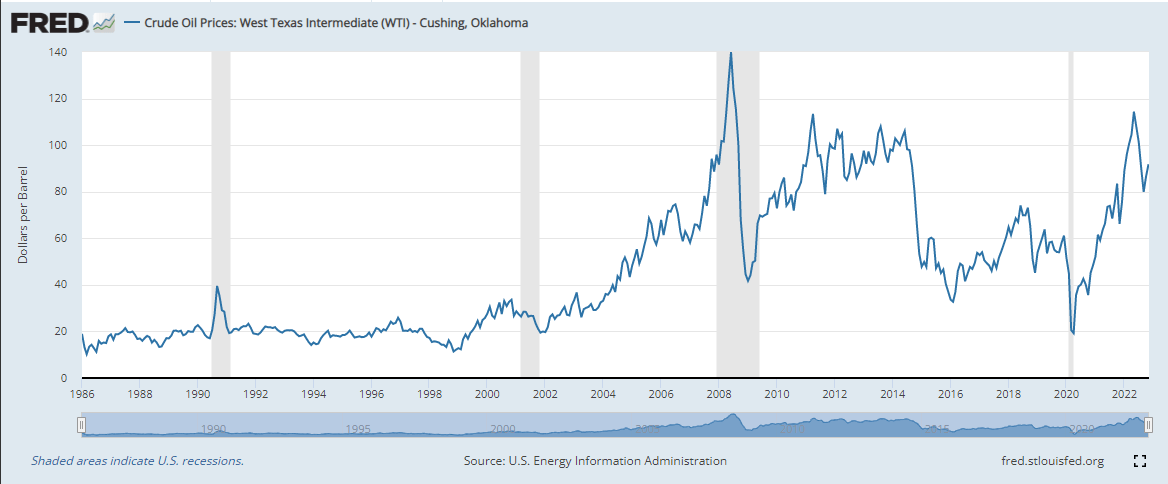
DIVZ has been a top performer since its January 2021 inception, gaining an annualized 13.53% compared to 5.54% for SPY. However, DHS has done even better, up an annualized 17.84% with slightly lower volatility. Its risk-adjusted returns (Sharpe and Sortino Ratio) were far superior.
Portfolio Visualizer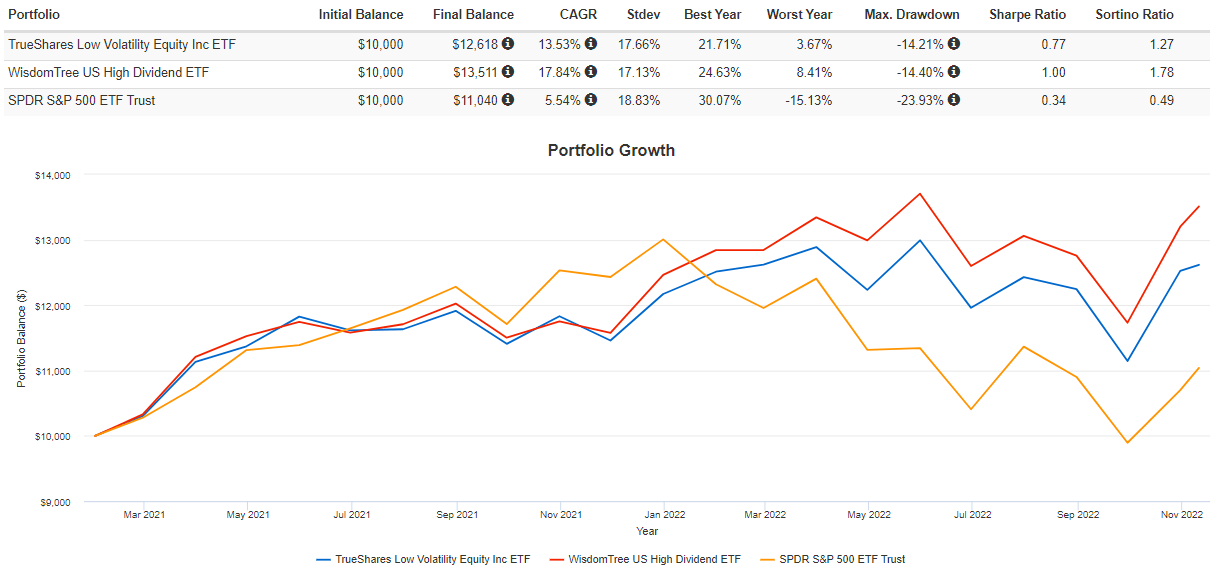
DIVZ has trailed DHS by 3.25% since my September article, and at least part of that underperformance is due to the higher cash weighting. Most equity ETF investors manage their cash allocation independently, so I prefer DIVZ to be fully invested at all times. Remember, DIVZ isn’t a single-solution ETF comprised of multiple asset classes. I believe there’s a mismatch between what the portfolio manager is trying to do (prevent losses) and what investors expect (invest in blue-chip companies with stable free cash flows).
Seeking Alpha
Fundamental Analysis
Company Snapshot
The following table highlights selected fundamental metrics for DIVZ’s top 25 holdings, totaling 94.91% of the portfolio. Also included are summary metrics for DIVZ and DHS in the bottom rows.
The Sunday Investor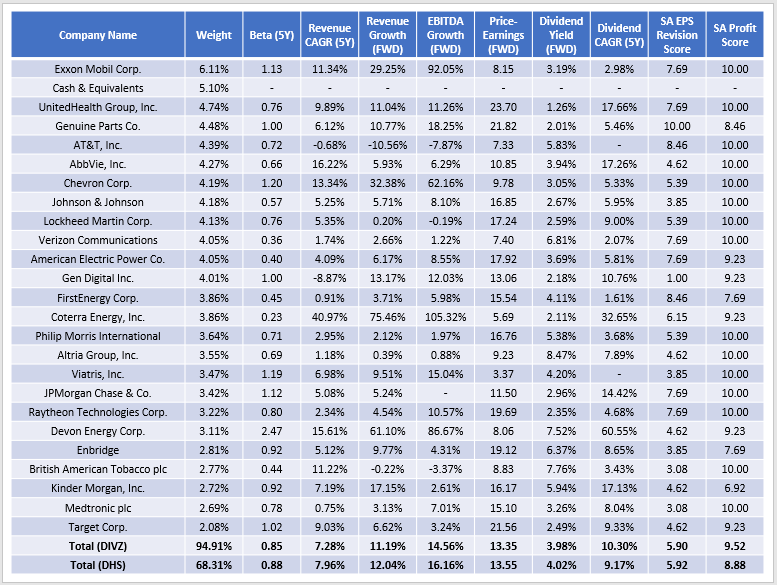
These results present a clear tradeoff between DIVZ and DHS. DIVZ is concentrated among highly profitable companies. Its 9.52 profitability score, which I’ve calculated based on individual Seeking Alpha Factor Grades, is well above DHS’s 8.88 and the 8.08 peer average score. It’s also less volatile, a feature often favored by dividend investors, and has the opportunity to be even less volatile due to the cash weighting.
DIVZ and DHS trade at 13.35x and 13.55x forward earnings, so neither has any advantage on valuation. However, DHS’s growth metrics are better. Estimated sales growth is about a percentage point higher (12.04% vs. 11.19%), and EBITDA growth is 1.60% better (16.16% vs. 14.56%). Most of the Energy names account for this growth, so if oil prices fall, the growth likely won’t materialize. To illustrate, if one were to strip out the Energy holdings from both ETFs, EBITDA growth would fall to about 6%, which isn’t anything to get excited over.
Dividends
Seeking Alpha gives DIVZ a B- Dividend Grade, but since it’s such a new offering, I don’t think it’s reliable.
Seeking Alpha
The trailing dividend yield is listed as 4.58%, but a closer look reveals an annual payment is included in the calculation. The average of the last three quarterly payments is 0.2241, or an annualized 3.06% dividend yield based on Friday’s closing price. This estimate is consistent with what I presented in the above table. DIVZ’s current constituents have a weighted-average 3.98% dividend yield, but investors should also consider the expense ratio (0.65%) and the impact of the 5.10% cash drag. Assuming prices remain relatively stable this quarter and no significant trades occur, a 3.15% yield is a good approximation.
Seeking Alpha
DIVZ’s constituents have grown their dividends by 9.17% per year over the last five years, lower than the 10.30% figure for DHS. Again, it’s Energy stocks like Coterra Energy and Devon Energy that drive most of this growth. In contrast, SCHD offers 11.85% dividend growth and is better diversified, so investors should consider that fund too. You can read more about it in a recent article where I compared it with DGRW, VIG, DGRO, and NOBL.
Investment Recommendation
There’s a lot to like about DIVZ. It’s a focused portfolio of highly-profitable blue-chip stocks that have stable free cash flows, pay relatively high dividends, and trade at reasonable valuations. It’s actively managed, too, so we’ll get the chance to evaluate the portfolio manager’s performance under what’s likely to be stressful market conditions. I plan to provide updates every two or three months to track the portfolio’s changes and performance relative to other dividend and low-volatility ETFs.
Of course, the downside to active management is the fees. DIVZ’s expense ratio is 0.65%, while DHS’s is 0.38%. Other top dividend ETFs like HDV and FDL charge 0.08% and 0.45%, and investors are free to own an ETF like SCHD and supplement it with a low-cost Energy ETF like XLE. I think these alternatives are superior until we know more about how Graff will respond as market conditions change. That is why I’m maintaining my hold rating on DIVZ, and I look forward to checking back in early 2023.
Be the first to comment