

gustavofrazao
Thesis
I published an article yesterday to provide my outlook for the sector to avoid, the industrial sector, in 2H 2022. In this article, I will provide an outlook on the most attractive sector (the energy sector represented by VDE) and one of its leading stocks, Occidental Petroleum (NYSE:OXY).
The background of the outlook has been detailed in my earlier article already, so here I will just directly get to the point:
- We use the dashboard below (and you are welcome to download it here) to monitor all the market sectors. And the energy sector, represented by the Vanguard Energy ETF (NYSEARCA:VDE), is the most attractively valued market sector now. The sector’s valuation discount is attractive both in absolute and relative terms. The sector’s dividend yield is above its historical average substantially (higher than the top quartile indicated by a yield Z-score of 0.86). And relative to the risk-free interest rates, its yield spread is also far above the historical average (as indicated by a yield spread Z-score of -0.49).
- Also, the results from VDE apply to other popular energy sector funds too, such as the Energy Select Sector SPDR (XLE) and also the iShares U.S. Energy ETF (IYE) because of their similar indexing.
- Then we will focus on one of the sector’s leading stocks, OXY. Sometimes, a sector is made attractive (or unattractive) by 1 or 2 stocks that have disproportionate weights. And that is why we like to examine some individual trees after we see the forest. We have written about several of them recently, including Exxon Mobil Corp. (XOM), Chevron Corp. (CVX), and Suncor Energy Inc. (SU). And we feel they are all attractive in terms of valuation, profit outlook, and growth prospects.
- In this article, we will focus on OXY, an individual stock that we have not written much about before. And the conclusion is the same. Here what we see is that OXY is also attractive, actually more attractive than the sector itself.
And now we will dive in and elaborate on the above main points.
Author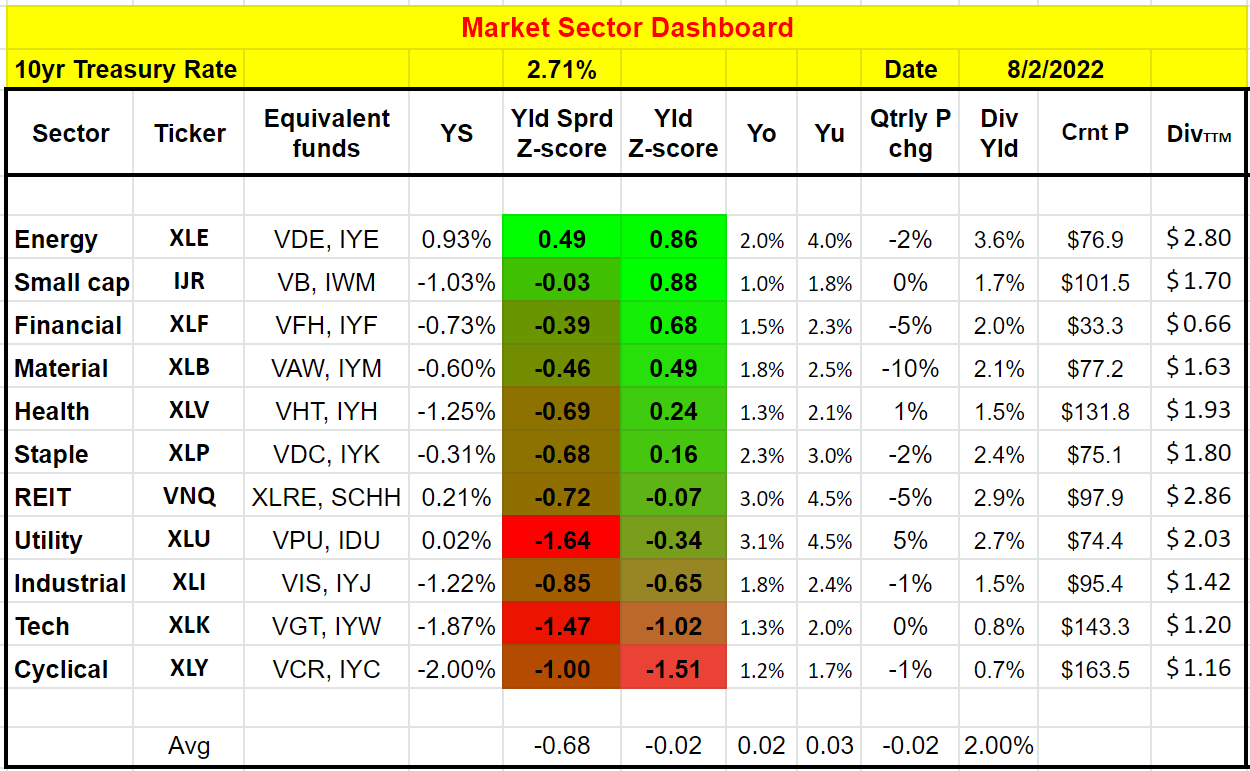
OXY and VDE: Basic information
VDE is one of the most popular funds for the energy sector. It holds a total of 112 stocks in the sector as you can see from the following chart. OXY is the 5th largest holding, representing 3.36% of the total assets.
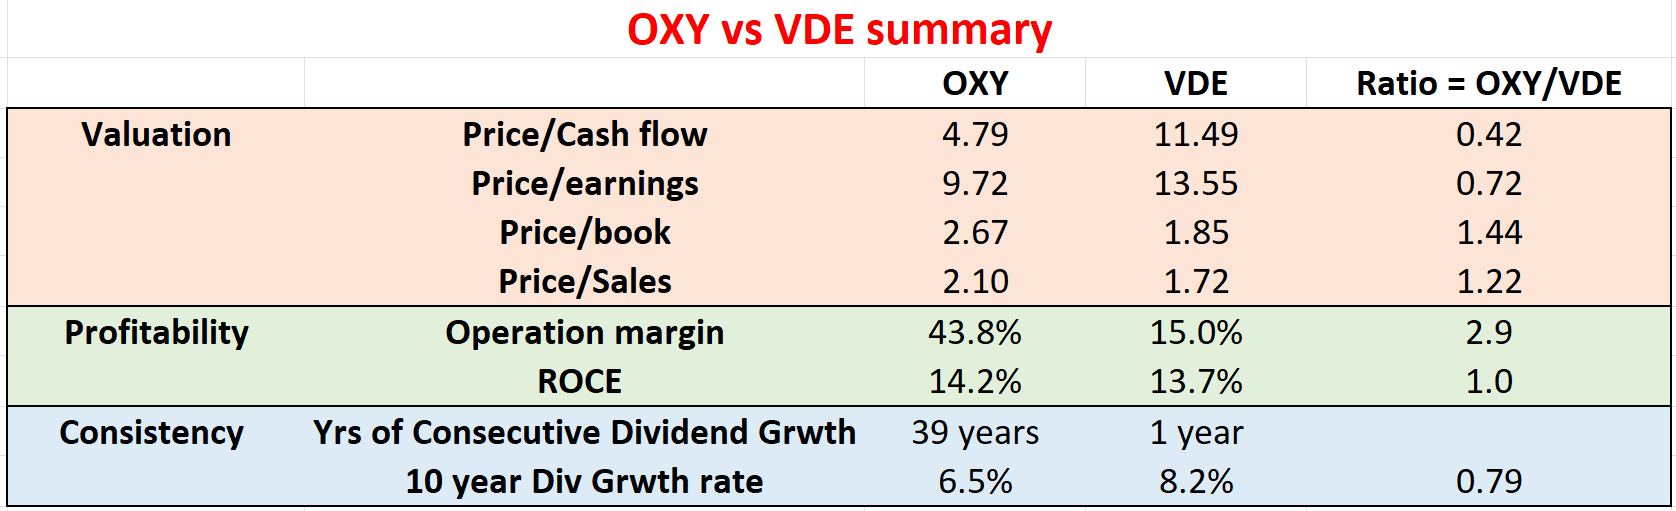
As you can see from the second chart below, both VDE and OXY are very reasonably valued and provide healthy profitability metrics. The sector is valued at a price/cash flow ratio of about 11.5x and a P/E ratio of about 13.5x, substantially below the valuation of other sectors and also the overall market. In terms of profitability, the sector provides an operating margin of 15% and a return on capital employed (“ROCE”) of around 13.7%. Before I proceed any further, note that all the data here are either from Yahoo Finance or Seeking Alpha after the market close price on Aug 2. These numbers might have changed when you read this article.
For, OXY the picture is even more attractive. Its price/cash flow ratio is only 4.8x, more than a 58% discount from the average sector. And its price/earnings ratio is only 9.7x, again a large discount from the sector of 28%. In terms of profitability metrics, its operating margin is far superior to the average sector at 43.8%. And its ROCE of 14.2% is also slightly better than the average sector.
Admittedly, these are not the best profit metrics compared with other sectors or stocks, given the cyclical nature of the energy business. But they are sufficiently healthy. Moreover, as we will see next, there are some strong catalysts to further strengthen their profitability.
Seeking Alpha Author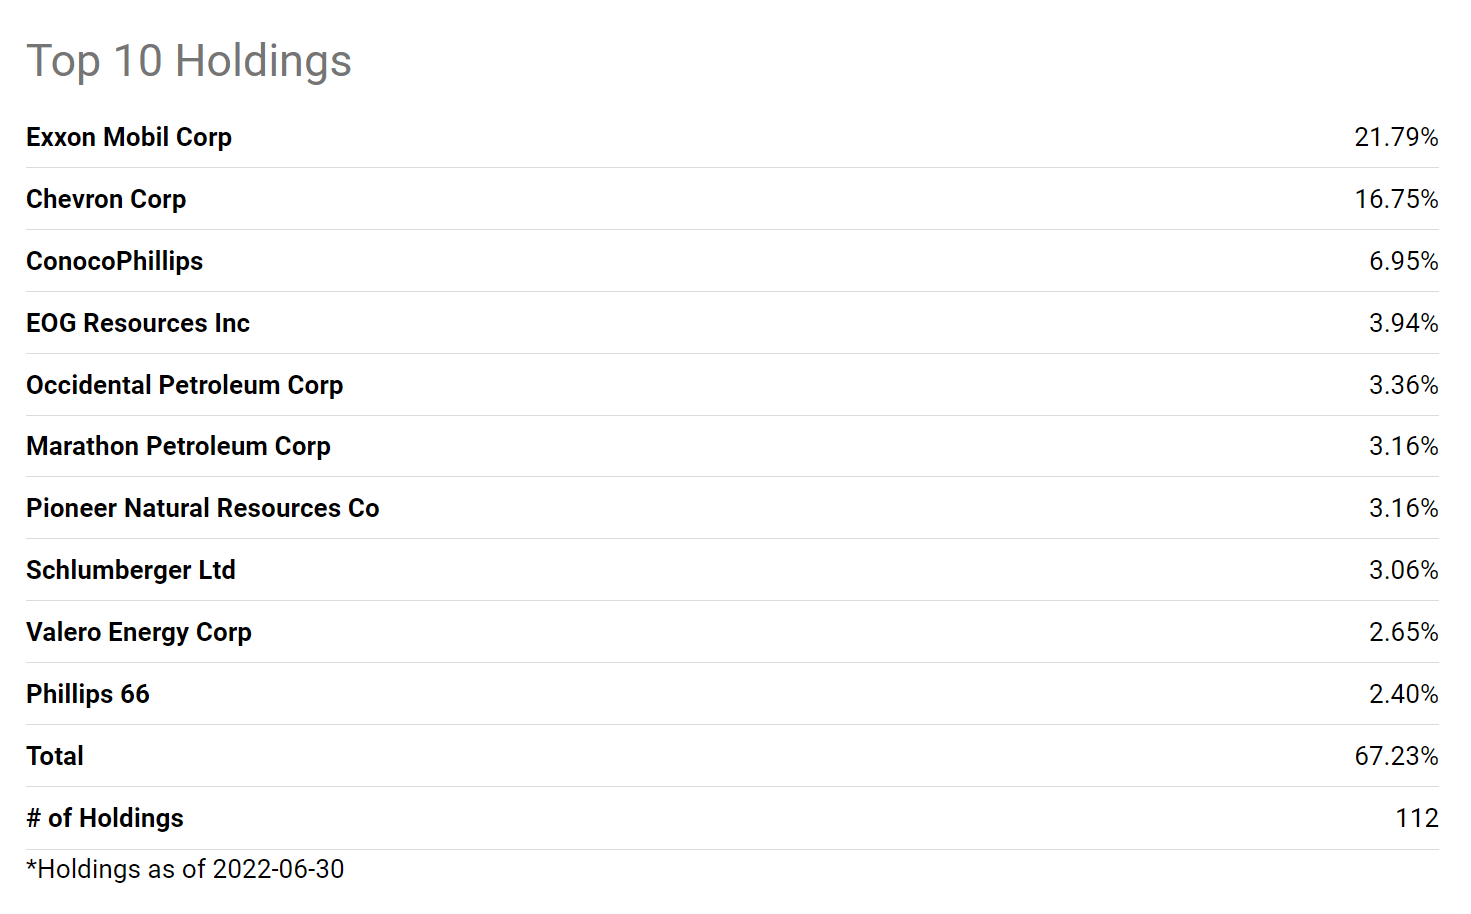
Key catalysts: Low inventory and supply-demand imbalance
Both the U.S. and the world are going through a supply-demand imbalance for key energy sources such as petroleum and natural gas due to years of underinvesting. And the imbalance is only exacerbated by the ongoing Russian/Ukraine situation.
Let’s first take a look at EIA Petroleum Balance Sheet. As you can see from the chart, all the key petroleum stocks are declining both compared to a week ago and a year ago. To wit, U.S. crude oil refinery inputs averaged 16.0 million barrels per day during the week ending July 22, 2022. This was 292,000 barrels per day less than the previous week’s average, or about 1.8% in relative terms. Total petroleum stocks (excluding the strategic reserve) declined by -0.3% compared to a week ago and a whopping 5% a year ago.
EIA report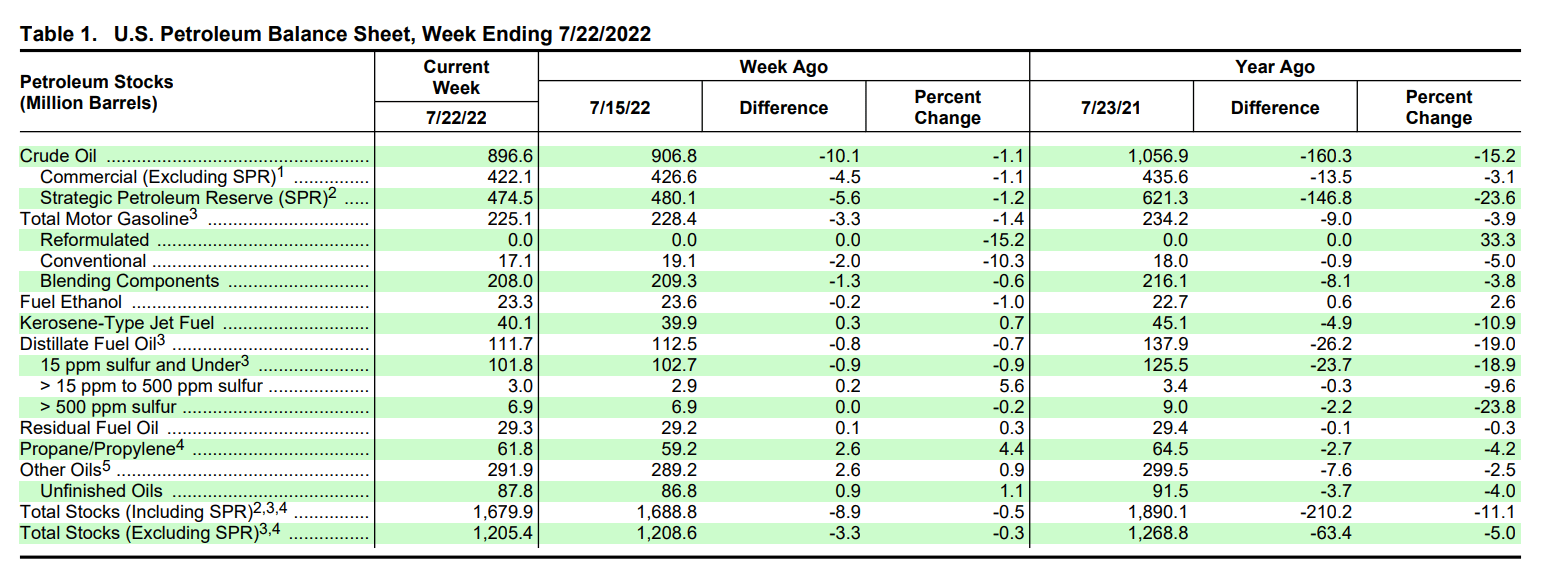
The picture for Natural Gas is equally concerning, as you can see from the following EIA natural gas inventory. The gray area shows the previous five-year range, and the thick red line shows the 2022 seasonal inventory. As you can see, the 2022 inventory started at the historical average (represented by the dotted line) in January, then it quickly declined. Now it is far below the average, actually toward the lower end of the 5-year range.
EIA report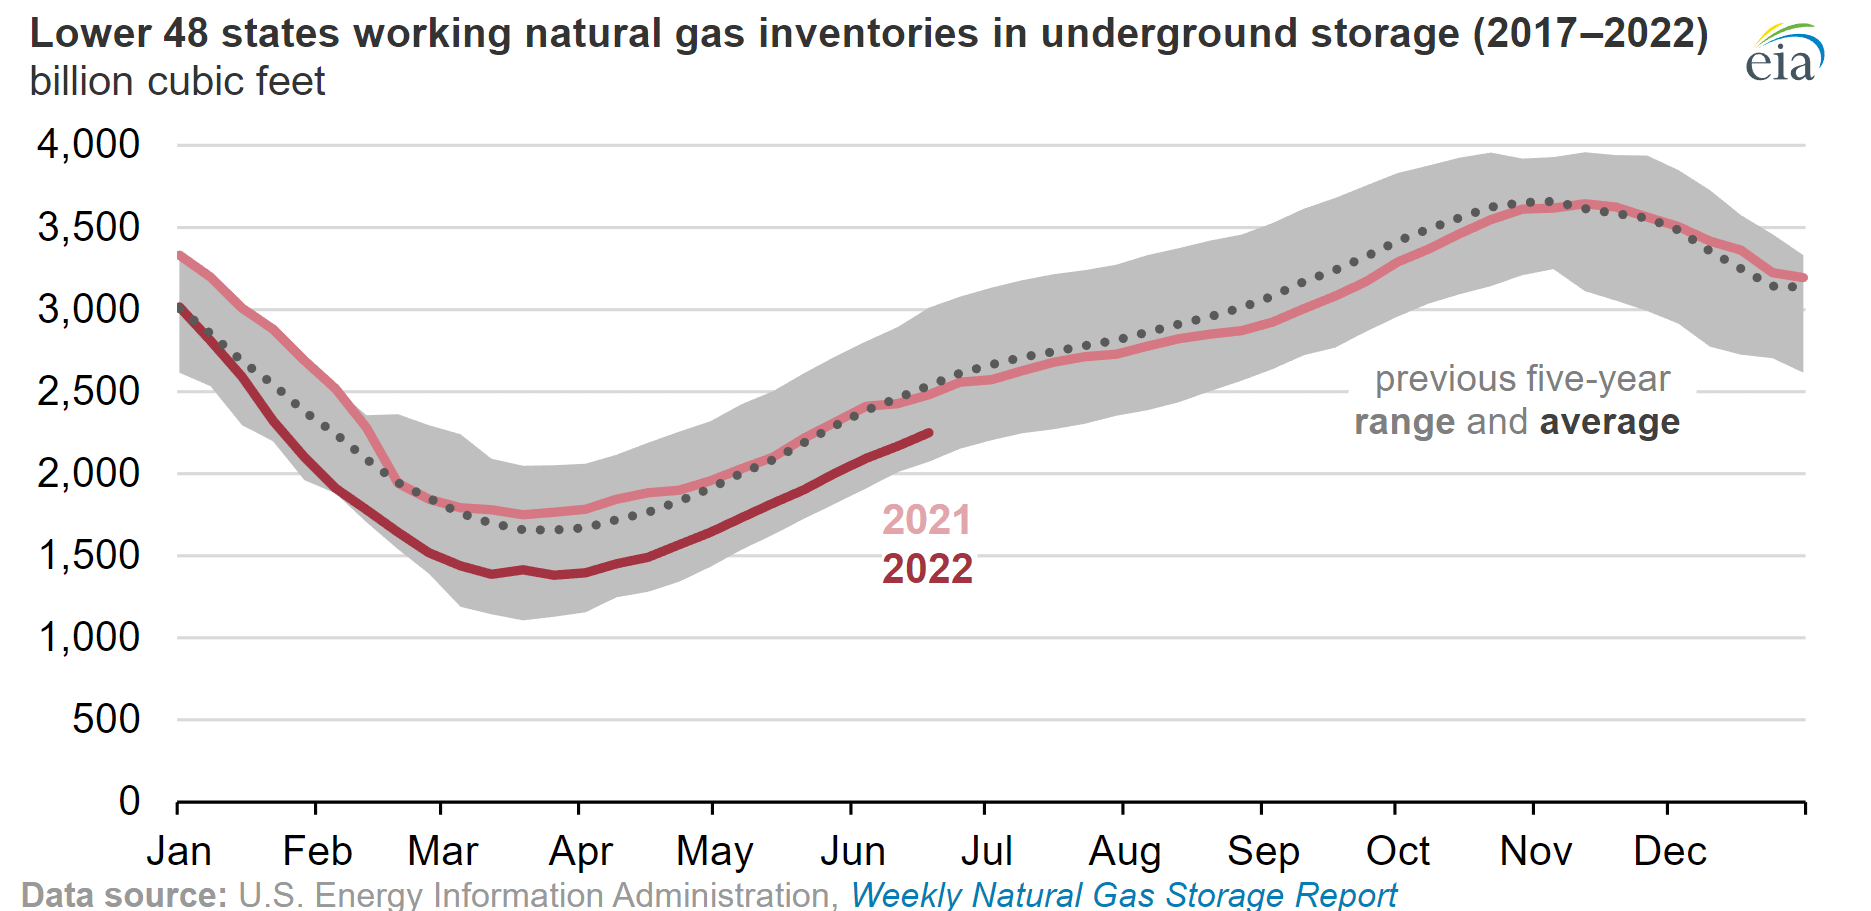
Now let’s look at the inventory for OXY more closely. The chart below shows its days of inventory outstanding on an annual basis. Its outstanding inventory has been fluctuating in a range between about 35 days to 43 days in the past 10 years. Its current inventory stands at 37.7 days, also towards the lowest level in a decade.
Looking ahead, there are a few key factors to keep inventory low and hence prices high. The factors are best summarized in the following EIA report, and I will just directly cite them here and highlight the key factors:
- Colder-than-normal temperatures resulted in total natural gas consumption exceeding the five-year (2017-21) average.
- The electric power sector had limitations with natural gas-to-coal switching.
- Growth in economies in Asia and constraints on liquefied natural gas (‘LNG’) exports to Europe from Russia have contributed to strong international demand for natural gas, resulting in increased U.S. LNG exports.
Seeking Alpha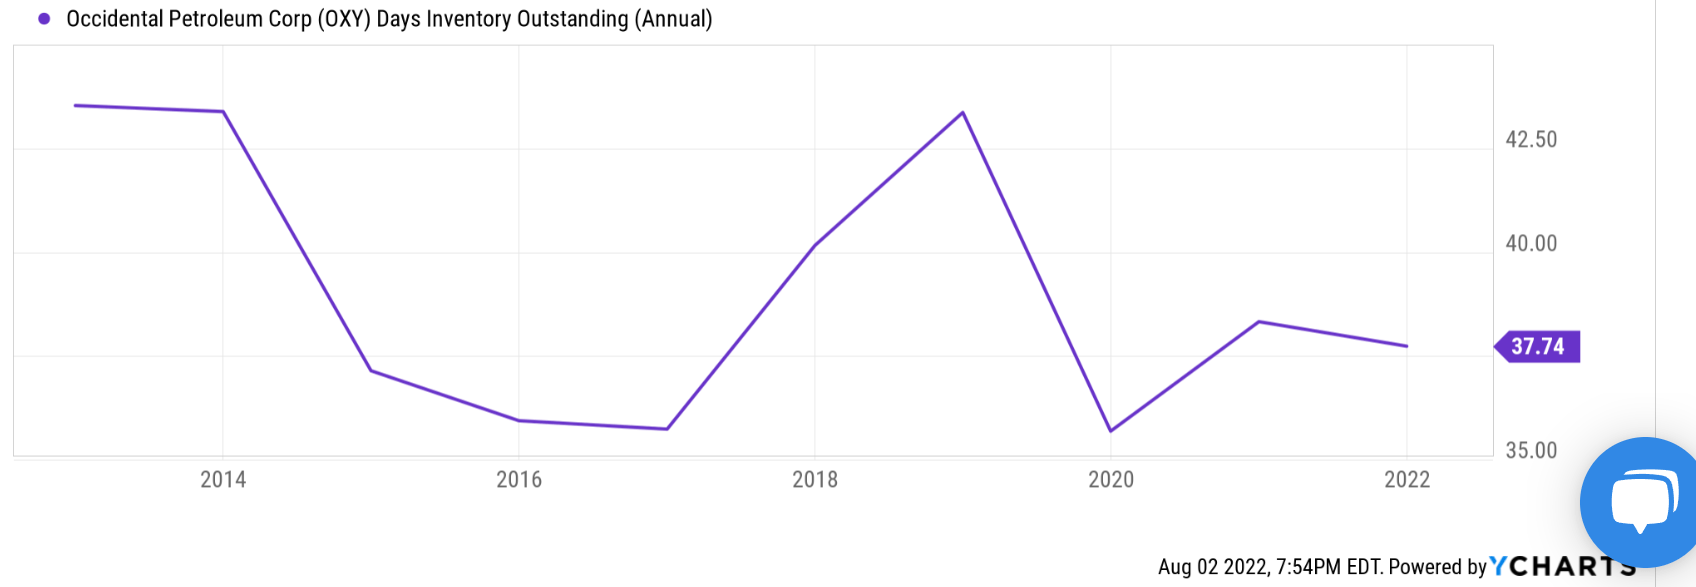
VDE and OXY: Closer look at profitability
As aforementioned, the profitability metrics of the energy sector are not the highest when compared to other sectors given its cyclical nature. And the next chart shows OXY’s return on invested capital (“ROIC”), which clearly illustrates the cyclicality. Note how it has fluctuated from peak to beam every 2 to 3 years. And also note that OXY’s ROIC currently stands at 14.2%, near the peak level in a decade. Finally, also note that the sector’s average ROIC, when approximated by VDE’s return on equity, is about 13.7%, which is slightly below OXY.
And I am going to make a bold prediction here that in the next few years, both the sector and OXY will be able to maintain their ROICs at this high level due to the imbalance mentioned above. As we have argued in our earlier articles, we see the imbalance as a long-term structural problem accumulated by years of underinvestment in the energy sector. And as a result, we do not see the problem going away in the short term.
Seeking Alpha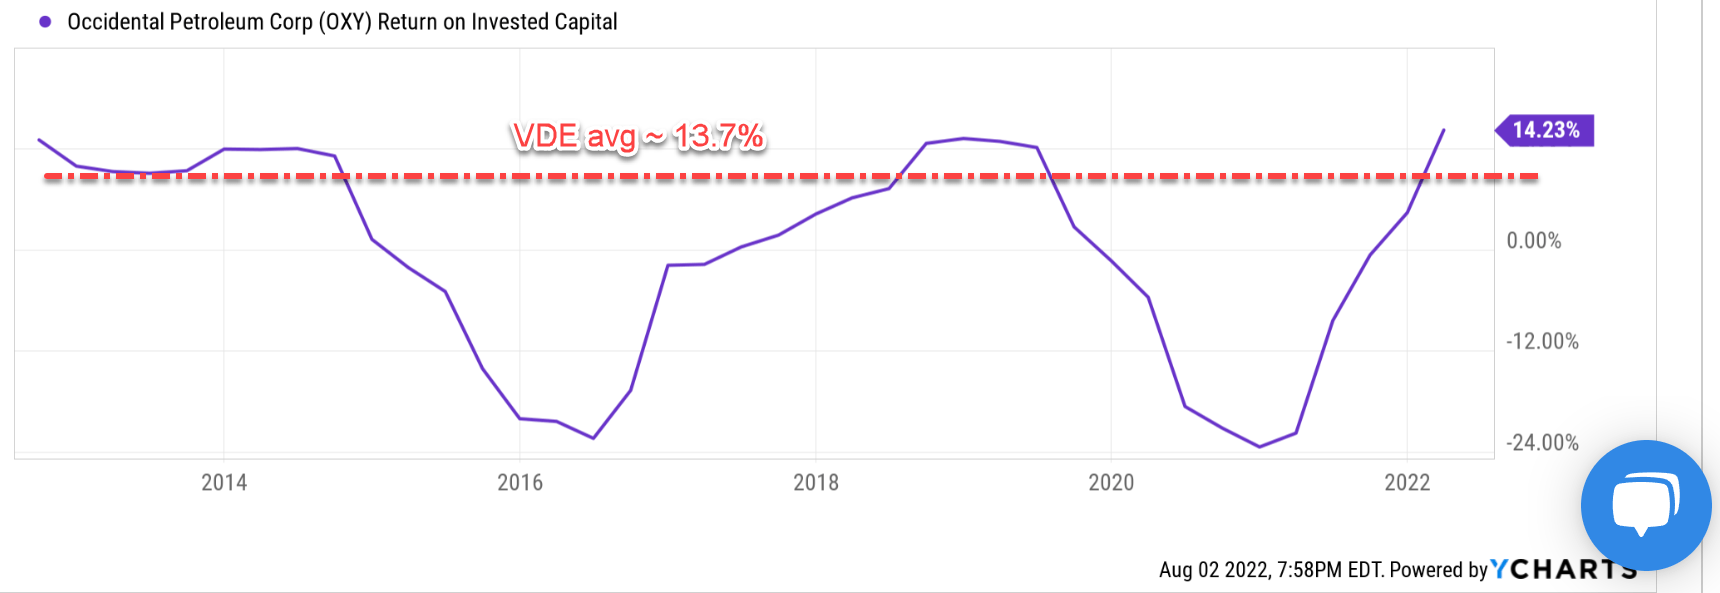
VDE and OXY: Dividend comparison
Some investors may be concerned about OXY’s dividend, especially those of us who are used to its ~8% level yield in the past. Indeed, its recent large dividend cuts have reduced its payout to a token level. And even after its recent hikes, it’s yielding only 0.43% currently, not only far from its past record but also far below the sector’s yield of 3.43% as you can see from the following chart.
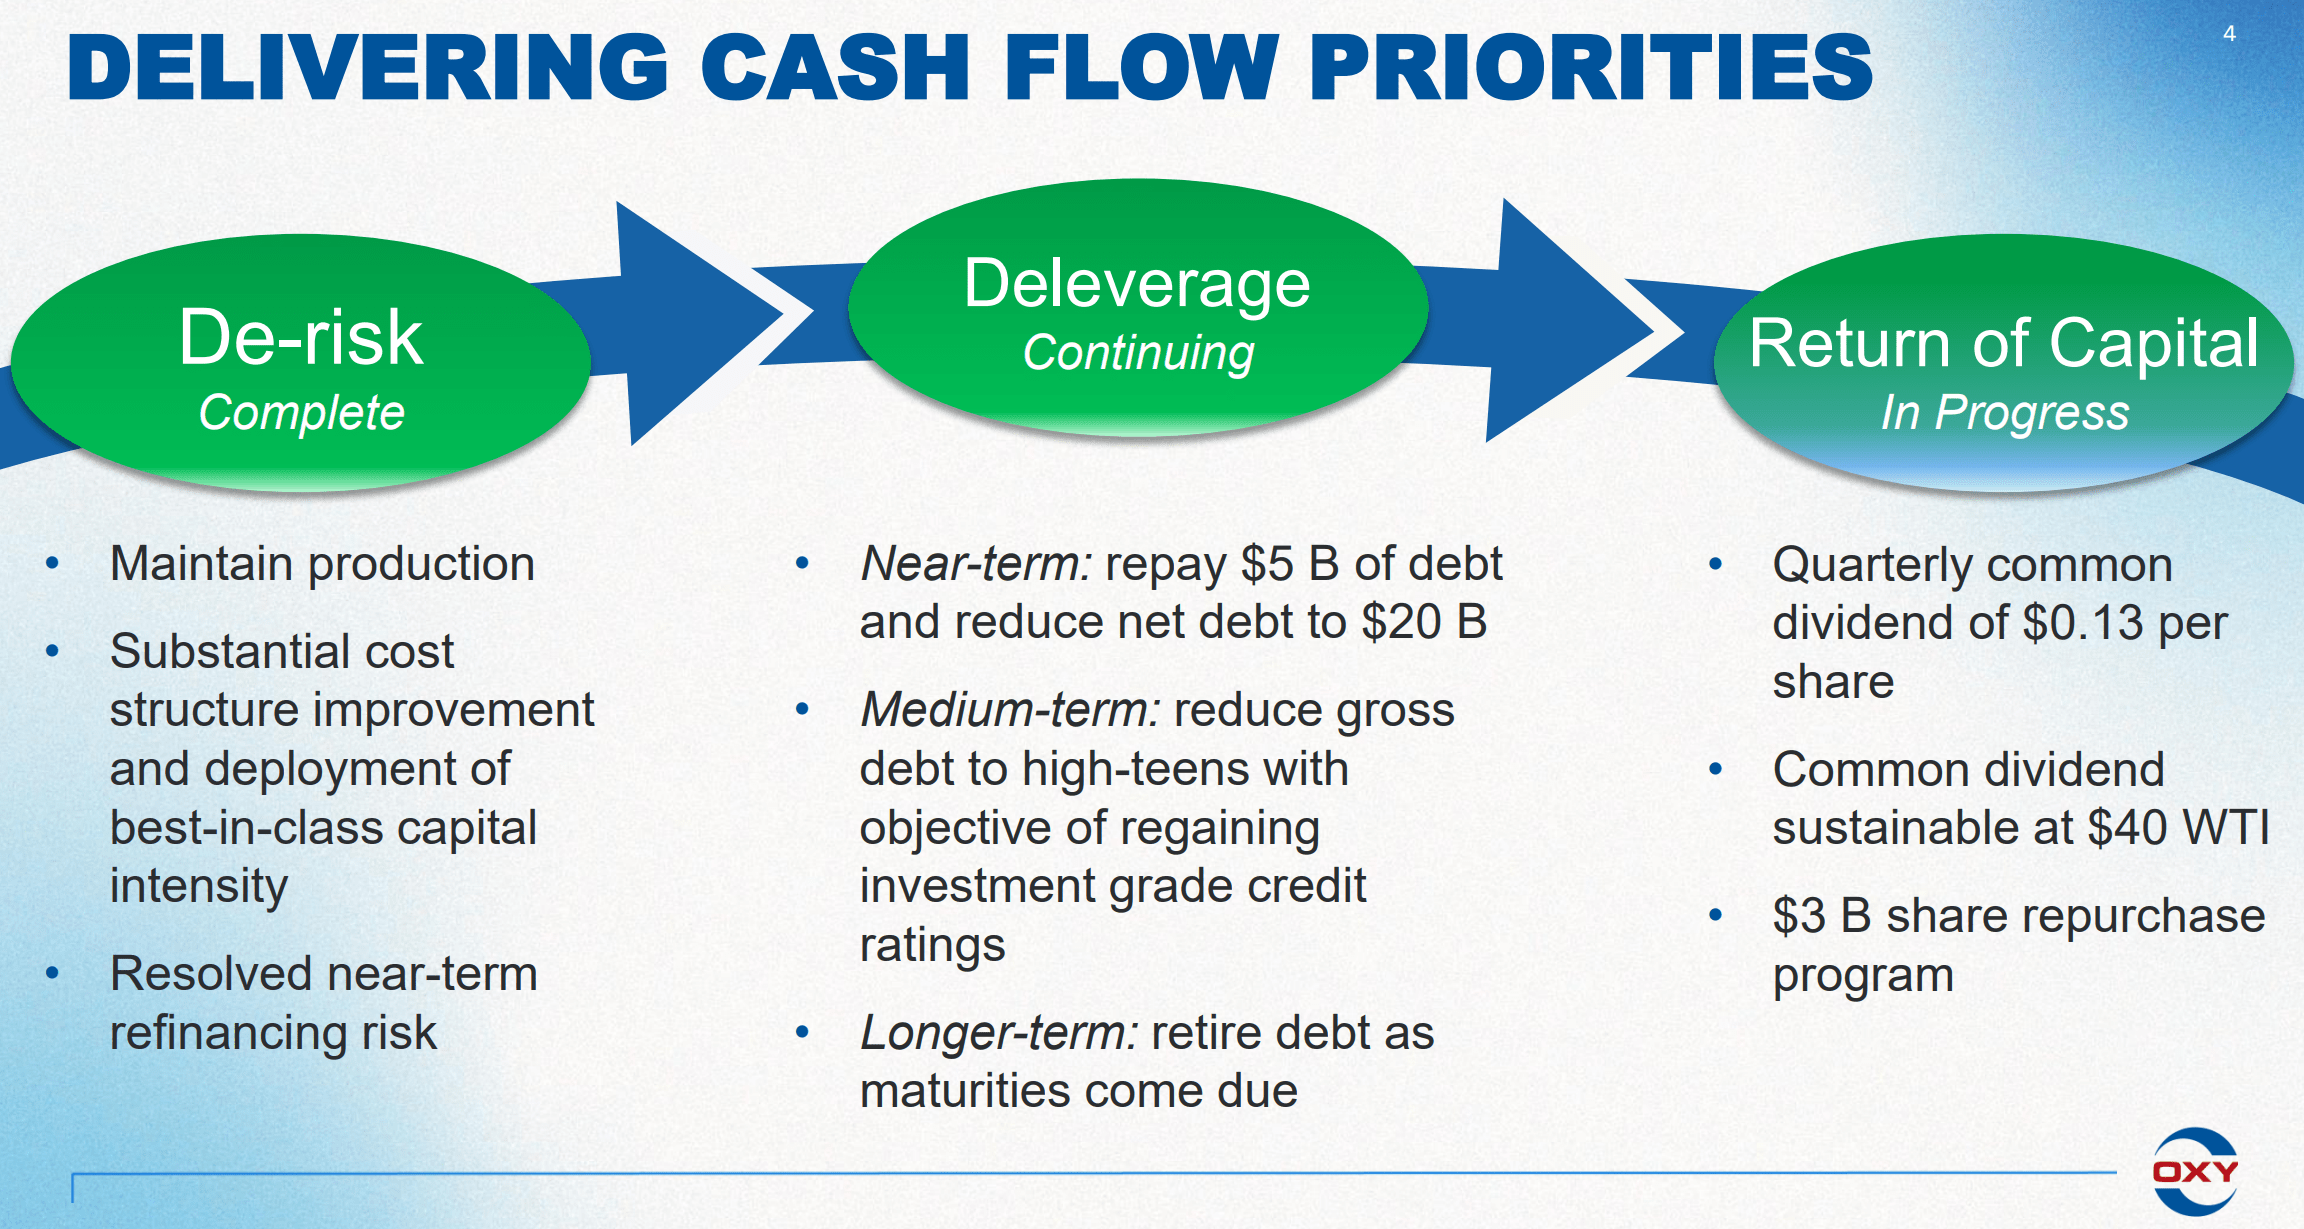
And furthermore, in the next few years, OXY’s priority is to deleverage, then the $3B share repurchase, and then finally dividend growth. And the following comments from OXY’s CFO Robert Peterson in the Q2 earnings report (abridged and emphases added by me) have made the priority crystal clear:
It is reasonable to expect that we can meet our near-term debt targets and then initiate our share repurchase program during the second quarter. Once we complete our near-term debt reduction target and repurchased $3 billion of shares, we will continue to allocate free cash flow to repaying debt as we lower gross debt to the high teens in billions. We believe reducing debt to this level will speed our return to investment grade and better position us to sustain a greater dividend at lower prices.
I fully agree with the above cash flow priorities. However, I do understand that for many investors, current dividends are more important. In this case, VDE or other stocks in the sector (such as XOM and CVX) would be a good alternative.
For investors who do not need the current income, the focus should be on earnings yield rather than dividend yields, as to be elaborated on below.
Seeking Alpha OXY Q2 earnings report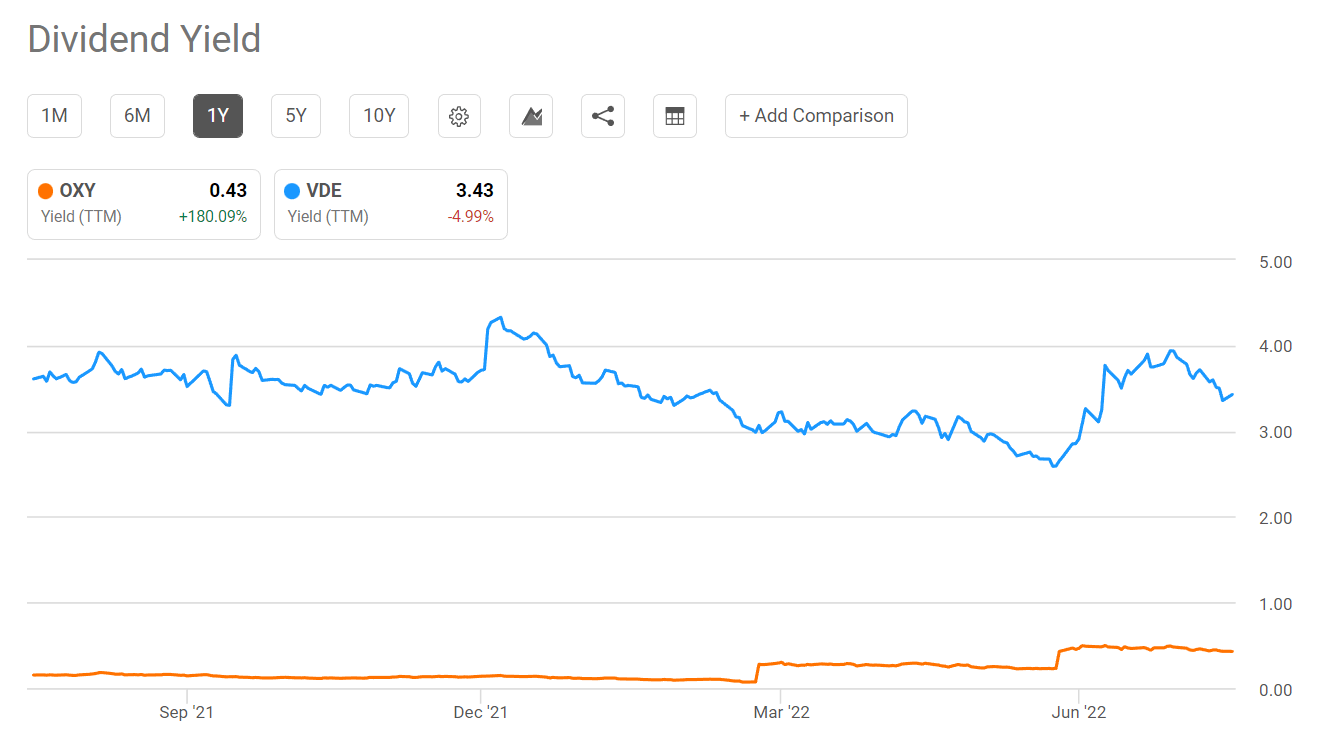
VDE and OXY: Earning yield comparison
For investors who do not need the current income, earning yield is what really matters in the long term. The reasoning is detailed in our early articles, and in brief:
In the long-term, it doesn’t matter how the business uses the earnings (paid out cash dividends, retained in the bank account, reinvested to further grow the business, or used to repurchase stocks), as long as used sensibly, it will be reflected as a return to the business owner. That is why earning yields are more fundamental for long-term shareholders.
As can be seen from the next chart, currently the earning yield of OXY is about 10.5%, near the peak level in a decade. To put things under perspective, VDE’s earnings yield is about 7.4% due to its higher valuation multiples as aforementioned. Although both OXY and VDE are providing earnings yield far above other sectors and also the risk-free interest rates (the 10-year treasury yield is about 2.7% as of this writing).
Seeking Alpha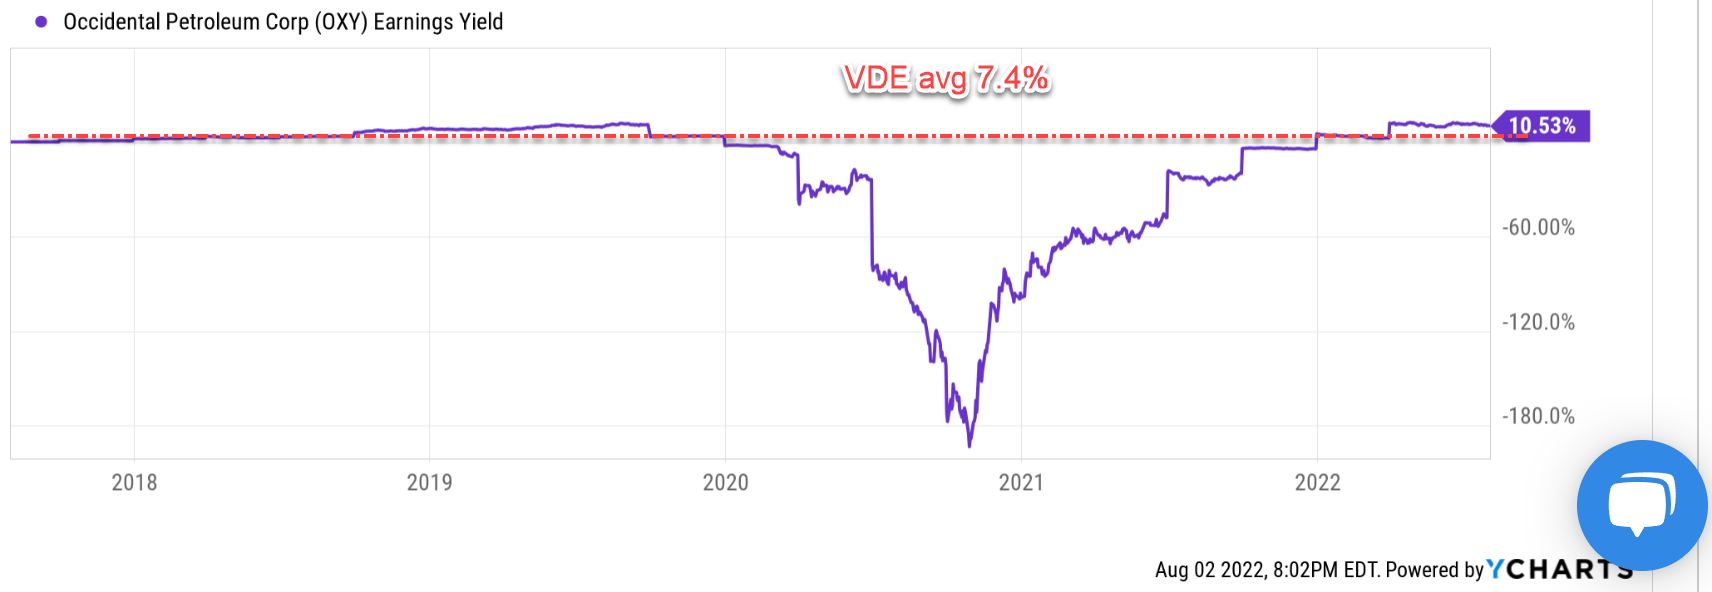
Final thoughts and risks
To sum up, we see the energy sector as the most attractive sector for 2H 2022. Furthermore, the sector’s attractiveness is not caused by a few stocks that disproportionately dominate the sector. Instead, we see attractive stocks across the sector such as XOM, CVX, and OXY. In particular, investors who focus more on current dividend payout have plenty of good options here, ranging from sector funds such as VDE to individual stocks like XOM and CVX. For investors who focus more on total shareholder yield in the long-term, OXY is an attractive option. It offers better profitability than the sector average and more price rebound potential given its compressed valuation.
Finally, risks. First, timeframe. The above analyses are more oriented toward the next 1 to 3 years, which is really a short time frame for the energy business. In the long term, climate and environmental concerns are a risk for the entire sector and all its components. Now back to the short term. Both the sector and OXY are facing short-term risks associated with the ongoing interruptions of the global supply chain. Supply chains have been choking production capacity in recent quarters, especially around pressure pumping capacity. OXY’s CEO Vicki Hollub commented in the Q2 earnings report that she has not seen “inventories and spare capacity so low since she’s been in the industry”. Combining this with the supply chain issues, there could be persistent headwinds for OXY and the sector to increase production both in the U.S. and worldwide.
Be the first to comment