

Pgiam/iStock via Getty Images
Investment Thesis
The purpose of market transactions is to determine prices – agreements at the time of the trade between buyer and seller. One, neither, or both, may be pleased by the outcome, but both will be satisfied in some way by the transaction.
Getting them to that point sometimes takes the persuasion of less satisfactory outcome possibilities, ones formerly rejected by the parties but now made likely, and possible, by intermediaries known as Market-Makers.
Risks are involved in so doing, but risk-takers – for a price – will participate if adequately encouraged. Therein lie the forecast of price extremes, up and down, and the means of guessing price change direction, size of the change, and how likely it will come. The history of prior price extreme prospects may provide reliable odds on what is to occur next.
This article examines the present prospects for PC Connection, Inc. (NASDAQ:NASDAQ:CNXN) and several stocks of firms in competition with CNXN. Those prospects, while near in time, often are far more powerful than the oft-offered “long-term trend” potential payoff prospects.
Stock Description
“PC Connection, Inc., together with its subsidiaries, provides various information technology (IT) solutions. The company operates through three segments: Business Solutions, Enterprise Solutions, and Public Sector Solutions. It offers IT products, including computer systems, data center solutions, software and peripheral equipment, networking communications, and other products and accessories, as well as provides services related to design, configuration, and implementation of IT solutions. The company markets its products and services through its websites comprising connection.com, connection.com/enterprise, connection.com/publicsector, and macconnection.com. It serves small to medium-sized businesses (SMBs) that include small office/home office customers; government and educational institutions; and medium-to-large corporate accounts through outbound telemarketing and field sales, and marketing programs targeted to specific customer populations, as well as through digital, web, and print media advertising. The company was founded in 1982 and is headquartered in Merrimack, New Hampshire.”
Source: Yahoo Finance
Yahoo Finance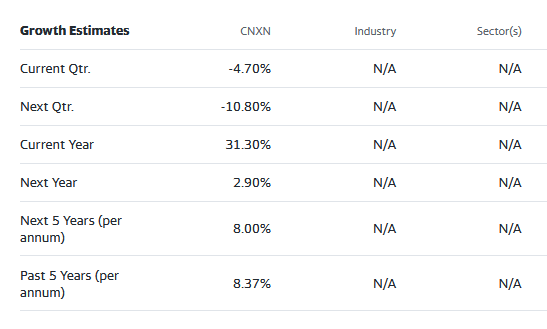
Comparing Forecasts
“Street” forecasts shown above offer big next-year growth for CNXN, the stock’s major support for the next 5 years. What to do with the stock beyond “next year” is left to conjecture.
A contrasting approach using price-change forecasts from the Market-Making [MM] community suggests more powerful outcomes from Active Investing strategy [AIs], rather than the conventional Passive Investing strategy [PIs]. Figure 1 shows the MMs Reward-Risk forecast tradeoffs.
Figure 1
blockdesk.com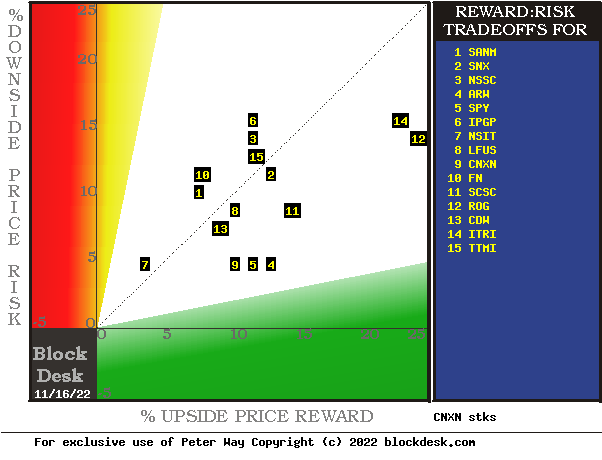
(Used with permission)
This map locates securities at the intersection of prospective price gains (green horizontal scale) and potential price drawdowns (red vertical scale) based on market-maker hedging behavior to protect their necessary endangerment of firm capital as they enable volume trades. Desirable conditions are down and to the right.
The stocks apparently of best advantage are along a “frontier” from CNXN at location [9] to “market-average” notion SPDR S&P 500 Trust ETF (SPY) at location [5] to Arrow Electronics (ARW) at [4]. Our interest focus is on CNXN at [5].
Alternatives to CNXN are explored in greater detail in Figure 2, where other conditions contributing to reward and risk are contemplated. Principal questions for all alternatives are “how likely are these outcomes to happen,” and “can their impact be improved?”
Figure 2 presents the MMs’ price range forecasts for the best-ranked alternative investment candidates in Figure 1, along with the past 5 years of daily forecasts outcomes from their prior forecasts with the same proportions of today’s up-to-down prospects.
This table presents data on the stocks most likely to produce satisfying rates of capital gain under the portfolio management discipline known as TERMD, as explained in the article titled “How To Better-Than-Double Your Capital Gains (From Stocks Alone) By Using TERMD Portfolio Discipline” in my SA blog.
That discipline seeks the largest, most likely, quickest to be captured net capital gains with the least interim exposure to price drawdown on the way to target reward attainment.
Figure 2
blockdesk.com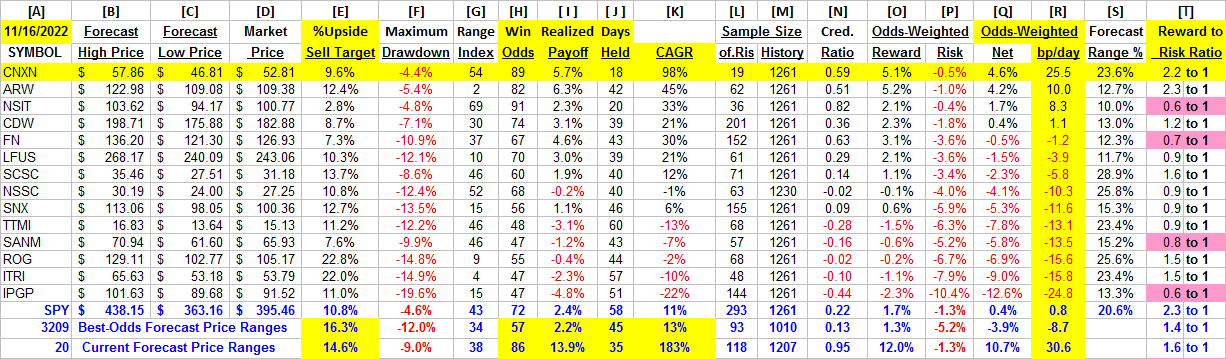
Contributing to that evaluation are the demonstrated odds of a profit-successful forecast in column [H], its complement of 100 – H, or loss frequency, size of net gain attained [I] and size of worst loss experience [F], so that, when appropriately weighted in [O] and [P], they produce the Net of [Q]. Respecting the power of compounding, [Q] converted into basis points per day [J] of capital commitment at [R] presents a highly comparable figure of merit (fom) for investing preferences.
Figure 2 is row-ranked on [R]’s figure of merit (fom) and contrasts CNXN’s capital gain prospects with the others.
ARW appears to be a strong contender choice in its [R] ranking, but its good performances in [H], [I], and [K] are the product of a poor realization of forecast [E] in subsequent market payoff realizations [I]. The comparison of [I] to [E] as Credibility test at [N] shows ARW’s deficiency in comparison to CNXN.
CNXN has an outstanding Win Odds ratio [H] of 16+ out of every 18 forecasts made at its current mid-expectations Range Index of 54. Its shorter holding period of 18 market days produces a larger CAGR and bp/day in [R] than ARW’s.
Personal investor preference is likely to prevail in regarding ARW’s attractiveness relative to CNXN on an either-or choice for capital commitment. None of the other electronics supply alternative investment candidates are in their league.
Recent price trend comparisons
Figures 3 and 4 show how these leading stocks compare in the trends of their MM price range forecasts.
Figure 3
blockdesk.com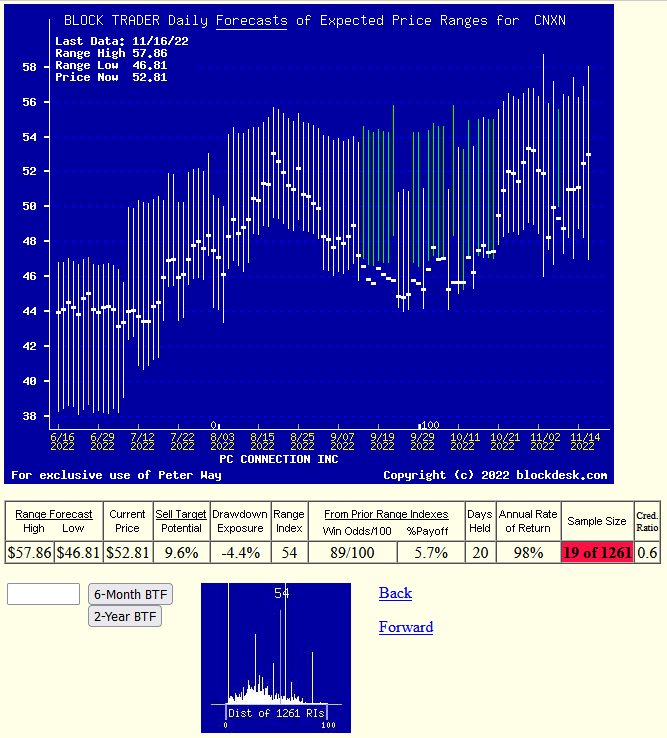
(used with prior permission)
Figure 4
blockdesk.com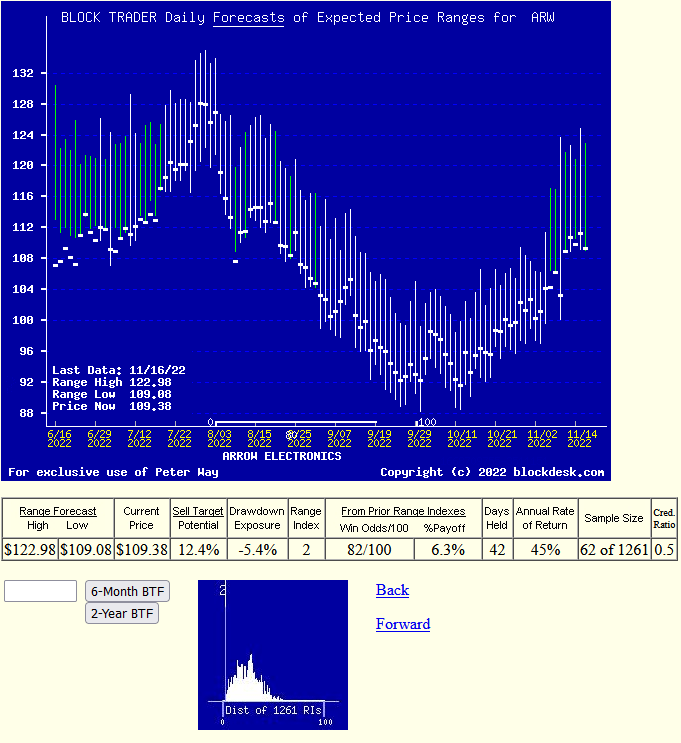
(used with prior permission)
Figures 3 and 4 are NOT the “usual” technical analysts’ “charts” which only show after-the fact histories of already-occurred market actions. Instead, these show day-by day occurring forecasts of expected price ranges yet to come accompanied in their vertical daily bars by the day’s closing price, which separates the forecast into its upside and downside proportional prospects.
The clear difference this day between CNXN and ARW is where today’s market price is in relation to the forecast range. ARW has mostly upside, while CNXN is a fairly even balance, up to down.
History shows both have similar odds of reaching the upside forecast range limits, but because CNXN’s is closer it has in the past taken less time than ARW. The larger distance and longer time makes ARW’s rate of gain less attractive to investors who are under time pressures for performance. Differences in circumstance are what help markets function among well-informed investors.
Conclusion
Investors in need of more rapid rate of reward clearly have more advantage offered in owning CNXN than in AWR. And in its ownership in comparison to all but a small handful of the Figure 2 large population of available equity investment reward forecasts.
Be the first to comment