

GetYourPic/iStock via Getty Images
It is rare to find a macro setup as good as we have for renewable energy. Whether you are a proponent for taking care of the planet or whether you want a higher level of domestic energy security, this is the place you go to. The recent Russia-Ukraine war has reinforced this even further as Europe struggled through tight natural gas supplies. Yet, the two frontline funds in this sector have struggled. Let’s look at these two and see whether the recent underperformance is an opportunity.
Our Stance
We first covered Invesco WilderHill Clean Energy Portfolio ETF (NYSEARCA:PBW) in September 2021 with a “thumbs down” rating.
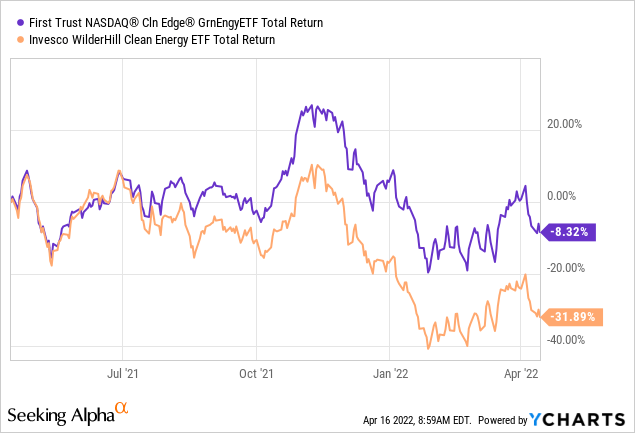
Returns Since First Coverage ( A Clean, Green Fund, But Something Is Missing)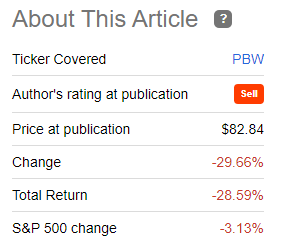
The First Trust NASDAQ Clean Edge Green Energy Index ETF (NASDAQ:QCLN) got an even harsher rating when we explored it in March of 2021.
Returns Since First Coverage (A Bubble By Any Other Name)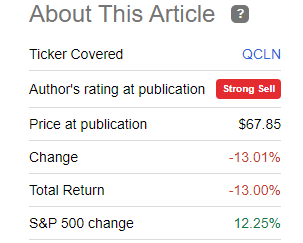
In both cases, we did admire the concept of these ETFs. We did not argue with macro setup. We were still appalled by the valuation of the underlying securities. Let’s see if that has changed.
Current Portfolios
PBW has a very heavy leaning towards industrials, consumer discretionary and information technology sectors.
PBW Current Holdings (Invesco)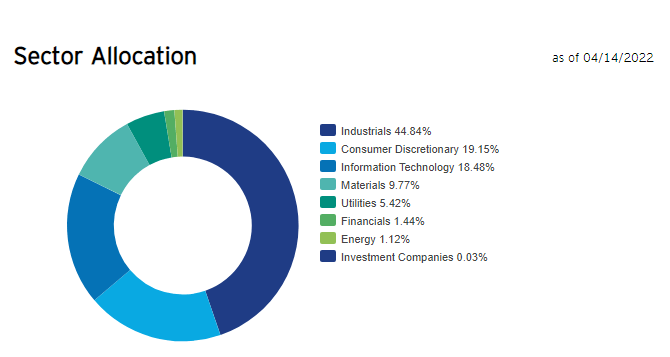
QCLN follows a different classification by identifying the specific subsectors.
QCLN Current Holdings (First Trust)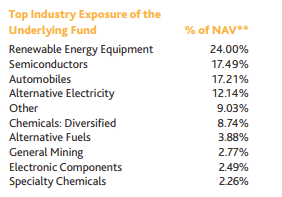
There is a heavy overlap with QCLN’s semiconductors being the primary equivalent of PBW’s information technology sector. The consumer discretionary in PBW is the same as automobiles in QCLN. There is still one major difference between the two funds.
The first being that PBW has a very even distribution of assets. There is virtually no overweighting of any stock. Small fluctuations that we do see come from price movements in between rebalancing periods. The top 10 stocks just make up 15% of the fund.
PBW Top 10 Holdings (Invesco)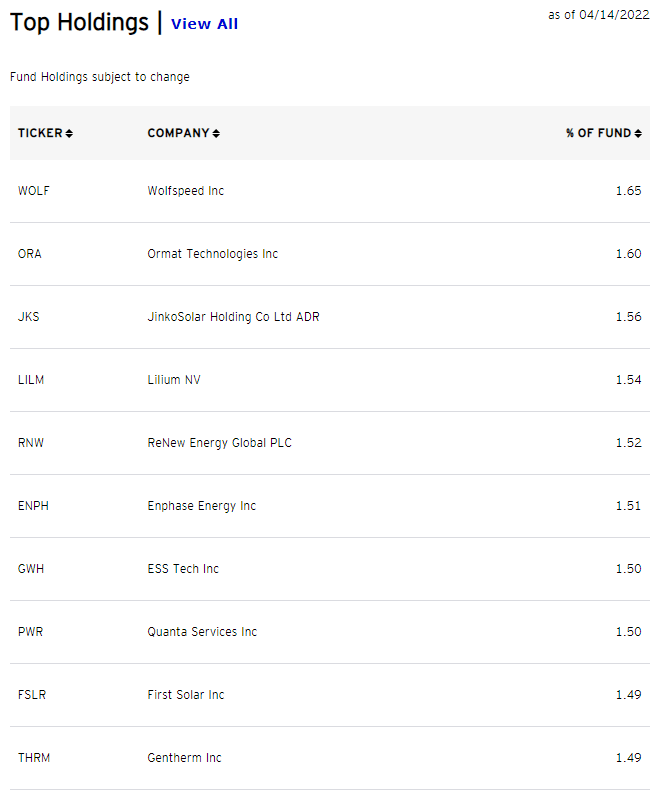
QCLN on the other hand knows what it likes and has gone all-in on a few large stocks. The top 10 assets make up about 60% of the fund!
QCLN Top 10 Holdings (First Trust)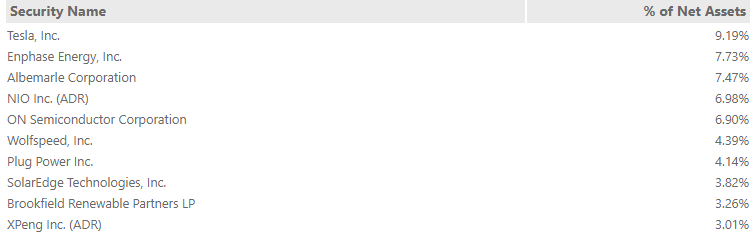
We will get back to how this has influenced returns a little later.
Valuations
PBW does a fairly good job of presenting relevant metrics from its underlying holdings and they are definitely not going to draw in any value buyer.
PBW Holdings, Key Metrics (Invesco)
Interestingly PBW presents this data as is without the massaging that we see in index ETFs. What we mean by that is index ETFs eliminate the stocks with negative earnings and show the average of the rest. That fluffy picture gives comfort to most investors looking to blow more air into the passive investing bubble. PBW deserves credit for going a different route though the results are shocking to say the least.
QCLN also presents some statistics on this but leaves out the P/E ratios, which we would guess would be likely less than appealing.
QCLN Holdings, Key Metrics (First Trust)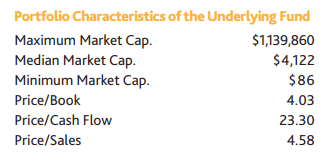
Of course even P/E ratios are hardly a panacea. One reason is that many renewable plays like Brookfield Renewable (BEP), (BEPC) are better evaluated by funds from operations (FFO) rather than by a blanket P/E ratio. Our overall take is that the stocks are expensive in both portfolios, but QCLN has a higher weightage to cash producing companies while PBW is leaning heavily towards future growth.
Outlook & Verdict
Both funds have relatively modest fees (PBW, 0.61% & QCLN, 0.77%) so there is not much to choose there. The funds do follow different indices as shown in their names and of course, their holdings. QCLN’s large outperformance in the last year stems from having a much higher component of defensive companies like BEP and Atlantica Sustainable Infrastructure Plc (AY).
It also comes from being very top heavy. You can see that 4 out of the top 5 holdings of QCLN have decisively beaten QCLN, PBW, and even the S&P 500 (SPY) over the last year.
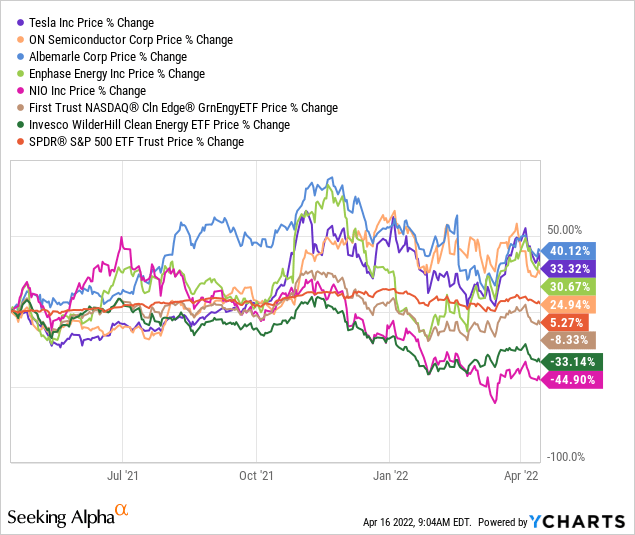
While this has been a spectacular feature for relative outperformance, we don’t think this will continue going forward. Most of these holdings resemble the last standing generals of the last bubble, bravely carrying on the fight while the foot soldiers fall. In fact, on another article, we had identified Tesla Inc. (TSLA), Bitcoin (BTC-USD) and Shopify (SHOP) as the last 3 assets holding up ARK Next Generation Internet Fund (ARKW). Since then SHOP broke ranks and dropped 60%. We are seeing the same in the renewable bubble where the smaller stocks have broken down badly while the largest companies have actually moved up. We expect TSLA and the rest of these high flyers to join in the downswing shortly. So QCLN’s tailwind likely turns into a headwind in the coming quarters.
On the macro front, we like what we are seeing with deployment of renewable energy and the pace should remain robust in the decade ahead. Unfortunately deployment is nowhere near the equivalent of profitability. High inflation from rising labor and material costs remain a problem for all sorts of renewable plays. If you’re wondering why we expect at least 80% downside for TSLA, here is one chart for you.
Rising Costs For EVs (Tom McClellan, Twitter )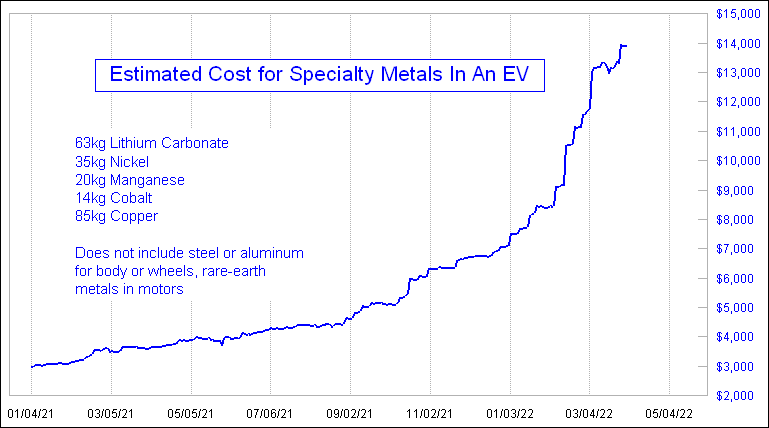
In this environment, the owners of the electricity/power generating assets will be winners. Hence we prefer, TransAlta Corporation (TAC) and AY kind of companies versus the builders of new assets. We are hence maintaining a Sell rating on both PBW and QCLN and look forward to revisiting this when all the proverbial wind has been knocked out of them.
Please note that this is not financial advice. It may seem like it, sound like it, but surprisingly, it is not. Investors are expected to do their own due diligence and consult with a professional who knows their objectives and constraints.
Be the first to comment