

kupicoo
Investment Thesis
The Invesco Dynamic Food & Beverage ETF (NYSEARCA:PBJ) has been a top performer all year, delivering a 3.33% total return compared to a 2.86% loss for the $16 billion Consumer Staples Select Sector SPDR ETF (XLP). But PBJ’s Intellidex Index has a notoriously high turnover rate, meaning that its holdings today may not match what was successful in the past. Therefore, this article aims to ensure PBJ remains solid enough to justify its 0.63% expense ratio. My buy rating has stayed the same, but I want investors to know they’re giving up a significant amount of quality with PBJ, which may turn out to be a big negative should the U.S. enter a recession. With that in mind, I look forward to taking you through PBJ’s strategy and fundamentals next.
ETF Overview
Strategy Discussion
PBJ tracks the Dynamic Food & Beverage Intellidex Index, selecting 30 stocks from its more extensive proprietary Index. The screens focus on five broad factors: price momentum, earnings momentum, quality, management action, and value. Sub-factors include:
- company’s price relative to its 52-week high price
- return on assets
- return on equity
- dividends and buybacks
- analyst estimate changes
- various price ratios (earnings, cash flow, book value, sales)
Markets are paying attention to fundamentals this year. Rules-based ETFs like PBJ are outperforming the cheaper and more popular plain-vanilla ones, and that’s due to the negative to neutral market sentiment. In addition, valuations for mega-cap stocks are beginning to normalize. As it relates to the Consumer Staples sector, missing from PBJ are Procter & Gamble (PG), Costco (COST), and Walmart (WMT), three companies with a combined trillion dollar market capitalization and 30% allocation in XLP. Without knowing exactly how the Intellidex model weights each factor, I assume their above-average valuation ratios do them no favors. In a nutshell, minimal exposure to these richly valued stocks is what you can expect with PBJ, but as I’ll discuss later, it isn’t without sacrifice.
Industry Exposures and Top Holdings
PBJ invests in eight GICS industries. I’ve listed their percentages below, with corresponding allocations in XLP in parentheses.
- Packaged Foods & Meats: 36.00% (16.31%)
- Food Distributors: 19.89% (2.21%)
- Food Retail: 16.01% (1.55%)
- Soft Drinks: 14.67% (24.76%)
- Agricultural Products: 5.47% (2.71%)
- Distillers & Vintners: 2.74% (2.66%)
- Restaurants: 2.63% (0.00%)
- Brewers: 2.60% (0.50%)
The Packaged Foods & Meats industry includes four well-known companies in PBJ’s top ten holdings list: General Mills (GIS), Kraft Heinz (KHC), Hershey (HSY), and Hostess Brands (TWNK). Food Distributors are led by Sysco (SYY) and Performance Food Group (PFGC). Food Retail includes some lesser-known names like Sprouts Farmers Market (SFM) and Weis Markets (WMK), while PepsiCo (PEP) and Coca-Cola (KO) make up the bulk of the Soft Drinks industry. I’ve listed the top ten below, which total 46.52% of the portfolio.
Invesco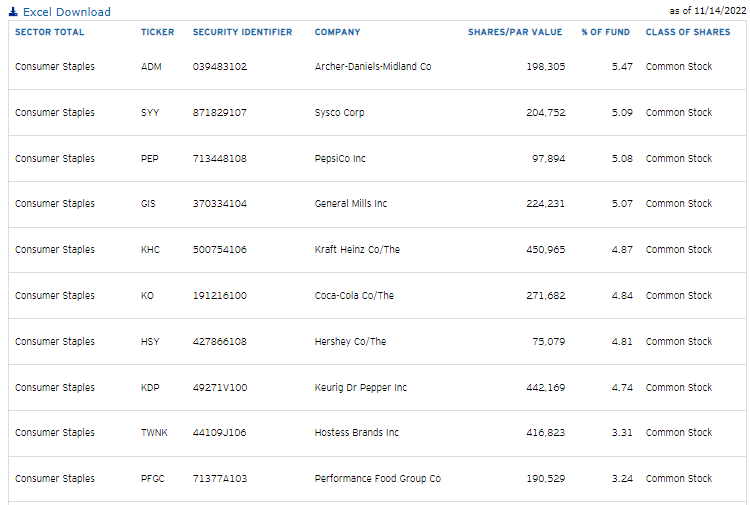
Finally, I mentioned PBJ’s 0.63% ratio, which is the most expensive for any Consumer Staples ETF, except for the First Trust Consumer Staples AlphaDEX ETF (FXG) at 0.64%. In addition, PBJ’s median bid-ask spread is 0.09%, so the cost of trading frequently can be pretty high and is not recommended.
Performance Analysis
PBJ’s long-term performance is disappointing. Since its inception in June 2005, it’s gained an annualized 8.16% vs. 9.77% and 9.89% for XLP and the Vanguard Consumer Staples ETF (VDC). In the long run, these minor differences add to huge dollars. On a $10,000 investment assuming reinvested dividends, long-term PBJ shareholders gave up $12,519. At least a quarter of that is due to the additional fees.
Portfolio Visualizer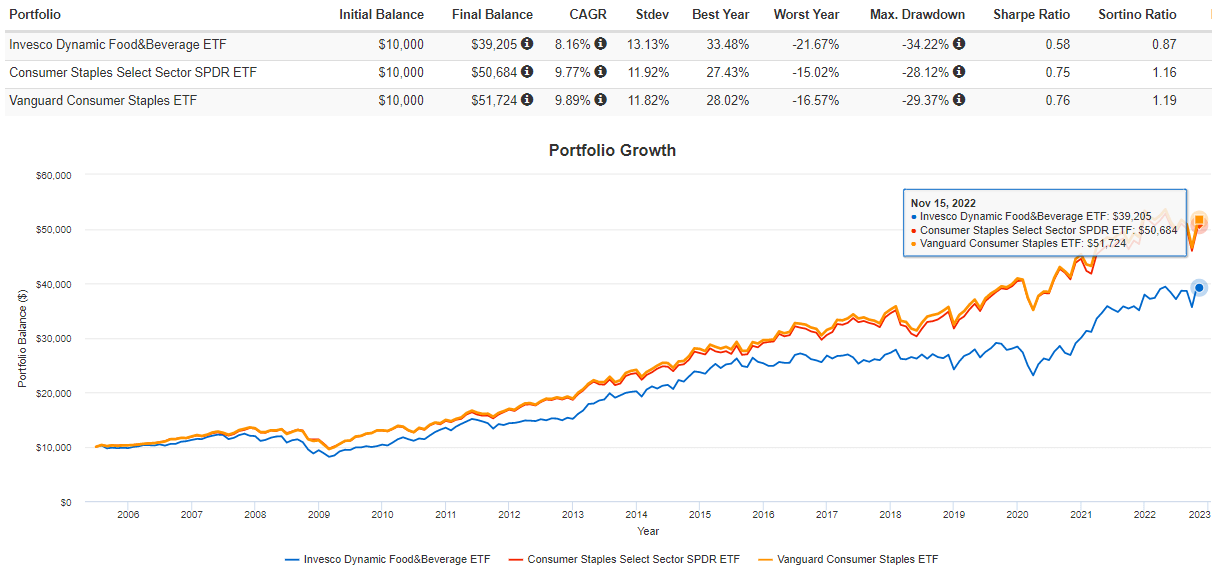
However, I advocate assessing each ETF based on its current holdings rather than past results. It’s especially appropriate with PBJ, given its annual portfolio turnover rate routinely exceeds 100%. I initially gave PBJ a bullish rating in January based on a heavily discounted forward earnings valuation vs. VDC (19.23x vs. 25.14x), a more robust estimated earnings growth rate (13.60% vs. 10.18%), and a better EPS Revision Score (7.10 vs. 5.87). Since then, it’s outperformed VDC and XLP by about 6%.
Seeking Alpha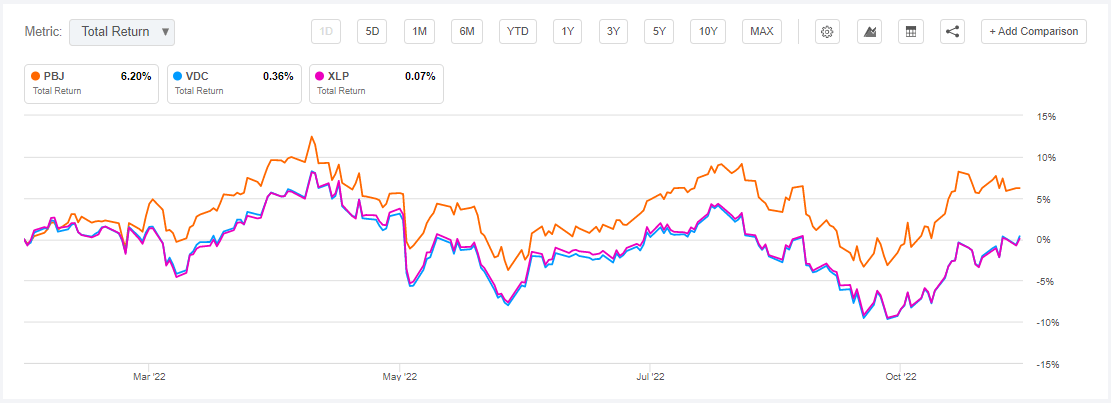
ETF Analysis
Company Snapshot
Remarkably, little has changed over the last year, as detailed in the table below. PBJ currently trades at 19.42x forward earnings, has an estimated 15.86% earnings growth rate, and has a 6.92/10 EPS Revision Score. Also worth noting is PBJ’s 0.67 five-year beta, a decrease from 0.75 in January.
The Sunday Investor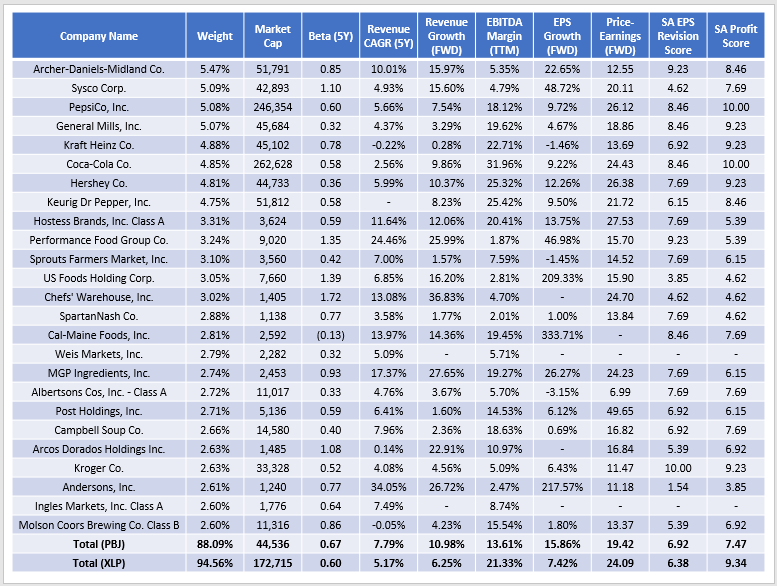
I like that PBJ’s beta is lower because I view the Consumer Staples sector as an efficient way to decrease risk. Most low-beta names like PepsiCo, General Mills, and Coca-Cola are also highly profitable and likely excellent long-term holdings. The 19.42x forward earnings valuation is 4.67 points behind XLP’s, but the 15.86% estimated earnings growth rate is more than twice as big.
This additional growth is driven by small-cap stocks like Cal-Maine Foods (CALM) and The Andersons (ANDE). Diversifying by size within this sector is beneficial, especially since the Invesco S&P SmallCap Consumer Staples ETF (PSCC) has consistently outperformed XLP.
Portfolio Visualizer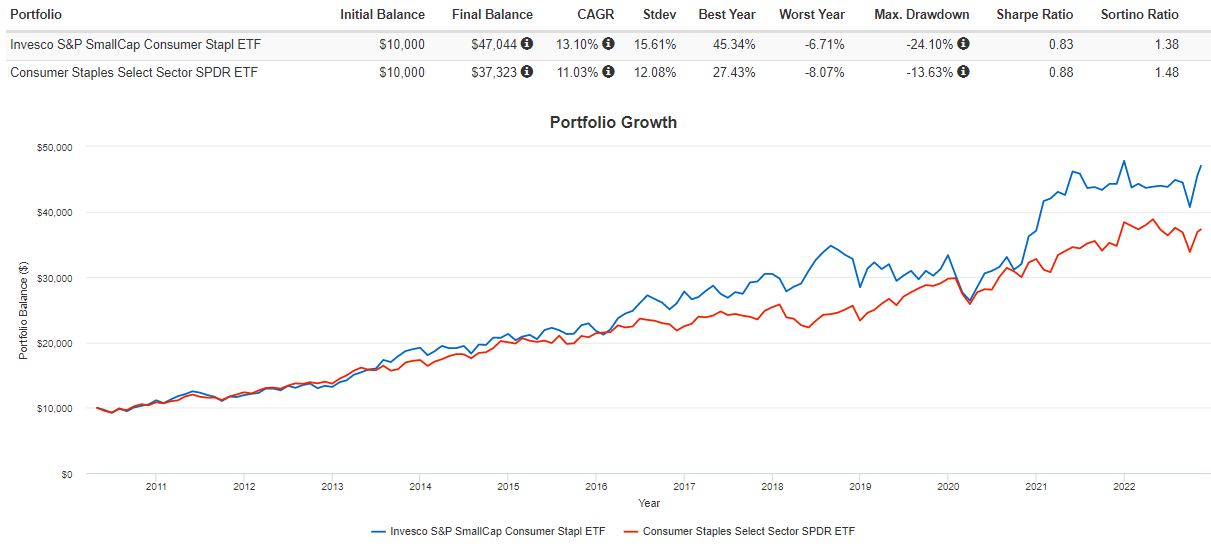
Weaker Profitability, Stronger Momentum
While venturing into the small caps seems wise, a substantial drop in profitability makes these companies less immune to recessions. Based on the table above, any company with a market capitalization above $30 billion looks in good shape, with scores of 8.46, 9.23, and 10.00 corresponding to A-, A, and A+ Seeking Alpha Profitability Grades. However, for the 21 companies with market capitalizations below $30 billion, the average profitability score is just 6.23. If you choose to invest in PBJ, you’re effectively giving up the strength of companies like Procter & Gamble, Walmart, and Costco, for the significant growth opportunities the small caps offer.
Still, I feel good about the momentum of some of PBJ’s lesser-known names. Consider this table of sales and earnings surprises for the top ten over- and underweighted securities relative to XLP.
The Sunday Investor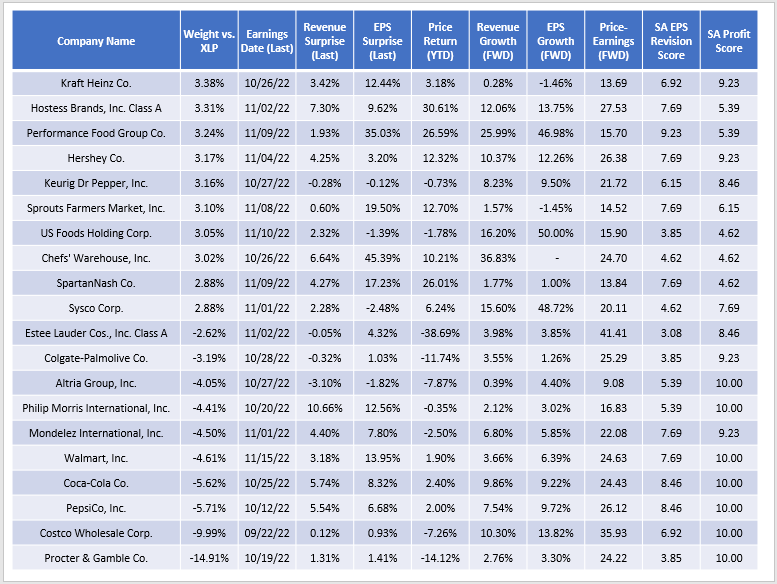
Generally, PBJ overweights stocks with a stronger sales and earnings surprise last quarter, higher growth, and lower price-earnings ratios. In addition, most are positive for the year. For example, Kraft Heinz (KHC) reported a 12.44% earnings surprise after posting better-than-expected organic sales growth and strong pricing power. Hostess Brands (TWNK) recently delivered an 11th consecutive quarter of at least 9% sales growth despite flat volume, demonstrating how well the company can protect its margins.
In contrast, PBJ’s largest underweighted stock, Procter & Gamble (PG), is down 14.12% YTD, has an estimated 3.30% earnings growth rate and trades at an above-average 24.22x forward earnings. The company has also successfully passed on additional costs to its customers, but its 14.91% weighting in XLP is too much. Besides, the company has yet to deliver a “shock” earnings surprise since Q3 2020, and I think the lack of enthusiasm among analysts is contributing to the stock being underwater this year.
Seeking Alpha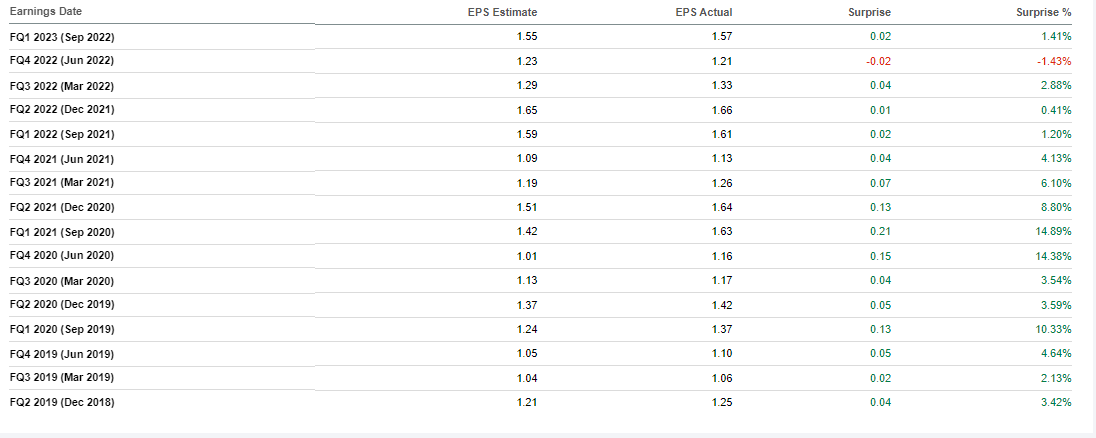
Investment Recommendation
PBJ trades at a lower premium than market-cap-weighted funds like XLP and VDC. Therefore, it’s better diversified by size, which has proven beneficial in the Consumer Staples sector. In addition, the estimated growth of some small- and mid-cap names is exciting, and this segment appears to have a lot of momentum. My concern is that its lower profitability score will hurt PBJ in the long run, especially if we enter a recession. However, I think it can squeeze out at least another quarter of outperformance, and therefore, I see no reason to change my buy rating from January, April, and September. Thank you for reading, and I look forward to any comments below.
Be the first to comment