

JasonDoiy
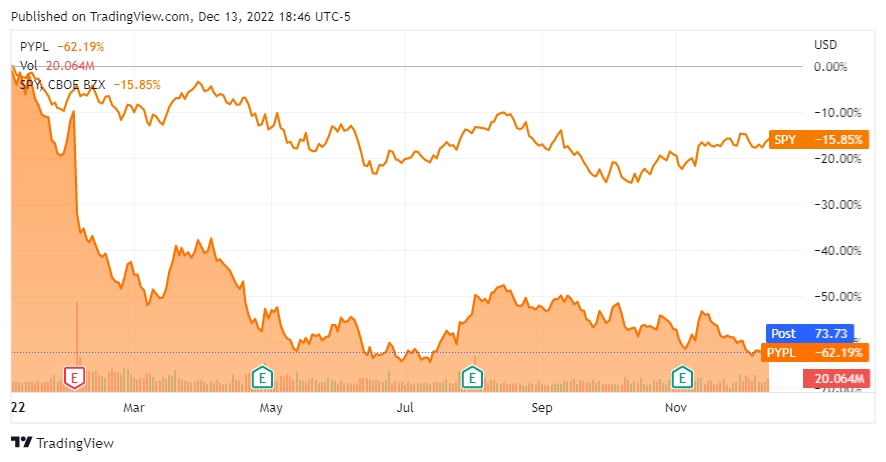
2022 has been a dismal year for investors. With just over 2 weeks left, the S&P 500 has declined by -16.17% YTD; at several points, its losses exceeded -25%. Many companies have fared worse than the S&P, and some have seen over half their market caps vanish. We are now in the thick of tax loss harvesting season, and many investors are positioning themselves for 2023. Many companies could catch a bid if the market rebounds, but where could the most alpha be captured to compensate for a disappointing 2022? When I think about what could be a top pick for 2023, I look for companies that have declined more than the markets, are a household name, the downside looks to be overdone, their valuation looks unjustified, and a rotation back into their sector could occur if the markets move upward. I am less likely to consider companies that have worked in 2022, such as Exxon Mobil (XOM) or Chevron (CVX), because while they could continue to appreciate, a lot of the upside is already baked into the share price. After building a valuation model and going through many sets of financials, PayPal (NASDAQ:PYPL) has become a top pick in 2023 for me. I do not own shares of PYPL, and my thesis has no bias. PYPL has declined by -62.19% in 2022 and is roughly -76.11% off its 2021 highs. PYPL is an absolute profit center, printing billions in net income and free cash flow (FCF). Based on a valuation methodology I built, PYPL looks to be undervalued by -37.03%, and if the market turns and a rotation into tech happens, PYPL could easily go up 50% or more in 2023.
Seeking Alpha
Establishing a baseline for valuations and determining a realistic fair value
Everyone has an opinion, and investor sentiment is often based on what a company could accomplish in the future. Investors gravitate toward technology companies because they are often disruptors with the largest total addressable markets (TAM). How often have you heard investors justify an investment based on capturing a percentage of the TAM? The days of cheap money are over, and the rising rate environment is likely to extend into 2023, so I am looking for established companies with proven track records rather than companies that may need several years for their potential to unfold. I formulated a numbers-driven approach and took the emotion out of the equation to establish a fair value baseline.
The numbers found within financial statements can’t be manipulated, but that doesn’t mean an investor’s viewpoint can’t be skewed or incorrect. Some of the more common valuation tools investors use to determine if there is an opportunity in a specific stock are price to earnings (P/E), price to sales (P/S), enterprise value to earnings before interest, taxes, depreciation, and amortization (EV/EBITDA), and enterprise value to revenue (EV/Revenue). Nothing is ever 1:1, and investors try to justify larger multiples based on growth rates of specific metrics, yet there has never been a universal valuation metric that hasn’t been accepted without a rebuttal. I have come to the conclusion that many investors, including myself, have valued stocks incorrectly to fit a personal investment thesis and look toward others for reinforcement that our narrative is correct. This is why I started reverse-engineering and deconstructing the market caps of the largest companies in the market. I wanted to see how much of a true discount or premium to a company’s market cap there was using a universal methodology.
In many cases, the market isn’t rational, as companies appreciate to unthinkable levels while others decline to levels investors would have never anticipated. Putting market and investor sentiment aside, the numbers are the numbers, as $1 of revenue and $1 of Free Cash flow [FCF] equals $1 of revenue and $1 of FCF regardless of the company’s name or sector it does business in. Every investment is the present value of all future cash flow. Therefore, as an investor, I factor into my investment thesis a company’s FCF valuation. I have discussed FCF for years because I feel one of the most important valuation metrics is the FCF to Market Cap multiple a company trades at. Coincidently this hasn’t been a widely discussed valuation metric. FCF represents a company’s cash after accounting for cash outflows to support operations. I like to use this metric rather than net income because FCF is a measure of profitability that excludes the non-cash expenses and includes spending on equipment and assets. It’s also a harder number to distort or manipulate due to how companies account for taxes, and other interest expenses. This is also the pool of capital companies utilize to pay back debt, reinvest in the business, pay dividends, buy back shares, and make acquisitions.
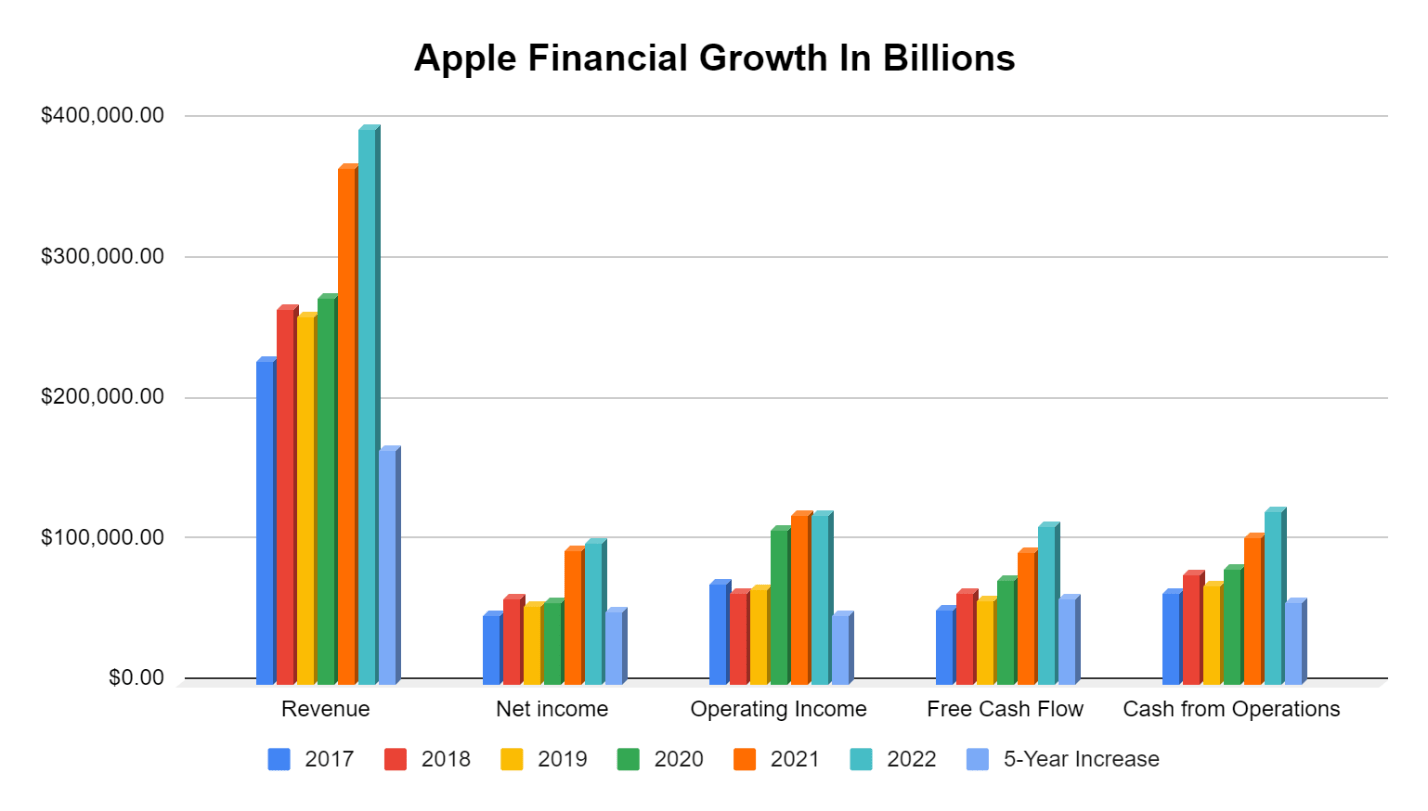
My valuation theory is that we should look at every company the same way and implement the same baseline to establish an initial valuation. Ultimately, every company is in the business of generating profits, and $1 of profit is $1 of profit regardless of the sector in which a company conducts business. My baseline valuation formula is simple, 20x the FCF plus the equity on a company’s balance sheet. I arrived at this valuation model by breaking down Apple (AAPL) and using it as the benchmark. I chose to deconstruct AAPL for the benchmark because it’s the most profitable company, as it generated $99.8 billion in net income and $111.44 billion in FCF in its 2022 fiscal year. Over the previous 5-years, Apple has produced $1.56 trillion in revenue, $400.78 billion in FCF, and $366.68 billion in net income. Over the past 5-years AAPL’s revenue has grown by $165.09 billion (72.02%), FCF by $59.67 billion (115.25%), and its net income by $51.45 billion (106.41%). No other company has accomplished what AAPL has achieved, so there is an argument to be made that no company should trade at a larger valuation multiple than AAPL. Today Apple has a $2.3 trillion market cap and is the largest publicly traded company in the world. It would be hard to agree that Apple isn’t the standard, considering it represents the largest position in the S&P 500 at 6.51% (SPDR S&P 500 Trust ETF Holdings) and is the most profitable company in the market. If Apple is the standard, then this would be a very accurate methodology for its market cap:
- Apple Market Cap $2,314,152,781,119
- Apple current total equity $50,672,000,000
- Apple 2022 FCF $111,443,000,000
- FCF multiple of 20 = $2,228,860,000,000
- (FCF $111,443,000,000 x 20) + $50,672,000,000 of total equity = $2,279,532,000,000
- Apple trades at a 1.52% premium to 20x its FCF plus total equity
- $2,314,152,781,119 – $2,279,532,000,000 = $34,620,781,119 or 1.52%
Steven Fiorillo, Seeking Alpha
Why PayPal is a top pick in 2023 for me
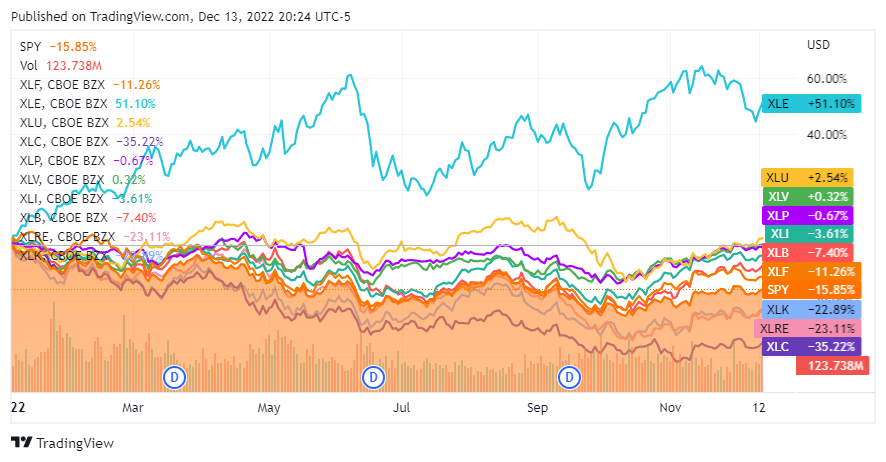
I first established which sector I thought money would rotate into if the market were to rally. I compared SPY to the SPDR Sector ETFs to see which sectors had underperformed the market in 2022. The Technology Select Sector SPDR Fund (XLK), The Real Estate Select Sector SPDR Fund (XLRE), and The Communication Services Select Sector SPDR Fund (XLC) underperformed the market while the SPDR select sector funds in Energy, Utilities, Health Care, Consumer Staples, Industrials, Materials, and Financials have all outperformed the S&P in 2022. Out of Technology, Real Estate, and Communications, I believe we will see the largest rotation into technology if the markets rally in 2023, therefore I want to look at the most popular technology companies and see which are the most undervalued.
Seeking Alpha
I selected 17 of the largest, most well-known technology companies for this comparison. I didn’t want anyone to believe I was picking specific companies to make PYPL look better so I selected a wide range of companies which includes:
- Apple (AAPL)
- Microsoft (MSFT)
- Alphabet (GOOGL)
- Amazon (AMZN)
- Tesla (TSLA)
- NVIDIA Corporation (NVDA)
- Meta Platforms (META)
- Broadcom (AVGO)
- Oracle Corporation (ORCL)
- Cisco Systems (CSCO)
- Texas Instruments (TXN)
- Adobe (ADBE)
- International Business Machines (IBM)
- Salesforce (CRM)
- Intel Corporation (INTC)
- PayPal (PYPL)
- Shopify (SHOP)
Steven Fiorillo, Seeking Alpha
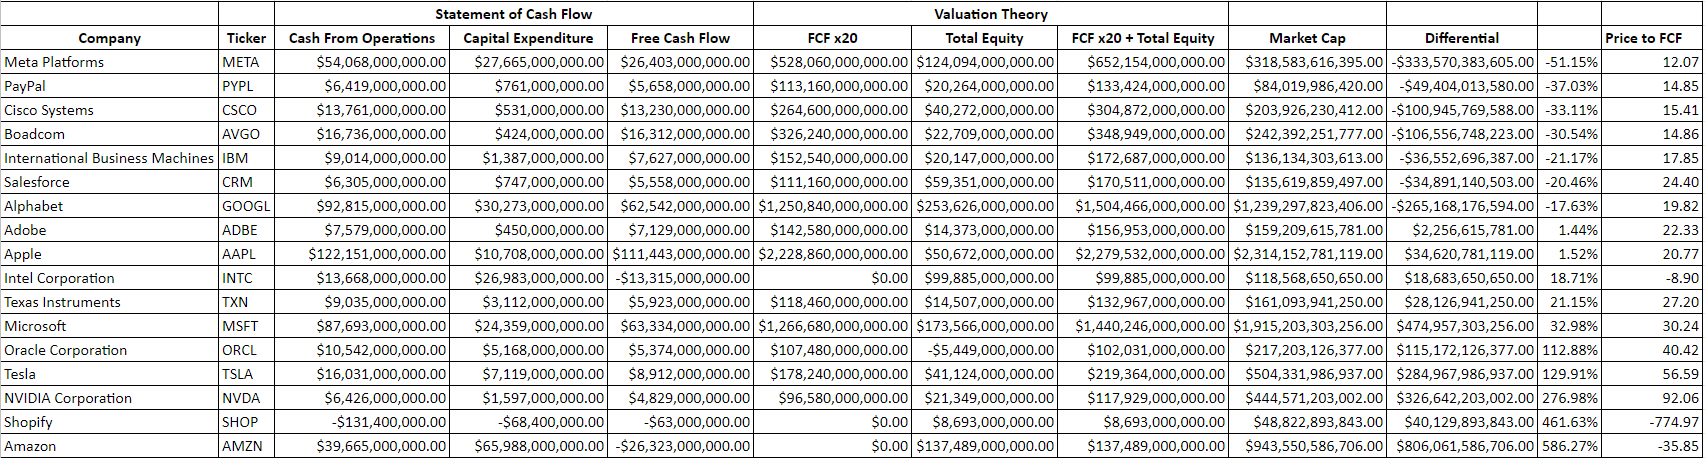
Based on my baseline valuation methodology of 20x FCF + total equity, only 2 companies looked fairly valued: AAPL at a 1.52% premium and ADBE at a 1.44% premium. There were 7 companies that traded at a discount to my methodology of 20x FCF + total equity: META, PYPL, CSCO, AVGO, IBM, CRM, and GOOGL. There were 8 companies that traded at a premium to my methodology of 20x FCF + total equity: INTC, TXN, MSFT, ORCL, TSLA, NVDA, SHOP, and AMZN. There were 3 companies (INTC, AMZN, SHOP) that have generated negative FCF over the trailing twelve months (TTM), so I assigned a value of 0 to their FCF x 20 column. This is why those cells are blank in the table above. When I think about it, 7 companies trading at a discount, 8 at a premium, and 2 relatively flat to the baseline methodology seem pretty logical as it’s a fairly even proportion on both sides of the spectrum. I purposely picked an odd number to see if there would be an even number of companies discounted or with a premium to AAPL’s valuation and even though ADBE trades at a 1.44% premium, its lower than AAPL’s, which does in fact place 8 companies with a lower valuation multiple and 8 companies with a larger valuation multiple than AAPL.
The two companies that trade at the deepest discounts to my 20x FCF + total equity valuation are META and PYPL. While I am a shareholder of META and believe its undervalued, there is too much of a negative stigma around the company as investors are split on the relevance of the Metaverse for it to be a top pick over PYPL. PYPL has a market cap of $84.02 billion with $20.26 billion in total equity on the balance sheet, and it generates $5.66 billion in FCF. PYPL is trading at a -37.03% discount to its total equity + 20x its FCF. On a pure price-to-FCF basis, PYPL is trading at 14.85x its FCF. When I look at some of the other big tech companies, TSLA trades at 56.59x its FCF, NVDA trades at 92.06x, ORCL trades at 40.42x, and MSFT trades at 30.24x its FCF.
ORCL has generated roughly the same amount of FCF as PYPL in the TTM. ORCL has produced $5.37 billion, while PYPL has generated $5.66 billion of FCF. ORCL actually has negative equity on its books as its liabilities exceed its assets. PYPL has generated $284 million more in FCF, and has $20.64 billion in equity on the books compared to -$5.45 billion for ORCL, yet, ORCL has a market cap of $217.20 billion compared to $84.02 billion for PYPL. These valuations do not make sense considering the idea of business is to generate profits, and there isn’t a premium associated with the FCF that ORCL generates compared to PYPL.
Based on this methodology, some companies are overvalued, and some are undervalued. Regardless if you agree with my logic, I reverse-engineered AAPL’s market cap very accurately, and a number that can’t be distorted is the price to FCF multiple a company trades at. PYPL trades at a 14.85x price to FCF multiple, while there are other tech companies that have been given valuations between 40-92x. I would rather pay 14.85x for PYPL’s FCF than 92.06x for NVDA’s or 40.42x for ORCL’s.
Steven Fiorillo, Seeking Alpha
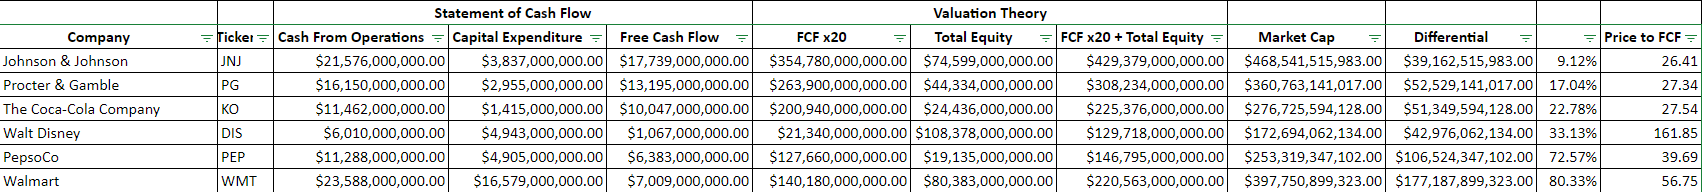
Next, I looked at classic blue chips, which include Johnson & Johnson (JNJ), Procter & Gamble (PG), The Coca-Cola Company (KO), Disney (DIS), PepsiCo (PEP), and Walmart (WMT). If there is a rotation into tech, I wanted to see how these classics, which seem to have worked out well in 2022, are currently valued. Not even one of these trades at a discount to my total equity + 20x FCF methodology, and the premiums range from 9.12% to 80.33%. These companies also trade in a range of 26.41x – 161.85x on a pure price to FCF methodology. If a sector rotation occurs, undervalued tech companies and these classic blue-chips could invert on the valuations as money comes out of one sector and flows into tech. PEP, for instance, trades at a 72.57% premium to my total equity + 20x FCF methodology and at a 39.69x price to FCF multiple. In a tech-led rally, PYPL could certainly catch a bid and trade at the same valuation as some of these blue-chips.

Steven Fiorillo, Seeking Alpha
The last comparison I looked at was PYPL compared to Mastercard (MA) and Visa (V). Interestingly enough, V trades at a 2.06% premium to my total equity + 20x FCF methodology and at 22.44x its FCF, which is very close to the baseline. MA trades at a 31.65 price to FCF and at a 53.68% premium to my baseline methodology. If the markets rally, there is no reason why PYPL wouldn’t trade closer to the baseline. While V and MA both generate more FCF than PYPL, you’re paying a much better price for the FCF that PYPL generates today, indicating that there is much more upside for PYPL than V and MA based on the current valuations.
No matter which group I compare PYPL to, it looks misvalued. I think this numbers-driven approach indicates that PYPL should trade at least 37.03% higher, and based on some of the valuations we are seeing, an argument could be made that PYPL deserves to trade at a premium. If a sector rotation occurs, investors will look for great tech companies that are producing large amounts of FCF that look undervalued. PYPL has brand recognition, it’s an established company, and investors remember it trading at much larger share prices which makes me believe they will see it as a value play and allocate capital toward PYPL thinking that there is a large amount of alpha to be generated.
After determining PayPal looked massively undervalued from a valuation standpoint, I conducted further research and concluded they could still see YoY growth in many areas.
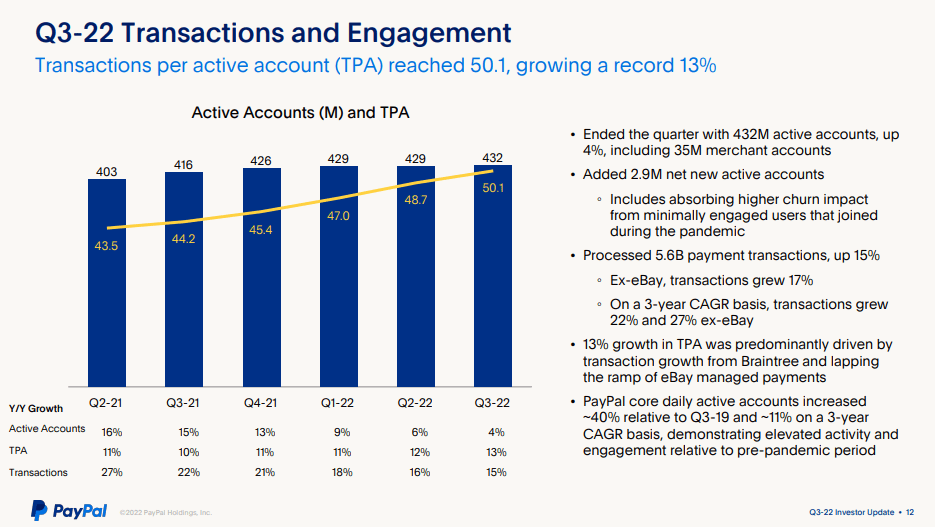
PYPL has become synonymous with digital transactions. There are currently 432 million active accounts, including 35 million active merchant accounts. These aren’t accounts that remain idle. In Q3, the payments per active account averaged 50.1, which was a 13% YoY increase. PYPL achieved $337 billion of total payment volume in Q3, a 3-year spot CAGR of 24%. In Q3, PYPL generated $6.85 billion in revenue, $1.08 non-GAAP EPS, and $1.8 billion in FCF. PYPL’s FCF grew 37% YoY and had a 26% margin based on Q3 revenue. This is the highest level of organic quarterly FCF in PYPL’s history, driven by higher cash earnings.
PayPal
The question is can PYPL continue to grow and drive revenue higher? Management seems to believe so. Next year U.S customers will be able to add their PayPal and Venmo network-branded credit and debit cards to their Apple wallet and use them online and in-store wherever Apple Pay is accepted. This is expected to occur in the first half of 2023, which should increase PYPL’s transactional volumes. PYPL is also ramping up pay with Venmo on Amazon (AMZN), a partnership that should drive higher revenue. In addition to PYPL’s growth initiatives, they are also on track to increase margins by eliminating $900 million as cost savings across operating and transaction expenses this year, and at least $1.3 billion in cost savings next year. PYPL has projected that it will grow its YoY non-GAAP operating margin in Q4 to approximately 22.5% and deliver at least 100 basis points of operating margin expansion in 2023.
PYPL has continued to grow its revenue YoY, and over the past 5-years, its revenue has increased by 106.61% as it added $13.96 billion in annualized revenue. One aspect that Warren Buffett would love is that PYPL meets his 40% gross profit rule. If you read Warren Buffett and the Interpretation of Financial Statements on page 34 of the Kindle edition it says:
“As a very general rule (and there are exceptions): Companies with gross profit margins of 40% or better tend to be companies with some sort of durable competitive advantage. Companies with gross profit margins below 40% tend to be companies in highly competitive industries, where competition is hurting overall profit margins (there are exceptions here, too).
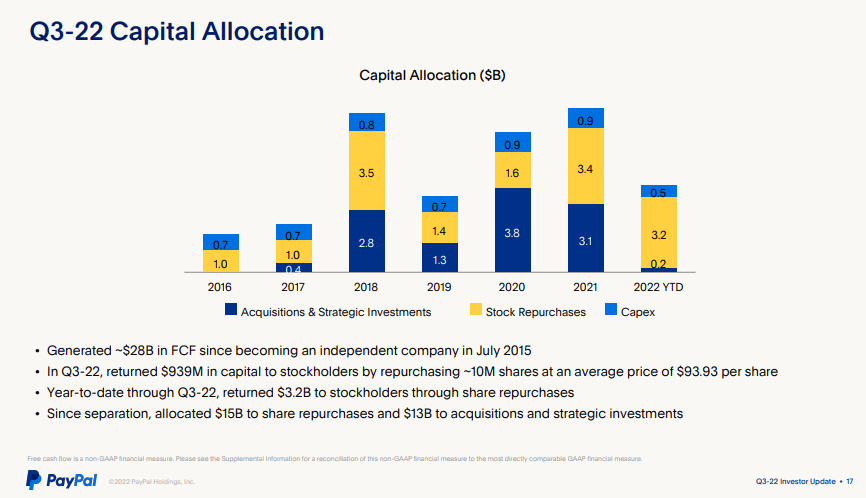
Over the past 5-years, PYPL has maintained a gross profit margin that has exceeded 40%. In the TTM, PYPL has a gross profit margin of 42.9%, as they have produced $11.61 billion of gross profit. These high margins have led to billions in FCF and net income. PYPL has been a cash cow and cumulatively has generated $24.1 billion in FCF and $15.19 billion in net income over the last 5-years. In the TTM, PYPL has produced its largest amount of FCF with $5.66 billion and $2.3 billion in net income. While PYPL’s share price has declined, PYPL has continued to return capital to shareholders through buybacks, as they have allocated $15.1 billion toward buybacks over the past 7 years. Cumulatively PYPL has reduced its shares outstanding by 82.7 million (6.76%) since the close of 2015. PYPL has had a favorable capital allocation plan as it’s increasing the ownership for shareholders through buybacks while allocating billions toward acquisitions and strategic investments to drive revenue growth. I am expecting that PYPL will continue its YoY revenue growth trends which will lead to increased FCF, and eventually the market will realize its shares are trading at a discount.
PayPal
Conclusion
I believe PYPL is a top pick for capital appreciation in 2023. If the market rallies I believe we will see a sector rotation into technology as investors look to make up for 2022’s lost gains. If this occurs, the beaten-up tech stocks could attract much of the incoming capital. PYPL is in a prime position to benefit as it declined by -62.19% in 2022 and is roughly -76.11% off its 2021 highs. When I looked at 17 of the largest tech companies and compared them using the same valuation method, PYPL looked to be undervalued by -37.03%. Regardless of its share price declining, PYPL continues to make key strategic investments, form transformational partnerships, and drive revenue and FCF growth. PYPL has allocated more than $15 billion toward buybacks, and management has a proven track record of delivering on their operational goals. I believe PYPL could be one of the biggest winners in 2023, and I wouldn’t be surprised if shares appreciate by at least 30% if the bear market goes back into hibernation.
Editor’s Note: This article was submitted as part of Seeking Alpha’s Top 2023 Pick competition, which runs through December 25. This competition is open to all users and contributors; click here to find out more and submit your article today!
Be the first to comment