

Darren415
This article was first released to Systematic Income subscribers and free trials on July 28.
As we discussed recently, the PIMCO Dynamic Opportunities Fund (PDO) has raised its distribution which has caused it to outperform within the PIMCO taxable suite. In this article we discuss some of the key similarities between the PIMCO Access Income Fund (NYSE:PAXS) and PDO and how PAXS could very easily follow in the PDO footsteps. PAXS has been growing its leverage level and, given its lowest NAV distribution rate in the suite, has seen its coverage and UNII levels rise sharply. This tells us that PAXS is likely to also raise its distribution rate as PDO has done recently. This should also allow its discount to compress towards the rest of the PIMCO suite, creating a performance tailwind.
Structural Similarities
Both PDO and PAXS are relatively new funds. The tendency has been for PIMCO to charge a higher management fee on newer funds and this is reflected in the suite. PAXS has the highest fee while PDO has the second highest (PDO used to share the 1.15% fee with PDI but PDI shaved 0.05% off its fee as a sweetener to get the PCI/PKO merger through).
Systematic Income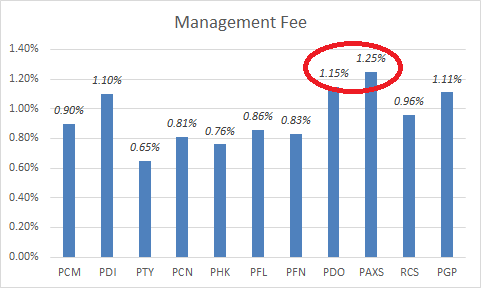
Being new funds, PDO and PAXS have less conviction from investors. This is likely because of their short track record. And, given the unfortunate timing of their launches, whatever track records they do have are pretty poor even if their performance is not very dissimilar to other PIMCO CEFs. Lock-up expirations have also likely kept pressure on the two funds. These three factors mean they tend to trade at significantly wider discounts in the PIMCO taxable suite.
Systematic Income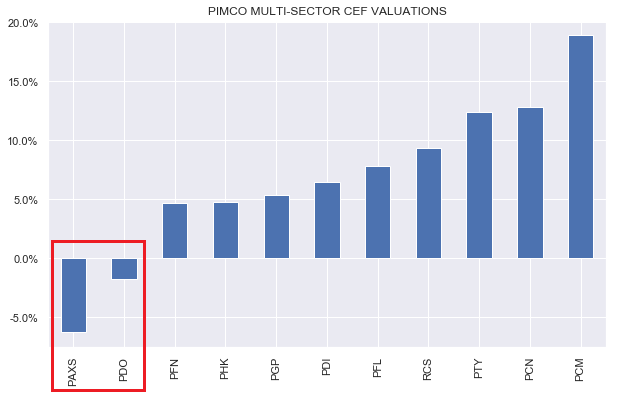
The fact that they trade at wider discounts doesn’t automatically make them more attractive, however. To gauge that we need to do some algebra to check whether their wider discount is wide enough to offset their higher fees which we do in a section below.
PDO and PAXS are also the only term funds in the PIMCO suite of CEFs. Term funds have a planned termination date. Having a term feature provides potential upside for investors if the fund trades at a discount and either terminates or gives investors an exit at the NAV via a tender offer.
The chart below from our service CEF Tool shows the sub-sector allocations of the PIMCO taxable CEF suite. We see that PDO and PAXS have fairly similar allocations. Unlike RCS and PGP they don’t have a lot of agency MBS exposure. Unlike PCM and PDI they are not overweight non-agency MBS. And unlike the rest of the suite they have a lower allocation to HY credit and a greater allocation to CMBS.
Systematic Income CEF Tool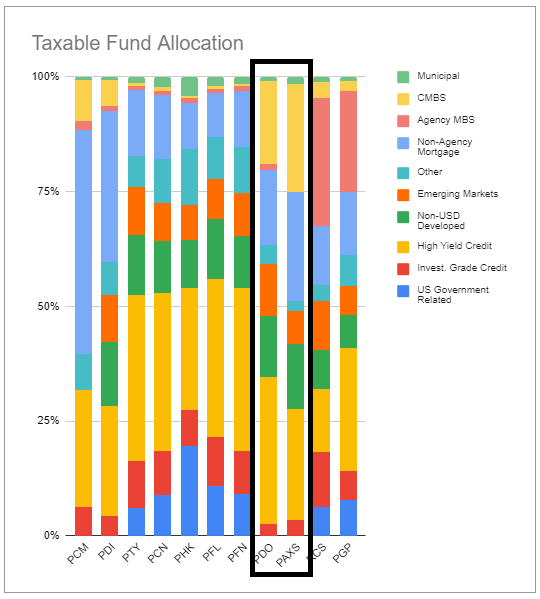
The actual position profiles of the two funds are not identical. For instance, PAXS only has about 20% of the exact same securities as PDO (about 75 of 340). However, clearly, the securities don’t have to be identical to provide a very similar performance profile. The daily NAV correlation of the two funds is on the order of 90% which is high as these things go.
Leverage levels have also been converging as PAXS has continued to add borrowings. We expect the leverage levels of the two funds to equalize over the next few months.
Systematic Income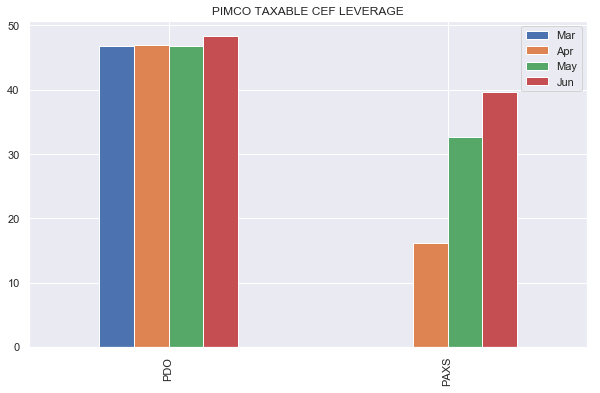
Income Profile
PAXS is not yet old enough to feature official 6-month distribution coverage – our favorite metric – for the simple fact that bonds tend to pay semi-annual coupons and the 6-month figure is less noisy. That said, 3-month coverage is not useless and we plot this below. As we can see PDO and PAXS feature the highest coverage level.
Systematic Income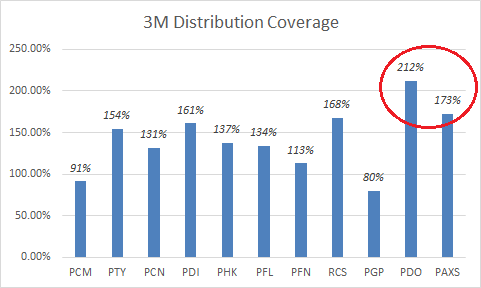
This is really a function of their lowest NAV distributions.
Systematic Income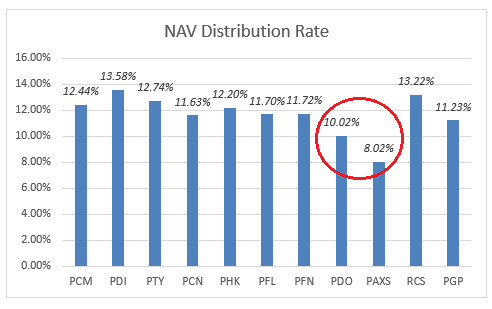
The two funds also feature high UNII levels. Recall, that UNII is a cumulative since-inception concept so the fact that PAXS already has the fourth highest UNII level, even before it has fully scaled up its leverage, speaks to the fact that its low NAV distribution rate will allow it to maintain very high coverage and UNII levels in the future. It also clearly suggests that PAXS is very likely to increase its distribution down the road just as PDO has recently. Overall, the distributions between these two funds and the broader taxable suite will continue to converge from both ends.
Systematic Income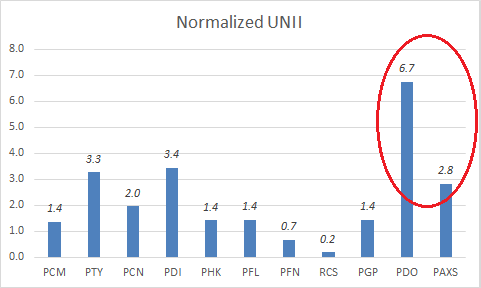
Valuation Profile
This is how the discounts of the two funds have traded relative to each other. Initially, PAXS tended to trade at a tighter discount to PDO but that has changed, perhaps, as lock-ups expired and as PDO benefited from its distribution hike.
Systematic Income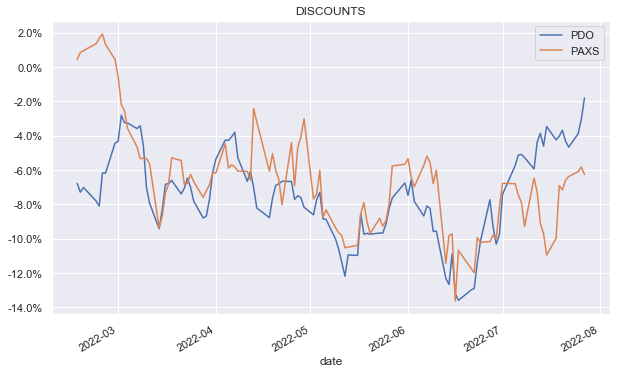
There was an odd spike in volume below which coincided with the sharp widening in the PAXS discount (the dip in the orange line in July above). PDO had a similar volume spike about 6 months after its launch with no noticeable spikes after. This suggests that PAXS is much less likely to see pressure from future lock-up expiries with a more balanced supply/demand picture.
Systematic Income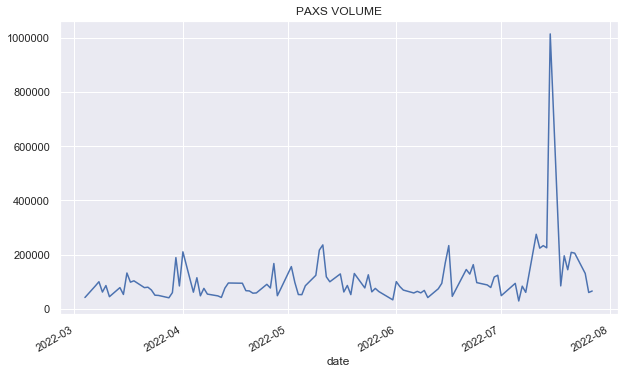
Overall, we expect PAXS to trade at a wider discount relative to PDO for a few reasons. First, as of June it still carries a lower leverage level, meaning it has less income-generating capacity. Second, its management fee is higher so it should, all else equal, trade at a wider discount. And third, its NAV distribution rate is lower.
We expect PAXS leverage to equalize with PDO and we also expect its NAV distribution to rise further, leaving only its higher management fee as a key driver of a wider fair-value discount versus PDO.
To give a sense of how the fund’s valuation and management fee combine in generating a yield on price versus PDO we estimate the yields the two funds can deliver. We assume the two funds carry the same leverage level (they don’t at the moment but we expect they will soon enough). We also assume the two funds have similar underlying portfolio yields of around 8%.
Systematic Income CEF Tool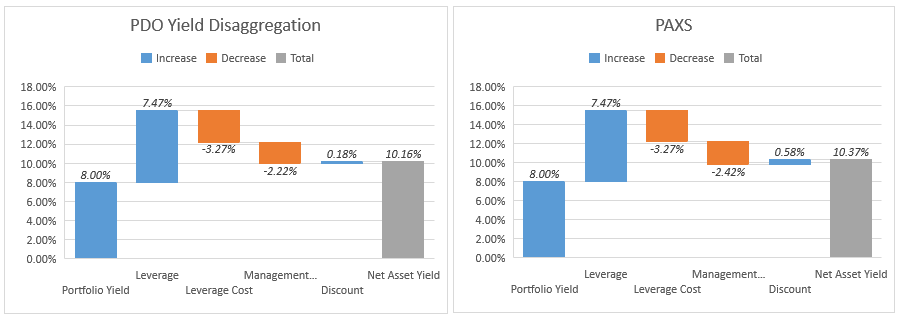
At current underlying asset yields, the discount breakeven between the two funds is 2%. In other words, if PAXS trades at a wider discount than 2% relative to PDO it will generate a higher portfolio yield on price than PDO and vice-versa.
Takeaways
PAXS is very likely to follow a similar distribution coverage and UNII pattern as PDO. Its low distribution rate and quickly-rising leverage level will allow it to significantly outearn its modest distribution, creating the need for both large special distributions as well as eventual distribution hikes in our view. This, along with a more balanced supply/demand picture should allow PAXS to outperform over the medium term. As of this writing PAXS trades at a 4.5% wider discount relative to PDO which will also allow it to generate a higher portfolio yield for investors than PDO once its leverage is fully scaled up, despite its higher management fee.
Be the first to comment