

Scott Olson
It’s been several weeks since Palantir Technologies Inc. (NYSE:PLTR) delivered its Q2 earnings, and I wrote an article (can be read here) on my new concerns as a shareholder. I have read many different articles and listened to several interviews to see how the PLTR community was reacting after its earnings call. If you didn’t read my previous article, I went from being super bullish to lukewarm overnight, as Alex Karp’s (PLTR CEO) commentary didn’t sit well with me.
After digesting different perspectives and watching Alex Karp’s latest interviews about how Wall Street doesn’t understand PLTR, I wanted to take a numbers-driven approach and look at how PLTR compares to its competitors in the application software space. Since 8/15, when my previous article was released, PLTR has fallen -25.87%, while the S&P has declined by -8.41%. I don’t know what the outcome will be of my analysis as I will be writing this article as I build out the overall comparison. I will be comparing PLTR to its peer group across valuation metrics, income statement metrics, cash flow statement metrics, its balance sheet, and margins. At the end of this article, I will discuss if my findings turn me back into a bull or if there are red flags that make me less bullish than its conference call did.
Selecting the Peer Group
To select the peer group with which I would compare PLTR, I looked at the selected peer group for PLTR and Snowflake (SNOW), then selected the following companies for my numbers-driven comparison:
- PLTR
- $15.02 billion market cap
- SNOW
- $54.34 billion market cap
- MongoDB (MDB)
- $16.21 billion market cap
- Splunk (SPLK)
- $14.15 billion market cap
- Tyler Technologies (TYL)
- HubSpot (HUBS)
- $14.94 billion market cap
Excluding SNOW, PLTR and the rest of the peer group are similar sizes in regards to market cap. Let’s see how this analysis turns out and if my opinion on PLTR can get back to a bullish mindset.
Steven Fiorillo, Seeking Alpha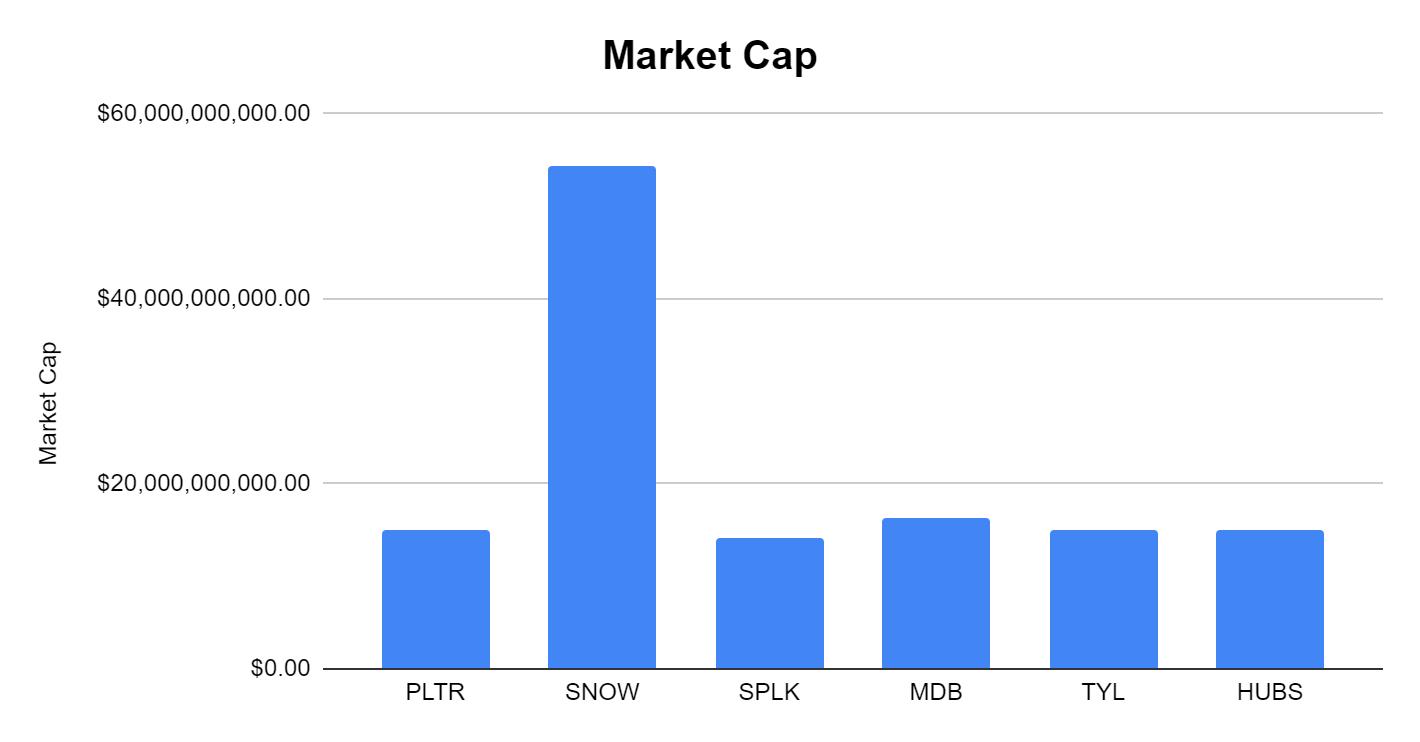
Comparing the Peer Group Against Several Valuation Metrics
To start, I am going to look at the following valuation metrics, Price to Sales (P/S), Price to Earnings (P/E), Price to Free Cash Flow (P/FCF), Equity to Market Cap (E/MC), and Return on Equity (ROE).
Many investors still like to reference the P/S ratio, especially since the only metric that seemed to matter during the growth at any cost phase the markets went through. PLTR is trading at a P/S ratio of 8.47x while the peer group average is 13.01. SNOW trades at the largest P/S ratio of 32.28x, and when this is stripped out, the peer average drops to 9.16x. Compared to its peers, PLTR trades at a lower P/S ratio.
Steven Fiorillo, Seeking Alpha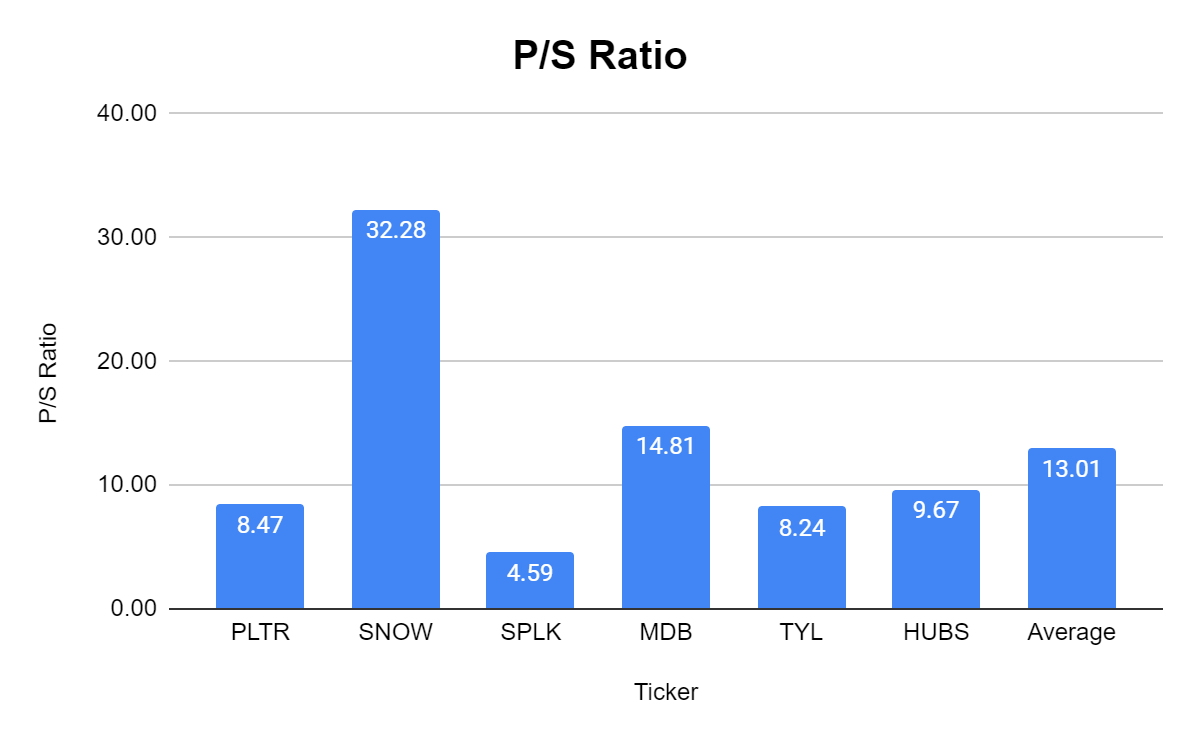
I debated looking at a P/E ratio as you technically can’t have a P/E ratio with negative earnings. The only company in the peer group that has positive earnings is TYL and its P/E ratio is 83.78. I am going to refrain from judgment as this is a high-growth sector that is still forging its paths within the market and will pay more attention to the P/FCF metric.
The P/FCF metric is a longtime favorite of mine that has recently become popular as free cash flow (“FCF”) has become important again. FCF is often looked at as one of the best measures of profitability as FCF excludes the non-cash expenses of the income statement and includes spending on equipment and assets as well as changes in working capital from the balance sheet. To some investors, FCF is more important to analyze than net income because it’s harder to manipulate as it is a true indication of the company’s cash. FCF is also the pool of capital that companies can utilize to repay debt, pay dividends, buy back shares, make acquisitions, or reinvest in the business.
PLTR has generated $260.2 million in FCF in the trailing twelve months (TTM). For investors who follow PLTR and are thinking that this number looks off, you are probably correct. In the PLTR press releases and earnings presentations, they emphasize Adjusted FCF, not pure FCF. I am using straight FCF as my valuation tool. Based on PLTR’s closing market cap, they trade at 57.72x FCF. While SNOW has generated an additional $65.7 million in FCF than PLTR, their valuation is 166.73x FCF. MDB produces negative FCF, so they do not trade at a positive multiple to FCF. Of the 5 companies in this peer group that produce FCF, the group average is a 78x FCF multiple, which PLTR trades under.
|
Price to Free Cash Flow |
|||
|
Ticker |
Market Cap |
Total Free Cash Flow |
Price to Free Cash Flow Multiple |
|
PLTR |
$15,019,776,112.00 |
$260,200,000.00 |
57.72 |
|
SNOW |
$54,336,000,976.00 |
$325,900,000.00 |
166.73 |
|
SPLK |
$14,152,420,668.00 |
$225,000,000.00 |
62.90 |
|
MDB |
$16,211,367,620.00 |
-$27,500,000.00 |
0.00 |
|
TYL |
$15,118,602,889.00 |
$418,100,000.00 |
36.16 |
|
HUBS |
$14,939,736,380.00 |
$224,700,000.00 |
66.49 |
Steven Fiorillo, Seeking Alpha
I like to look at how much equity a company has on its books and look at the equity to market cap multiple to see what type of premium the market is placing on a company’s equity. What I found interesting was that SPLK has -684 million in equity on the books, making them trade at a negative multiple. Excluding SPLK, the peer group trades at an average of 12.79x their equity to market cap. PLTR has a multiple of 6.39x.
Steven Fiorillo, Seeking Alpha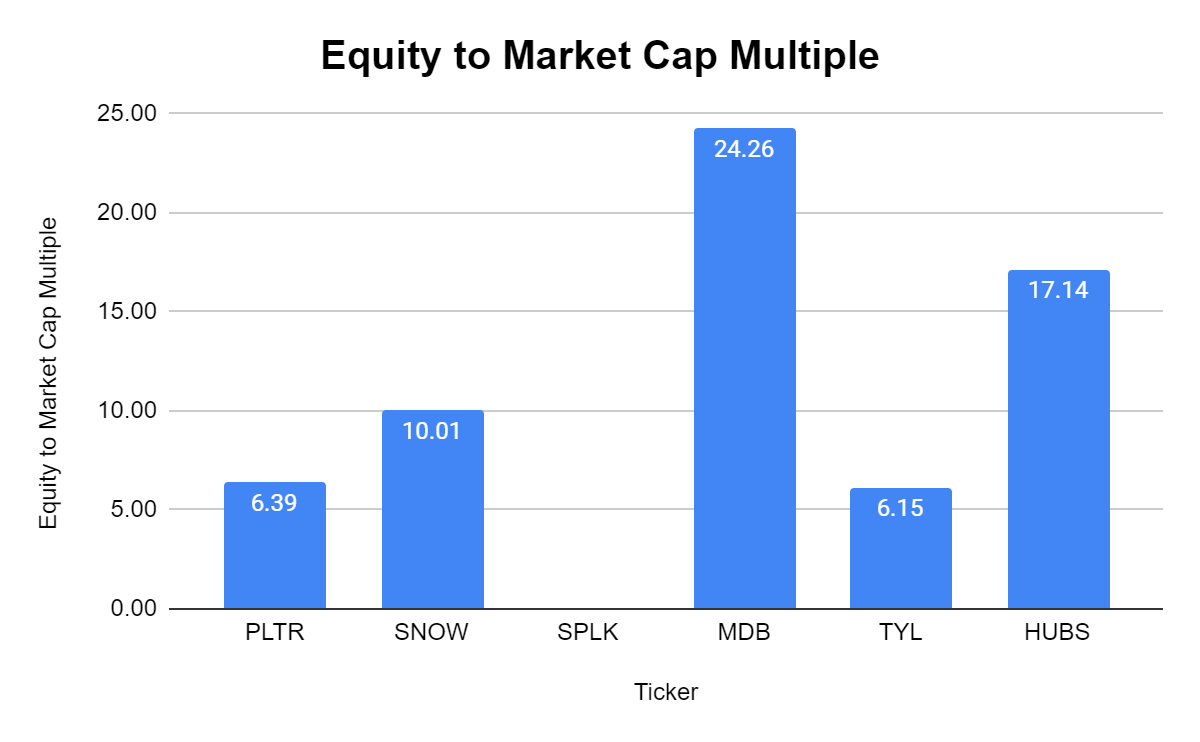
The last valuation metric is ROE, and this is also another one that I was hesitant to add, as many of these companies are considered profitless tech as they don’t produce net income. I added it because 1 company that has a positive ROE, which is TYL, at 7.28%.
Moving to the Income Statement
Next, I want to look at the income statements of each company and review the past three years of growth in revenue, gross profit, and net income. Fiscal year 2019 will be the starting point, and the 3 years of growth will incorporate 2020, 2021, and the TTM for 2022. I am going to look at growth by percentage and by how much the metric grew monetarily.
From a revenue perspective, PLTR has grown by 134.9% over this period, or $1 billion in annual revenue. This is the 3rd largest growth rate as SNOW grew by 518.74%, and MDB grew by 156.7%. From a dollar basis, PLTR grew its revenue by the 2nd largest amount, behind SNOW. Based on these metrics, PLTR generates more revenue now, but there is a chance SNOW will finish 2022 generating more revenue than PLTR.
Steven Fiorillo, Seeking Alpha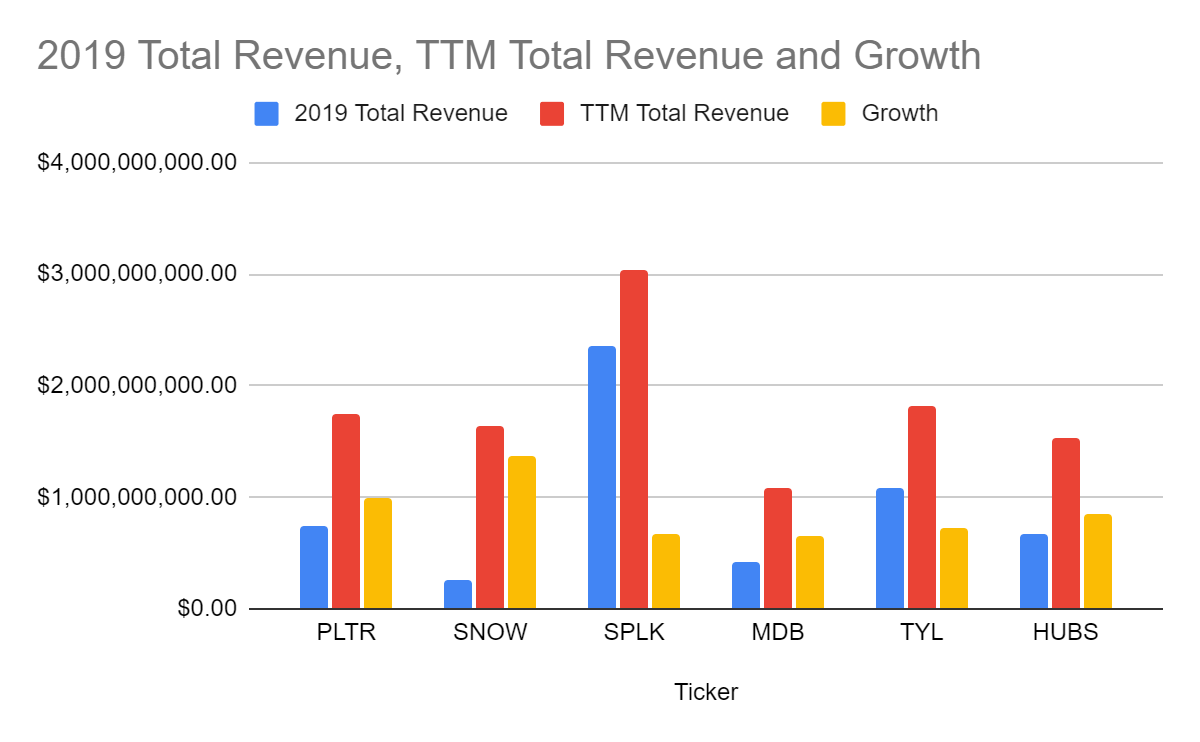
Gross profit is a similar story as PLTR had the 2nd largest growth rate of 174.57% and grew its gross profit by the 2nd largest amount with $873.2 million. SNOW had a growth rate of 616.4% and grew its gross profit by $913.5 million. The average amount of gross profit generated among the peer group was $1.24 billion, and SPLK was the leader, generating $2.25 billion of gross profit. PLTR has generated the 2nd largest amount of gross profit, with the 2nd largest growth rate.
Steven Fiorillo, Seeking Alpha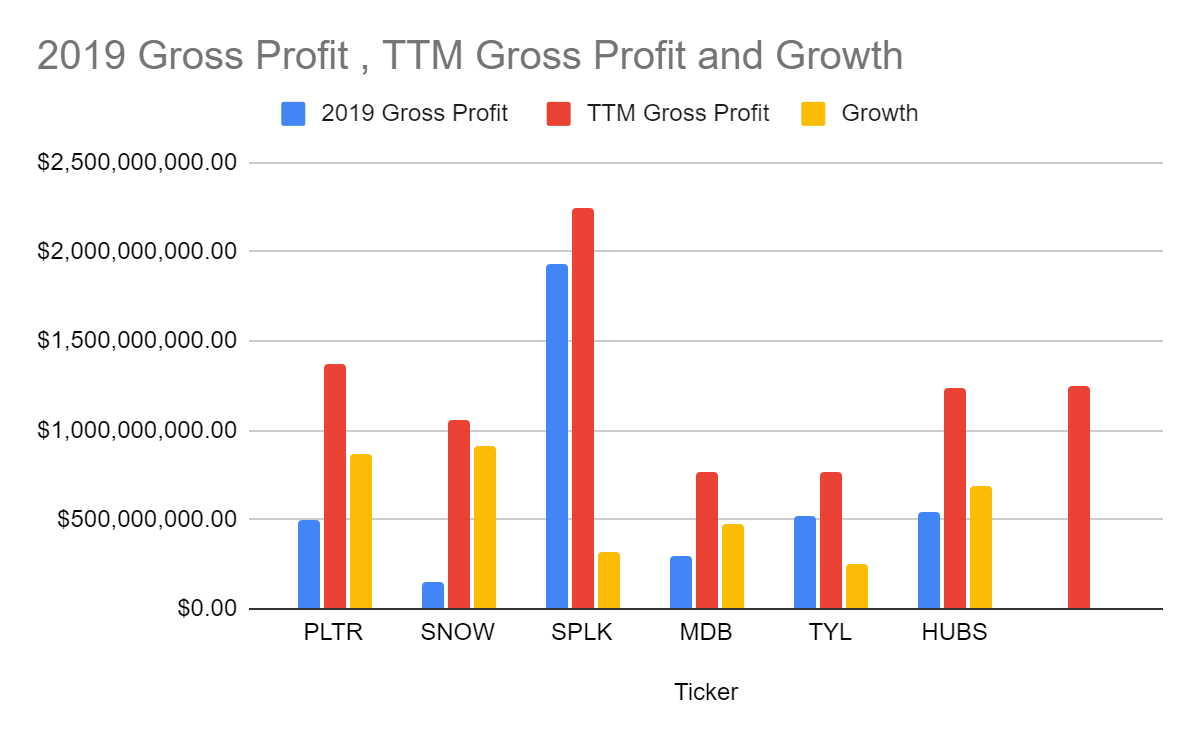
With $1.37 billion of gross profit generated, I want to see what PLTR’s gross profit margin is compared to its peers. PLTR has a gross profit margin of 78.73%, which is the 2nd highest in its peer group behind HUBS. This is also well above the group average of 68.67% and above SNOW’s 64.82%.
|
Gross Profit Margin |
|||
|
Ticker |
Total Revenue |
Gross Profit |
Gross Profit Margin |
|
PLTR |
$1,744,400,000.00 |
$1,373,400,000.00 |
78.73% |
|
SNOW |
$1,637,800,000.00 |
$1,061,700,000.00 |
64.82% |
|
SPLK |
$3,038,700,000.00 |
$2,251,100,000.00 |
74.08% |
|
MDB |
$1,082,500,000.00 |
$771,700,000.00 |
71.29% |
|
TYL |
$1,818,200,000.00 |
$769,200,000.00 |
42.31% |
|
HUBS |
$1,525,900,000.00 |
$1,232,700,000.00 |
80.79% |
While only TYL has generated net income in the TTM, I wanted to see if any of the other companies have closed the gap. From the rest of the peer group, PLTR was the only company that has slightly lost less money, as each of its other peers had expanded their losses.
Steven Fiorillo, Seeking Alpha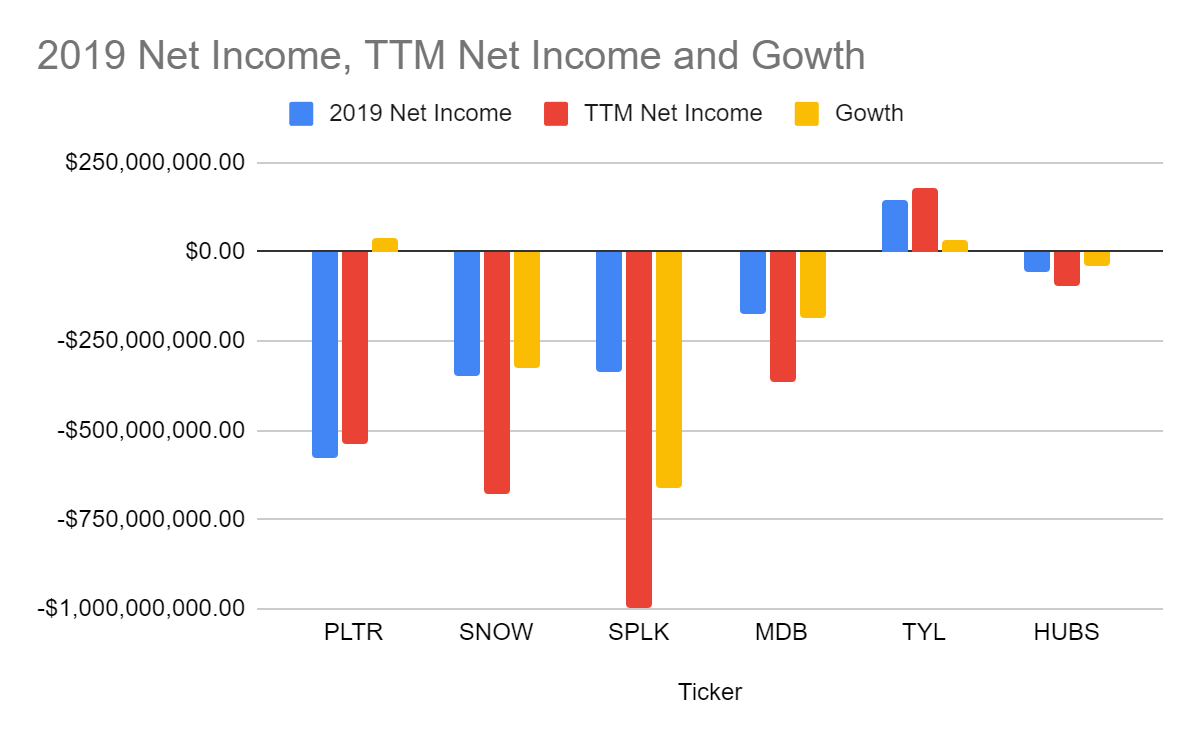
Looking at the Cash Flow Statements
When I look at the cash flow statements, I am looking for 2 things. How much cash from operations is each company producing, and what is their level of FCF? From the peer group, 5 companies generated positive cash from operations. Over the 3-year period SPLK has increased the amount of cash from operations generated by $525.6 million, followed by SNOW with $520 million, then PLTR with $457.3 million. TYL generates the largest level of cash from operations with $450.6 million in the TTM, followed by SNOW with $343.5 million, then PLTR with $292.1 million.
Steven Fiorillo, Seeking Alpha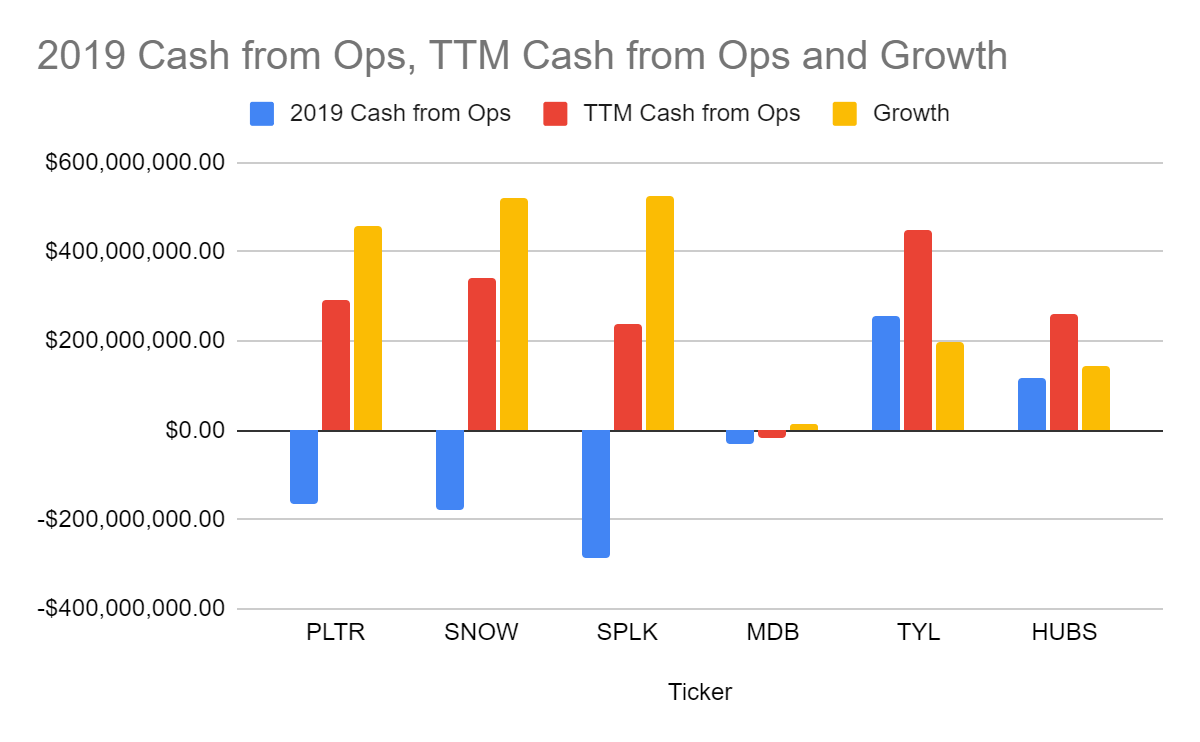
MDB is the only company in the group that generates negative FCF at -$27.5 million. PLTR has gone from -$178.3 million in FCF to $260.2 million, while SNOW has gone from -$195.2 million to $325.9 million in FCF. TYL is generating the largest level of FCF at $418.1 million, but its growth of $200.6 million is less than half of PLTR, SNOW, and SPLK. In the FCF statistic, SPLK has produced the largest level of growth with a $613.7 million swing from -$388.7 million to $225 million of FCF in the TTM.
Steven Fiorillo, Seeking Alpha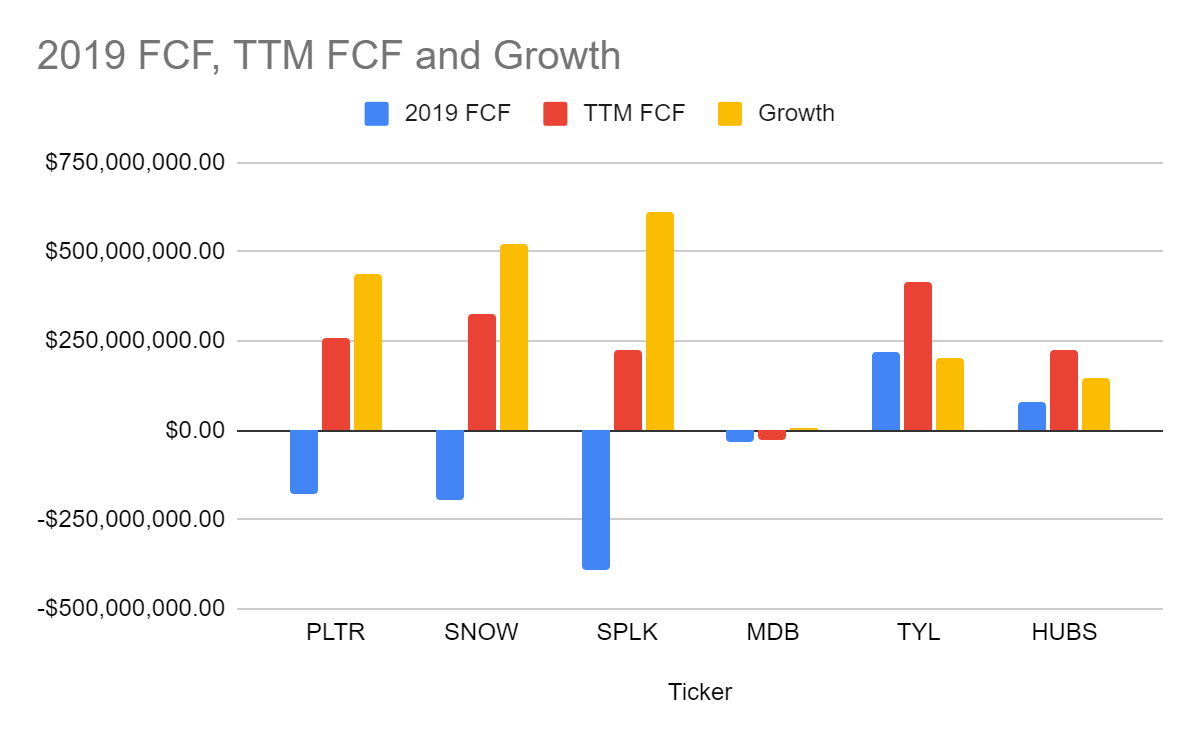
Moving to the Last Financial Statement Piece, the Balance Sheet
Going into the balance sheet, I didn’t want to see large levels of debt for PLTR or its peers since many lose money from a GAAP accounting perspective, even if they are FCF positive. In a rising rate environment, the last thing I want to see is large levels of debt that may be refinanced with a larger interest rate, increasing their operating expenses. PLTR has $2.46 billion of cash on hand between cash and short-term investments, while SNOW has $3.95 billion, SPLK $1.74 billion, HUBS $1.25 billion, MDB $986.5 million, and TYL $287.5 million. PLTR is the only company with less than $1 billion in total liabilities, and its cash to liability ratio is 263.27%. SNOW has the 2nd largest cash-to-liability ratio at 241.37%. This is an interesting metric as PLTR could pay off every liability on its balance sheet and still have over $1.5 billion in cash on the books.
Steven Fiorillo, Seeking Alpha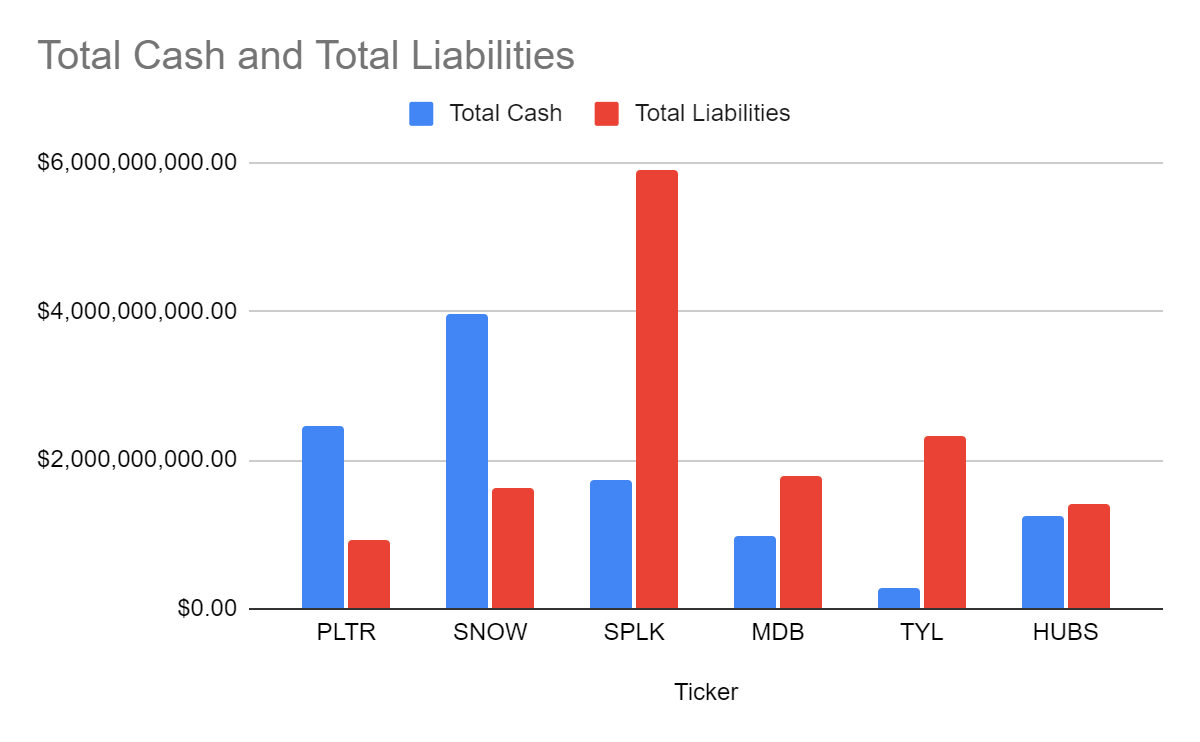
The other metric I am looking at is total FCF to long-term debt. I want to see how many years of current FCF it would take for each company to pay off its long-term debt. PLTR and SNOW have $0 of long-term debt, which puts them in a strong position. SPLK has $3.87 billion of long-term debt, and it would take them 17.2 years to pay it off from the current level of FCF it produces.
Steven Fiorillo, Seeking Alpha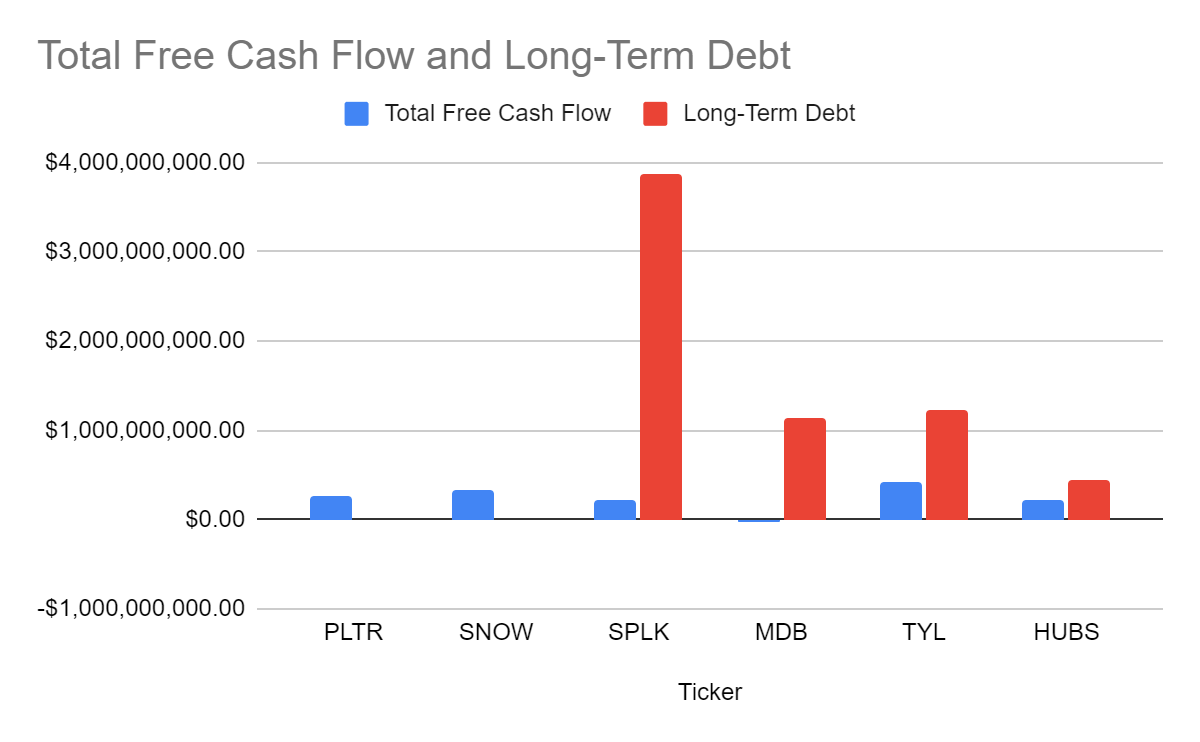
Conclusion: Did Looking at PLTR’s Metrics Compared to its Peer Group Bring Me Back to Bullish?
No, I am not back to being bullish on PLTR just yet, but I am not bearish after comparing its financials to its peer group. I knew going into this investment it was a 5-10 hold, and I was bullish on their technology and future potential. While PLTR is not a new company, they are new to the market and the commercial space as it spent years building out its software as a provider to government agencies. Some may look through these numbers and say PLTR is overvalued since they are not GAAP profitable, but anyone investing in PLTR should understand that this is a company that is still building out its infrastructure, sales team, and onboarding commercial clients.
PLTR certainly is in a good position as its balance sheet is spotless, and they have 263.27% of its total liabilities sitting in cash with $0 in long-term debt. From a valuation standpoint, it’s hard to say PLTR is overvalued as its trading at a multiple of 57.72x FCF. With SNOW trading at 166.73x FCF and an equity multiple of 10.01x, making the argument that PLTR is overvalued is hard. PLTR has a 78.73% gross profit margin and is the only one in its peer group that is slowly narrowing the gap between what its losses were in 2019 to today. PLTR has a strong revenue growth rate of 134.9% over the past 3 years, which is almost 45% annualized. I believe PLTR has tremendous potential, and that’s why I am still in the name.
While conducting this analysis made me feel a bit better, and I do think PLTR is bottoming, I am not becoming bullish again just yet. My previous concerns around stock-based compensation, net dollar retention, and Alek Karp’s commentary negatively impacting PLTR’s image are still causing me to be neutral. I want to see if PLTR’s revenue growth declines in Q3, if their sales team can increase net dollar retention, if the SBC that’s being allocated is motivating the sales teams to close more deals, if more large commercial clients have been added, and most of all if Alex Karp can play the game and deliver what Wall Street wants which remains to be seen.
While I am placing a hold on PLTR again, I am buying shares to lower my cost basis, and I am still giving PLTR a year to turn things around before I have to make some hard choices about whether or not I need to reevaluate my entire investment thesis.
Be the first to comment