

Hiroshi Watanabe
|
1 Year |
5 Years |
10 Years |
20 Years |
|
|
Packer & Co |
-1.2% |
6.2% |
11.2% |
10.7% |
|
All Ordinaries Accumulation Index |
-7.4% |
7.2% |
9.4% |
8.2% |
|
MSCI World Accumulation Index $A |
-6.0% |
10.6% |
14.6% |
6.8% |
The Investigator Trust returned -1.2% for the past year, compared to a -7.4% return for the Australian index and -6.0% for the world market.
Since January world financial markets have been rocked by soaring inflation, rising interest rates, supply shortages, further Covid lockdowns, the war in Ukraine, and a full-blown energy crisis.
With asset markets priced for perfection, these events could not have occurred at a worse time. The most speculative parts of the market have been most damaged. Many hyped up technology stocks have collapsed.
Tech Stock Collapse – % Fall from peak
|
Twitter (TWTR) |
-51% |
|
Alibaba (BABA) |
-63% |
|
Uber (UBER) |
-66% |
|
Spotify (SPOT) |
-73% |
|
Netflix (NFLX) |
-74% |
|
Paypal (PYPL) |
-77% |
|
Lyft (LYFT) |
-80% |
|
Zoom (ZM) |
-81% |
|
Zillow (Z) |
-83% |
|
SNAP (SNAP) |
-84% |
|
Robinhood (HOOD) |
-88% |
Even mega tech stocks such as Facebook (META), Tesla (TSLA) and Amazon (AMZN) have fallen more than 40%.
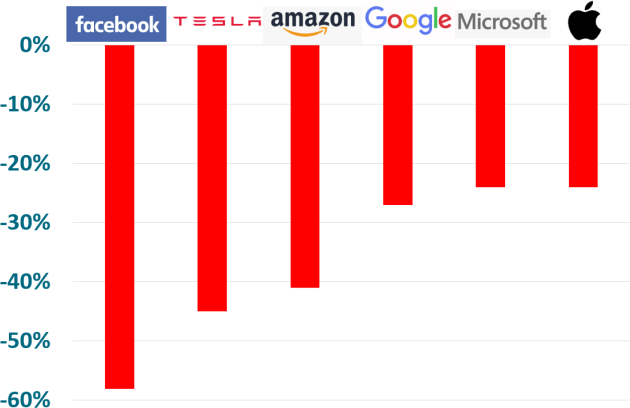
Mega Tech Stocks – % Fall from peak
Similarly, the value of all cryptocurrencies has crashed with the Bloomberg index down 78%.
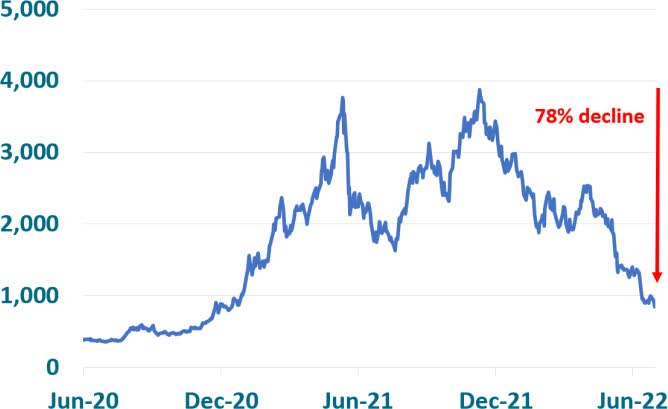
Cryptocurrency Index
The tech-heavy NASDAQ index fell 30% and the S&P500 is down 20% from its December high.
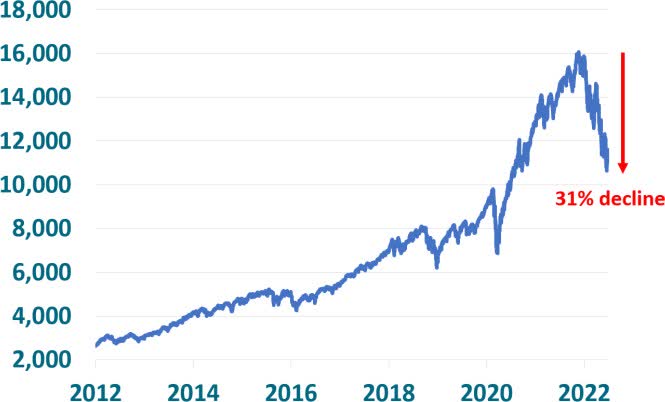
NASDAQ Index
Usually when stocks fall, bonds perform well as investors rush for safety. However due to rising interest rates, bond prices have also fallen significantly, with the global government bond index falling 20% from its peak.
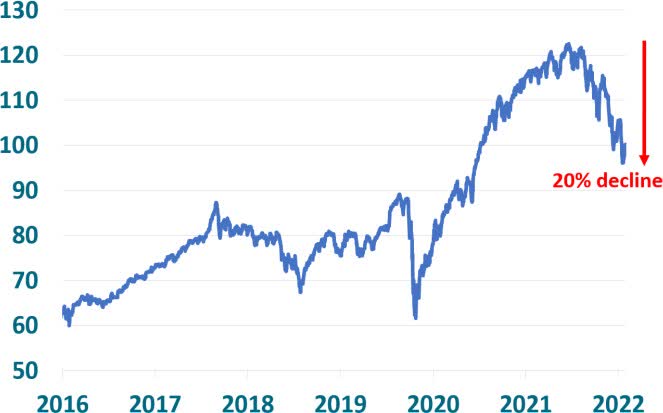
Global Government Bond Index
One of the few strong areas of the stock market has been the energy sector. Over the past twelve months the oil price has soared from US$75 to US$115 a barrel.
Oil Price (US$ per barrel)
The Trust’s two largest holdings, CNOOC (OTCPK:CEOHF) and Hess (HES), are both benefiting from the oil price boom, and they returned more than 20% during the year.
Our Russian energy shares have had a strong year profit wise, however overshadowing that has been the Ukraine war. Due to the restrictions placed by the Russian Government on foreign trading in Russian stocks, international investors have been unable to trade Russian securities since the invasion of Ukraine occurred in February.
The Russian stock market has remained open for domestic investors and stocks on the Moscow Exchange have been turning over in large volumes. Given restrictions on trading for foreigners and in line with the Investigator Trust’s constitution, Packer & Co has engaged an independent valuer to determine an appropriate valuation for our Russian holdings.
The valuer has used a formula based on many factors to determine an appropriate discount to apply to our Russian stocks. As of 30 June, the discount applied was 58%.
As an example, Rosneft (OTCPK:RNFTF) which is Russia’s largest oil company, has had a rollercoaster ride with its share price falling from A$10 to A$3, and has since recovered to A$10. Rosneft is expected to earn a profit of US$26bn this year which means its share price is trading on a Price to Earnings ratio of 2x.
However, after the independent valuer’s 58% discount is applied, we are valuing our Rosneft shares at $4 per share. This puts them on a Price to Earnings ratio of 1x and a dividend yield of 48%.
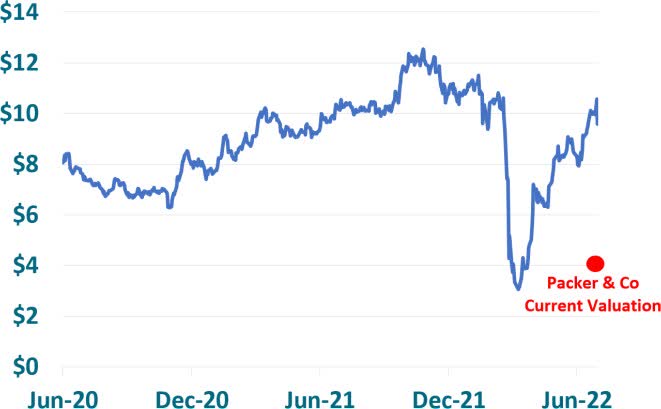
Rosneft Share Price (A$/share)
We expect a discount will be applied against the Trust’s Russian assets until the restrictions are eventually lifted. When this happens is impossible to predict. Western Governments have frozen around $300bn of Russia’s foreign reserves, and we expect any resolution will be part of a broader negotiation between the US and Russian Governments.
There is a common belief that Russia is in an economic bind, however this is not necessarily the case. Russia has one of the lowest levels of public debt in the world, and its exports are booming due to soaring energy prices. Helped by its strong trade position, the Russian rouble has surprisingly been the world’s strongest performing currency over the past year.
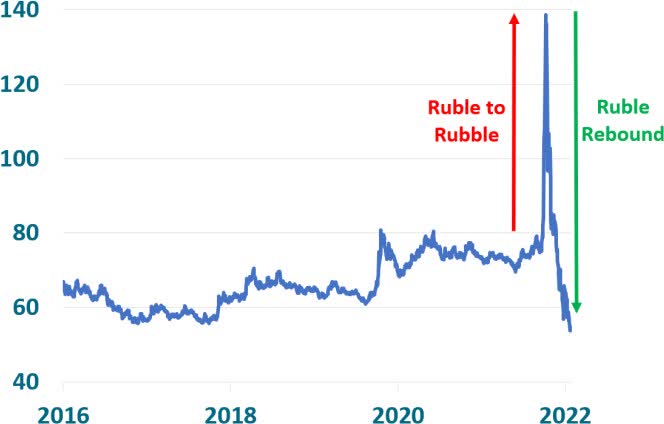
RUB/USD Exchange Rate
While booming energy prices have been a huge win for energy exporters such as Russia, it has imposed an equally large cost on the world’s energy importers. The cost of oil, coal and natural gas has soared from 4% to 13% of global GDP, crimping household incomes.
Hydrocarbons as % World GDP
Hydrocarbons continue to account for 83% of the world’s energy supply and in absolute terms the world is consuming more oil, gas, and coal than at any time in history.
The recent energy price boom has not been restricted to the oil market. In the past year thermal coal is up 400% whilst natural gas prices in Europe have soared 600%.
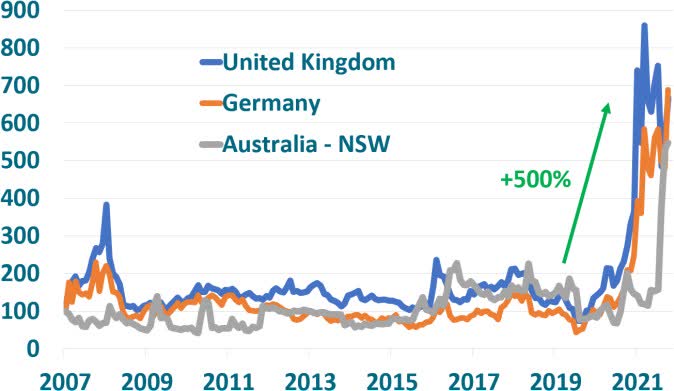
Electricity prices are therefore skyrocketing. Power prices in Germany, the UK and Eastern Australia have risen by 500% to disastrous levels for industry and consumers.
Electricity Price Index
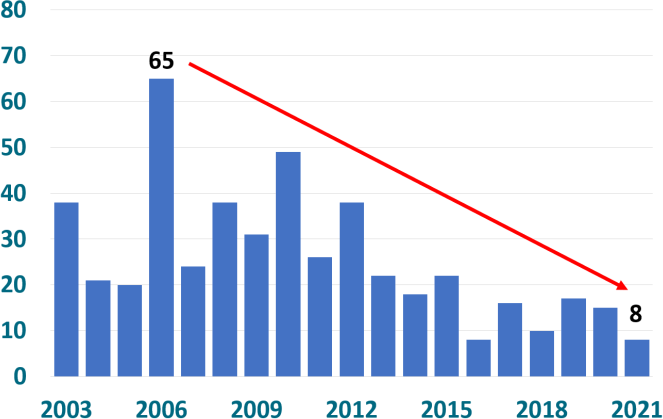
With the world’s biggest energy companies under enormous pressure from the environmental movement, exploration spending has halved since 2015, and with it the number of discoveries.
Global Oil & Gas Discoveries (Billions of Barrels)
Discoveries of oil & gas have fallen from a peak of 65 billion barrels in 2006 to just 8 billion barrels last year.
Today the world finds itself in difficult position facing an energy crisis that few saw coming. This has been exacerbated by Russia’s invasion of Ukraine – with Russia the world’s biggest gas exporter and second biggest oil exporter.
With demand for energy rising and supply unable to keep up, prices are booming. Governments are in a quandary with consumers wanting to pay less, emit less but consume more.
The current energy crisis is like the oil crisis in the 1970s, but worse, as in the 70’s Saudi Arabia cut supplies in response to the US arming Israel, whereas today demand has risen and there is no spare capacity.
Our two largest energy investments are in CNOOC and Hess which are partners with Exxon in the largest oil discovery this century in Guyana. The exploration permit at 275 miles long is huge.
Drilling in the southern portion of the block has so far discovered 11 billion barrels of oil.
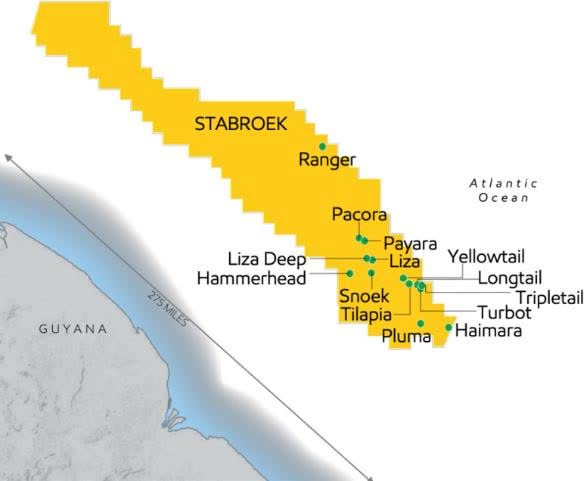
Guyana Giant Oil Discovery: 30% Hess, 25% CNOOC
Production commenced in 2019 and by the end of the decade, it is expected the field will host 10 platforms producing 1.5 million barrels of oil a day, generating revenue of over US$60bn annually at today’s prices.
CNOOC trades on a price to earnings ratio of 3x and a dividend yield of 17%, and we believe the stock represents incredible value when its Guyana assets are taken into account.
Elevated energy costs have contributed to fertilizer prices roughly tripling. This in turn has pushed up food prices, with prices of wheat, corn and soybeans all soaring over the past year.
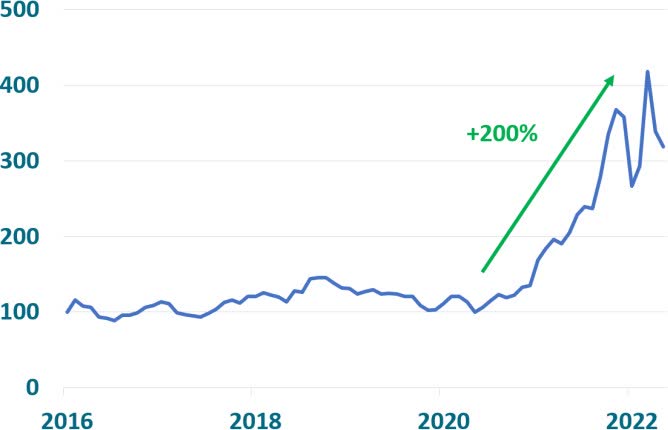
Fertilizer Price Index
The UN’s World Food Price Index has risen by 80% since 2020 putting huge pressure on consumers especially in countries such as China where food accounts for over 25% of household spending.
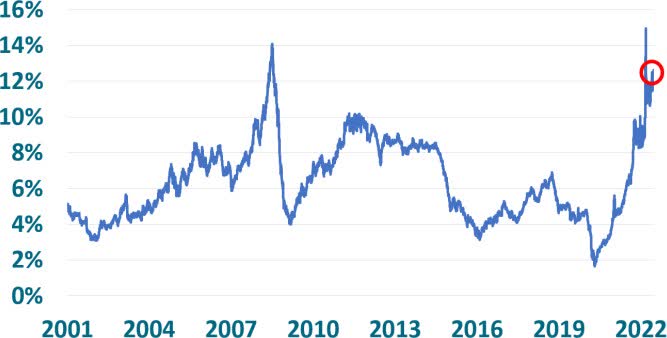
In developed countries such as the US wage inflation has started to accelerate, reaching 6.1% in June.
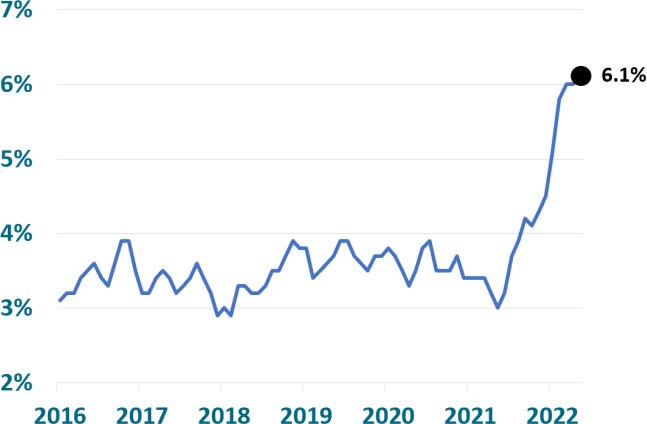
US Wage Growth (%)
Wages are not rising fast enough to offset higher living costs and US consumer confidence is at record lows.
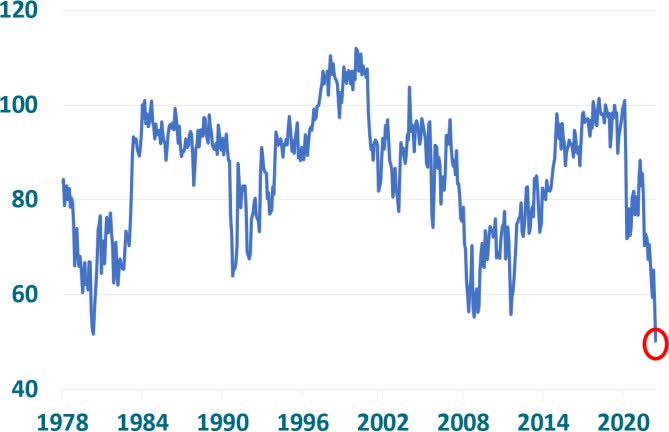
US Consumer Confidence
Inflation is now running at more than 8% in the US and Europe. Last year’s reassurances by government officials and central bankers that rising inflation would be ‘transitory’ seem like a distant memory.
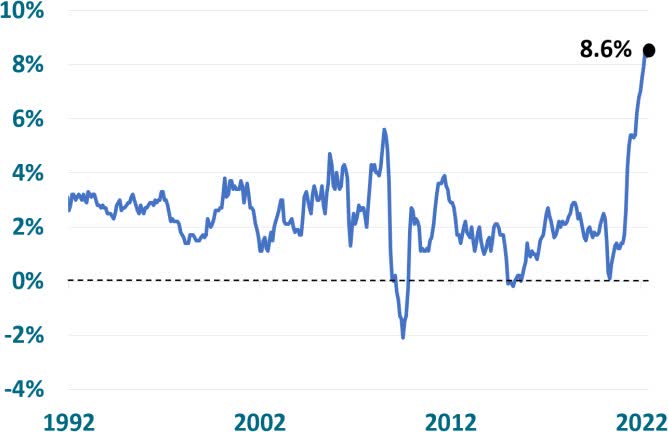
US Inflation (%)
For years governments have been able to run huge budget deficits financed by cheap money, allowing debt levels to explode. Inflation changes that dynamic completely.
Previous major inflationary outbreaks led to central banks raising interest rates above inflation levels. In 1980 Paul Volker at the Federal Reserve raised the cash rate above 17% to squash 14% inflation. Later in 1990, Alan Greenspan raised the rate to 8% to combat 6% inflation. With inflation currently running above 8%, the Federal Reserve cash rate is still just 1.75%.
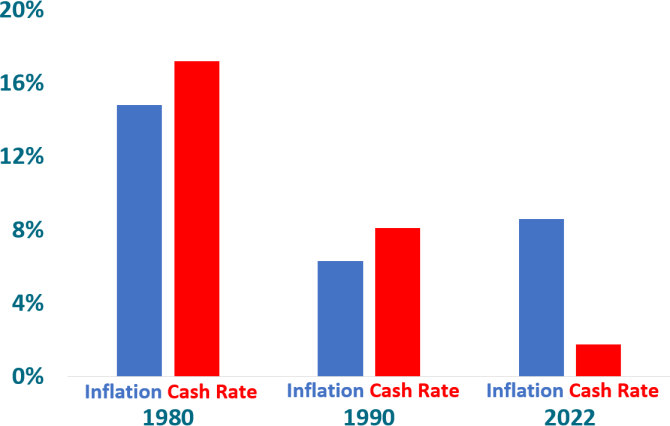
US Inflation vs Central Bank Interest Rate
The key difference now is that US Government debt levels are 135% of GDP, more than four times the level in the early 1980s. With government debt levels this high, rising interest rates will put severe pressure on government finances.
If US Government borrowing costs were to rise to just 7%, the interest cost alone would consume more than 50% of the US government budget. Decades of fiscal irresponsibility may have finally caught up with us.
In Europe, inflation is also running above 8% and the European Central Bank has its interest rate set at -0.5%.
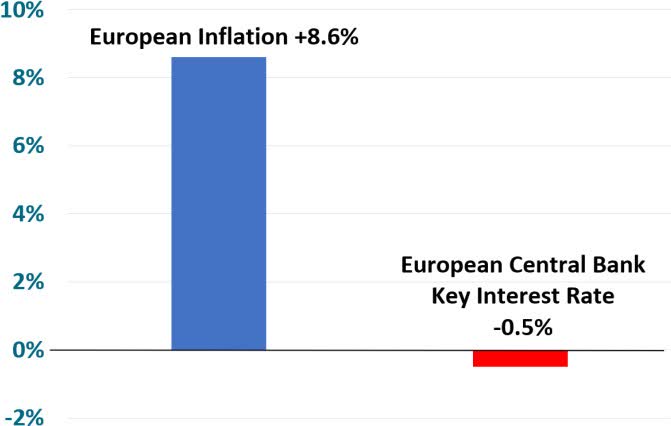
Europe Inflation vs ECB Interest Rate
If European interest rates were to seriously rise, it will be very difficult for the highly indebted nations such as Italy or Greece to cover their interest payments, and they may default.
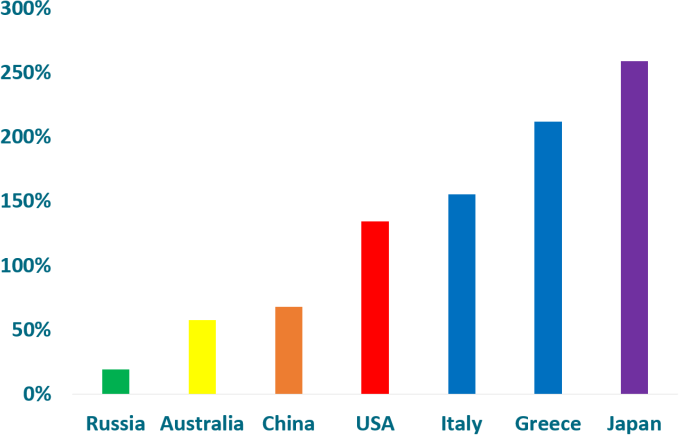
Government Debt to GDP %
Japanese government debt levels at 260% of GDP make the US and Italian problems look modest. Japan is a major importer of energy and food, and after years of deflation Japanese prices are now rising again.
The debt problems are widespread. Globally, consumers have borrowed heavily to buy houses, private equity firms have borrowed huge amounts to buy businesses, and hedge funds have taken advantage of low interest rates to borrow money and juice up returns. This behavior has pushed all major asset classes such as stocks, bonds and real estate up to astronomical valuations.
Australia has one of the highest levels of household debt in the world, which has allowed our two-trillion-dollar economy to create a housing market now valued at ten trillion dollars.
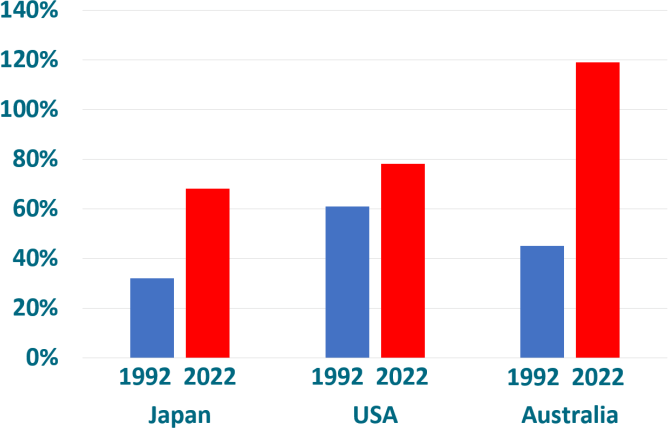
Household Debt to GDP %
Because of rising inflation, the financial markets are currently predicting the Reserve Bank of Australia will raise its cash rate from 1.35% currently to 3.5% in twelve months’ time. This would imply a mortgage rate of around 6.5%, which would be a disaster for borrowers recently lured into the property market by very low interest rates.
Over the past 40 years Central Banks have countered economic downturns by dropping rates and more recently printing money. Currently neither option is available with rates rising in order to counter inflation.
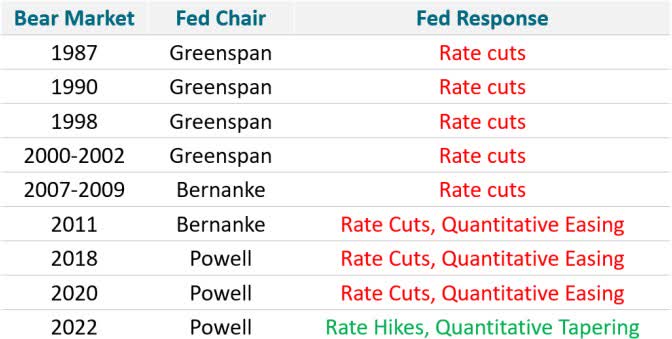
Fed Responses to Bear Markets
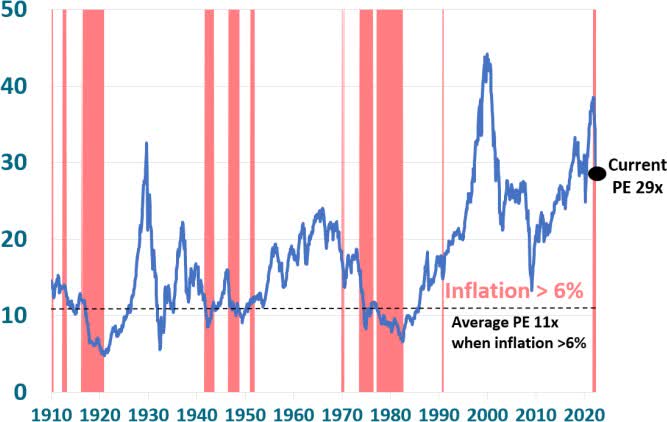
Despite the 20% fall in the US stock market, it is still one of the most overvalued stock markets in history, based on the long-term Price to Earnings ratio of the overall US market which is currently 29 times. This is shown in the chart below.
Shiller Long Term PE – US Stock Market
Shiller Long Term PE – US Stock Market
Prior to now the only time the stock market was this expensive was in 2000 before the Dot Com Crash and in 1929 before the Great Crash when the market fell 90% over three years.
What’s more, there has never been a period in history when inflation has been so high (as shown in red) whilst valuations have been this elevated.
We see this as an incredibly risky situation and therefore remain very cautious.
It is difficult to know whether the inflation persists, or rising rates trip up asset and commodity markets and bring on a deflationary recession.
We are heading into very turbulent times economically and potentially politically. The fund is positioned to ride out the storm with 44% of its assets in short-dated US treasuries, 12% in gold, 29% in the energy sector and the remaining 14% in very cheap industrial stocks.
Finally, we would like to thank Mike Snell who has retired as Chairman of Packer & Co after twelve wonderful years. Nick Brasington has recently joined our board and is the new Chairman. Nick had a highly successful international career at EY and then PWC, including membership of the PWC global assurance leadership executive. We are thrilled to have Nick on board.
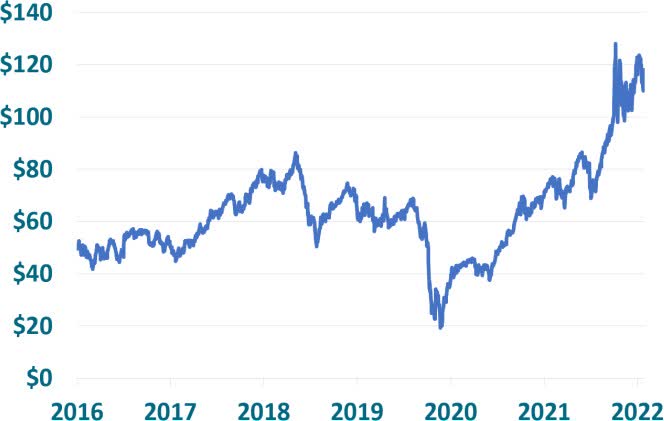
Portfolio $1.9 billion
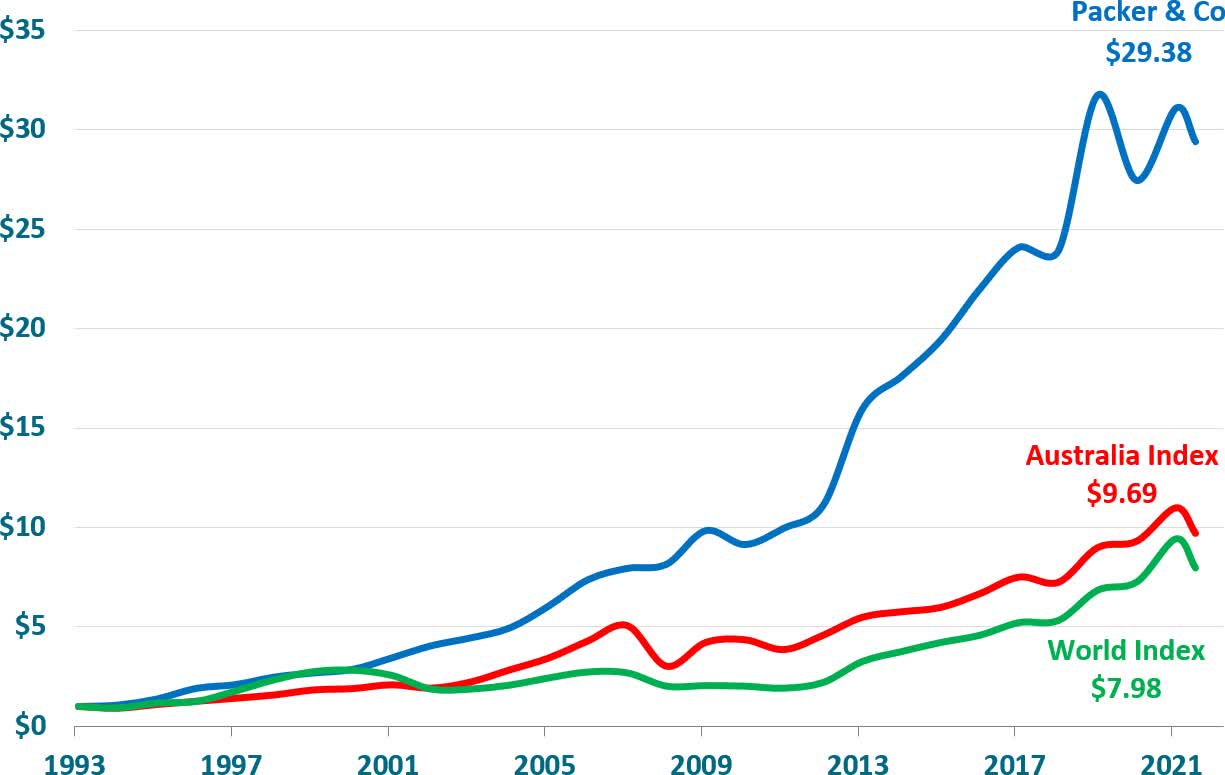
Return on $1 Since Inception
* Average return Packer & Co portfolios 1993 – 1996, Investigator Trust return used January 1997 onwards.
Editor’s Note: The summary bullets for this article were chosen by Seeking Alpha editors.
Editor’s Note: This article covers one or more microcap stocks. Please be aware of the risks associated with these stocks.
Be the first to comment