

All that’s left of OXLC’s inception NAV. Mihrzn/iStock via Getty Images
Collateralized loan obligations (CLOs) are a form of investment vehicle that have gained a lot of popularity in the last twenty years in part due to consistent high returns. These returns have attracted fund managers to create strategies for investors to gain access. One fund that has done this is Oxford Lane Capital (NASDAQ:OXLC).
Oxford Lane Capital is a closed-end fund (CEF) which invests primarily in the equity and junior debt tranches of CLOs — the riskiest pieces. These are collateralized primarily by portfolios of senior loans made to companies with unrated or below investment grade debt.
What Are CLOs?
This type of investment vehicle may not be familiar to most so it may bear some discussion directly. CLOs are a $910 billion asset class which derive principal and interest from a pool of non-investment grade senior-secured corporate loans. Basically they are baskets of secured debt loans bundled together and broken out into risk tranches.
Guggenheim Investments: Graphic of CLO structure.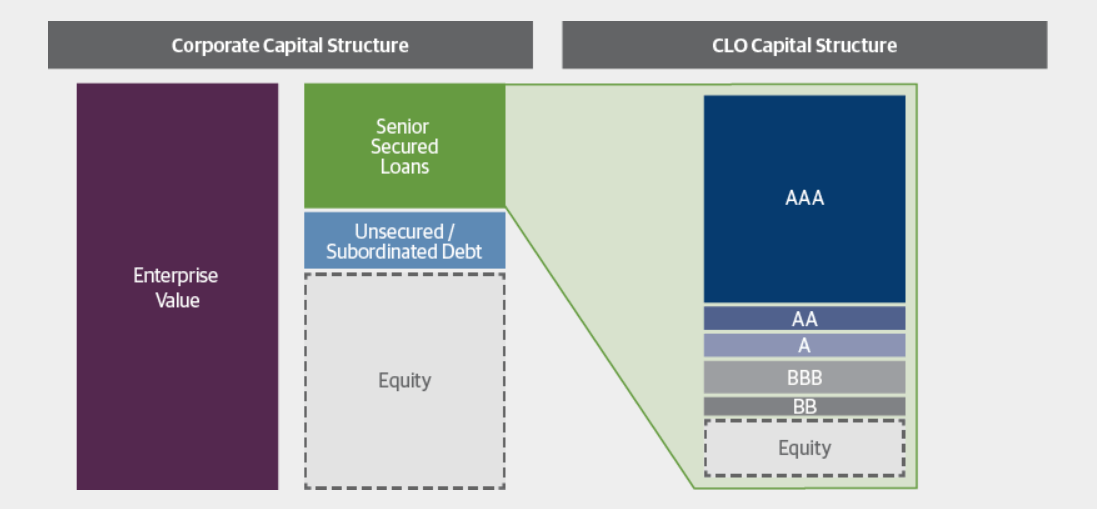
This type of investment vehicle has seen remarkably low default rates over the last twenty or so years. According to data from Guggenheim Investments over-viewing CLOs, the default rate for CLOs has been much lower than corporate debt across all rating categories.
Guggenheim Investments: CLO vs. Corporate Debt default rates.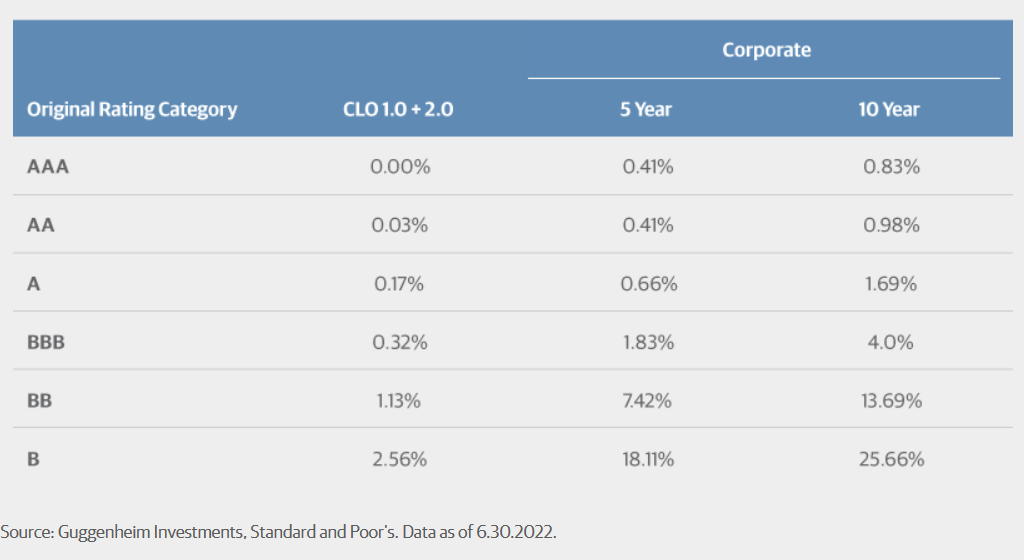
Oxford Lane Capital typically has around 97% of their portfolio invested in the equity tranches of CLOs which are technically riskier than the debt tranches shown above. A working paper from the Philadelphia Fed investigating CLO performance says:
Our central finding is that CLO equity tranches provide statistically and economically significant abnormal returns, or “alpha,” against a variety of public benchmarks. Using the generalized public market equivalent (GPME) framework of Korteweg and Nagel (2016), we find that the average completed CLO equity investment offers a net present value (NPV) of 66 cents per dollar invested, net of fees. This estimate equates to approximately $33 million, or 6.6% of total assets, for the typical deal.
So while OXLC is invested in the riskiest component of CLOs (the equity), returns have been so good on these tranches that the Fed is actually investigating it. The average IRR for CLO equity tranches according to their full data set was 9.88%.
For whatever risk CLO equity ownership implies one may feel that the annual dividend yield of 17.93% ($0.90) is worth it, a yield which has been pushed higher due to the fall in the markets. The 52-week average share price is $6.93 which implies an average dividend yield of 7.7% for the year.
An average dividend yield of 7.7% compared to an average CLO equity return of 9.88% suggests that a distribution this high could be covered over time depending on performance. And according to a special report about CLO equity performance from a Santander Group affiliate found that “managers have significant influence on IRR and that influence shows important evidence of persisting from one deal to the next.“
All of this would suggest that a fund focused on CLO equity over the past ten years could’ve been able to manage an average annual return of 9.88% on NAV, and perhaps could do even better with effective management. If we look at a ten year chart for OXLC we can extrapolate rather quickly that this did not happen.
CEF Connect: OXLC NAV and Price Chart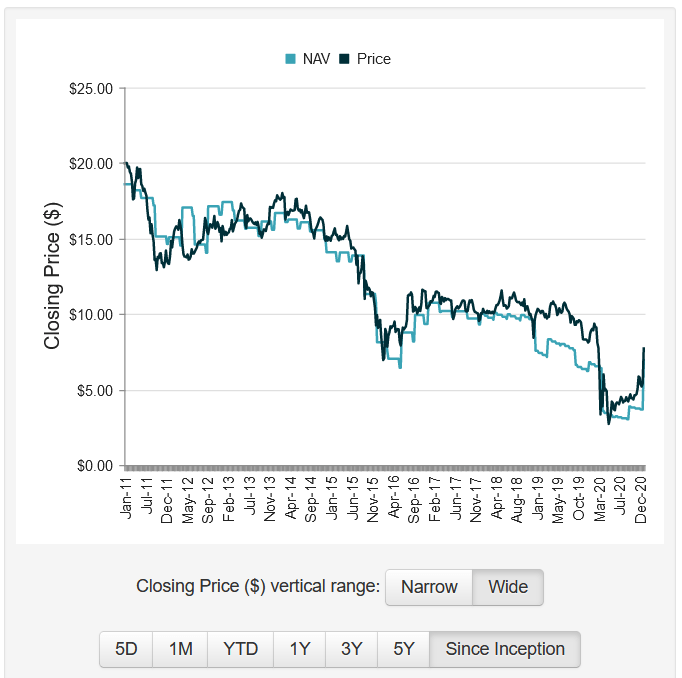
Inception NAV was $18.60 compared to where it sits as of June 30th, 2022 at $5.26. That’s a 71.7% decline in nearly twelve years. So rather than a potential 9.88% annual average over twelve years implying a 118.56% return OXLC rather saw a -71.7% NAV return.
Total return for the stock has not been good either. According to data from Seeking Alpha, over the last ten years total return for OXLC has underperformed the S&P 500 by 2.81x.
Seeking Alpha: OLXC vs. S&P500 10-year chart.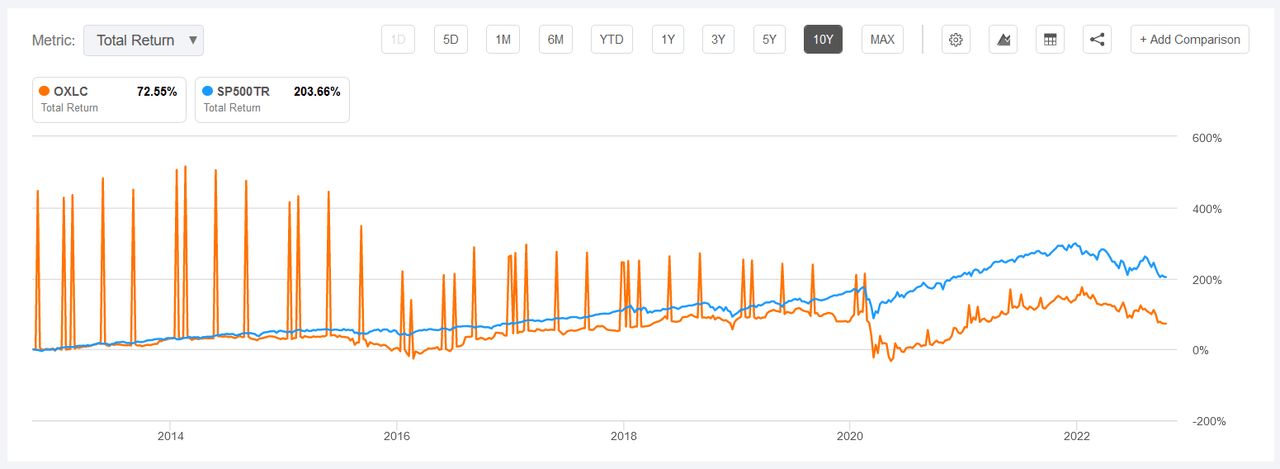
So past history does not seem to be on the side of Oxford Lane Capital. And simply investing in a low-cost indexed fund would’ve meaningfully outperformed OXLC.
Another piece we should consider with any fund is the expense ratio. Oxford Lane Capital’s is high. According to their most recent annual report the total expense ratio was 10.84%. That’s compared to SPY’s expense ratio of 0.09%. This may account for the NAV erosion.
NAV is Likely Not Coming Back
If we consider the context in which OXLC invests we may better understand why this NAV is likely to not come back. Put simply, the company invests in debt which has limited capital gains potential. We could imagine that through active trading and savvy management that perhaps they could pick up distressed pieces of debt to achieve higher capital gains.
Yet the evidence is clear that management fails to provide a positive return on NAV despite a strong underlying support of positive returns for equity CLO positions. The likelihood that they somehow would now become expert CLO pickers seems low.
They certainly try though with an average annual portfolio turnover of 50% over the last ten years.
The Dividend Yield Though
Why would anyone pay 11,944% more in expenses to underperform the S&P 500? Well presumably it is to receive the monthly distribution. Yet even this distribution has been falling over time. Back in 2012 the annual distribution was $2.20 versus the current annual distribution of $0.90. That’s a 59% decrease.
Seeking Alpha: OXLC ten-year distribution chart.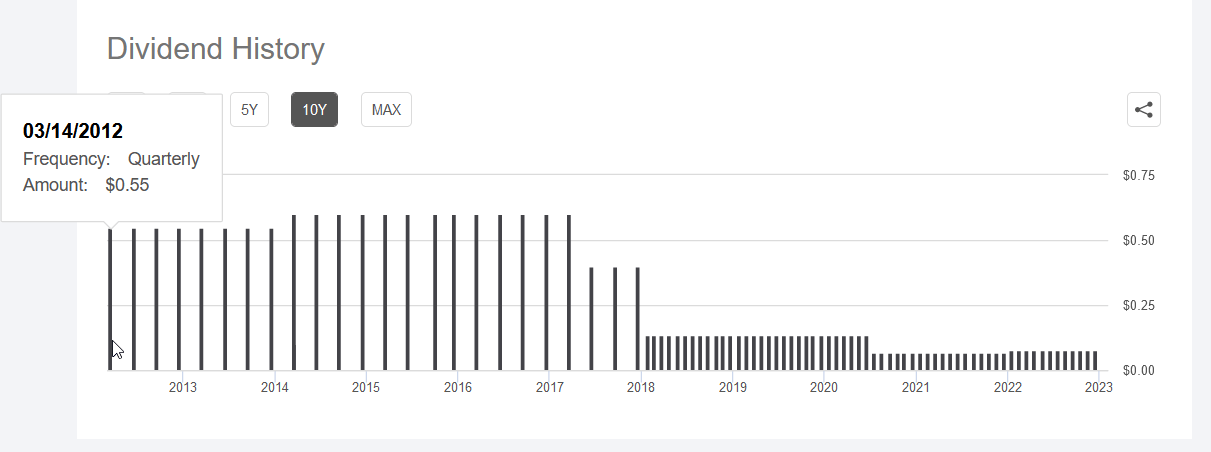
We can see that there was a bit of a bump in distributions over last year though the long term trend is there. And that trend is of declining distributions, declining NAV per share, and declining stock price.
So while some may chase the high dividend yield here and the monthly distribution, the long-term reality is that OXLC total return over the last ten years has been an average of 7.255% annually. Just for reference, you could buy US I bonds right now to lock in a 9.62% annual yield for the next thirty years instead.
Another Way to Invest In Oxford Lane
Beyond the common stock of OXLC there are four preferred securities and two baby bonds trading publicly related to the company. Here are the relevant details:
| Preferred Shares | Current Price | Par Value | Dividend | Dividend Yield | 1st Call Date | Maturity Date |
| NASDAQ:OXLCM | $24.30 | $25.00 | $1.69 | 6.955% | 6/30/2020 | 6/30/2024 |
| NASDAQ:OXLCP | $22.15 | $25.00 | $1.56 | 7.043% | 2/28/2023 | 2/28/2027 |
| OXLCN | $21.68 | $25.00 | $1.78 | 8.210% | 6/30/2024 | 6/30/2029 |
| NASDAQ:OXLCO | $21.36 | $25.00 | $1.50 | 7.022% | 8/31/2024 | 8/31/2029 |
| Junior Notes | ||||||
| OXLCZ | $22.41 | $25.00 | $1.25 | 5.578% | 1/31/2024 | 1/31/2027 |
| OXLCL | $22.50 | $25.00 | $1.69 | 7.511% | 3/16/2024 | 3/31/2031 |
Of note is that many of these securities are offering a dividend yield comparable to the average annual OXLC yield of 7.7% this year. And each of these securities does so while offering more security in the capital stack and less likelihood of that dividend or coupon not coming through. The preferred dividends are cumulative meaning even if they are suspended for a time they still accrue. And finally, the preferreds are mandatorily convertible meaning they have maturity dates which the company must redeem them on.
While the company has a long term trend of NAV per share destruction, that does not impact these securities as much. We can see from their balance sheet as of 3/31 that net asset value of $947.156m covers the junior notes and preferred stock value of $411.936m by 2.3x. This means that the equity value of the company must come down a lot more before it eats into the value of these securities.
OXLC Filing: 3/31/22 Balance Sheet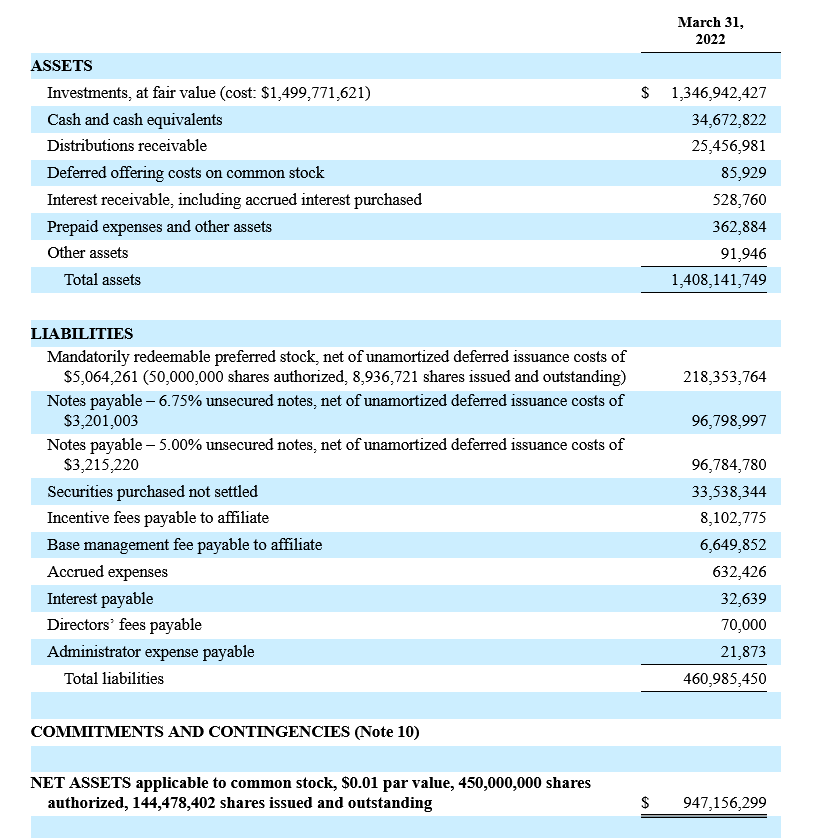
And from a glance there appears to be some inefficiency amongst these securities. For one it is surprising that one of the preferreds (OXLCN) has a higher yield than both of the notes. The other thing of note is OXLCM trading much closer to par compared to the other preferreds.
If one is an OXLC stockholder and still believes in the company long term, a better way to invest here may be through one of these securities. The company has redeemed two series of preferred shares in the past and may do so in the future as well ensuring that capital erosion isn’t taking place.
Given the inefficiency I noted with OXLCN having the highest yield currently even compared to the bonds, that seems to be a good long term swap for owners of OXLC.
Oxford Lane Capital In Conclusion
With an established ten year trend of declining NAV, stock price, and distribution I believe inertia will keep things moving in this direction. While data has shown that investing in the equity of CLOs provides above average returns, investing in Oxford Lane Capital does not. The returns that are being generated are eaten through with extraordinarily high fees given the performance.
Net asset value isn’t going to start compounding back at the company with their strategy. So I would expect continued long term net asset value destruction even if the distribution is maintained in the near term.
The preferred securities and junior notes offer another way to invest in the company if folks are still interested. There seems to be some inefficiency amongst these securities so I would encourage investors to do some due diligence to investigate what looks best to them. Though it seems a rotation from OXLC to OXLCN should provide the same kind of dividend yield investors may expect from OXLC but with much more security.
Be the first to comment