

oatawa/iStock via Getty Images
Thesis
My last article comparing Verizon (NYSE:VZ) and Lumen (NYSE:LUMN) is co-produced with Sensor Unlimited. That article was published on Sept 09, 2022. In that article, entitled “Is LUMN’s 10% Yield Too Good To Be True?”, we cautioned investors about the risk of LUMN’s then ~10% dividend yield.
Indeed, shortly after that article, concerns regarding Lumen’s dividend safety have been raised by leading institutions too. For example, a Wells Fargo’s analysis pointed out its dividend risk, citing its free cash (in the $800M range) as insufficient to cover the dividends (more than $1B) in the coming years.
All told, the stock lost more than 32% since our warning as you can see from the following chart, compared to an 11.9% price correction from the overall market. VZ suffered a price correction of 13.8%, similar to the overall market. Its price at the publication of our last article was $42.24 and it is now $36.38 as of this writing. Considering investors also received $0.653 per share of dividend on Oct 6, its adjusted loss was -12.3% since then.
Source: author based on Seeking Alpha data
In our last article, our warning for LUMN is based on a holistic analysis of its finances. The analysis looked beyond the simple payout ratios and included leverage, CAPEX investment, reinvestment rate rates, et al. That kind of analysis has been proven to be effective in our own experiences as illustrated in the case of LUMN. However, admittedly, the analysis is quite involved and requires an in-depth understanding of its financial statements. The efforts and time involved may be beyond what many readers can spend.
So in this article, we will elucidate LUMN’s risks by a much simpler framework developed by Benjamin Graham. The framework involved a checklist of a few simple things – a checklist that you can go through in about 10 minutes. Despite its simplicity, it should be able to catch obvious problems like the dividend cut possibility LUMN is facing.
And in the remainder of this article, we will apply this checklist to both LUMN and VZ to best illustrate the effectiveness of the approach. It is a perfect tool for the quick screening of safe dividend stocks in our experiences. And it should be of general value for the analysis of dividend stocks beyond LUMN and VZ.
Benjamin Graham’s Checklist
The checklist has been detailed in Benjamin Graham’s classic, The Intelligent Investor, and also summarized in our earlier article. As a brief recap, the key items on this checklist include:
- Is the company large, prominent, and conservatively financed? The specific metrics to look for are stable financial strength, consistent capital structure, and a long record of continuous dividend payments.
- Especially the dividend record. Graham emphasized countless times the importance of dividend records – for good reasons. In his own words,
“… one of the most persuasive tests of high quality is an uninterrupted record of dividend payments going back over many years. We think that a record of continuous dividend payments for the last 20 years or more is an important plus factor in the company’s quality rating. Indeed the defensive investor might be justified in limiting his purchases to those meeting this test.“
- Has the company demonstrated an adequate level of Earnings Growth in the past? For defensive investors, growth is not the key and “adequate“ is enough. In Graham‘s mind, a minimum increase of at least one-third in per-share earnings in the past ten years is adequate enough.
- Finally, are the valuation multiples moderate? As a value investor to the core, he also recommended a series of methods for investors to gauge the price they should pay. And also being fully aware of the uncertainties in his own method, he emphasized that you should always leave a safe margin of safety.
Next, we will examine LUMN and VZ against this checklist. And you will see that VZ checks off all the boxes but LUMN does not.
A large and prominent company that is conservatively financed
There is little need to justify VZ’s size and prominence. It is one of the world’s largest telecom carriers. By market cap, it is even slightly larger than AT&T ($152.79B vs $106.82B as of this writing). It is a diversified telecom company with a network that covers a population of about 298 million and provides service to nearly 98.2 million. LUMN, in contrast, is a much smaller player in the telecom space. Its market cap is about $6.96B, less than 1/20 of VZ. And by revenues, VZ’s TTM revenues of $134B are almost 7x higher than LUMN’s $19B.
Now onto financial strength. Telecom stocks are in general more leveraged than the overall economy due to their heavy CAPEX requirements (as you can see from their overall high debt level in the top panel of the chart below). However, VZ was able to maintain a financial strength that is slightly better than the overall economy, but LUMN’s financial strength is far weaker than the overall economy. As seen in the mid panel of the chart, VZ’s debt/EBITDA ratio is currently 3.88x, more than 20% higher than LUMN’s 3.22x. VZ’s ratio has also been very consistent, although the consistency was buried under LUMN’s large variance in this panel.
In terms of debt service, LUMN’s current interest coverage ratio is just 2.84x as seen in the bottom panel. A coverage ratio of 2.84x means that more than 1/3 (35.2% to be exact) of its earnings will be used to just service its debt. In contrast, VZ’s current interest coverage ratio is about 10x, not only far higher than LUMN but also near a peak level in a decade when compared to its own historical record.
Source: Seeking Alpha data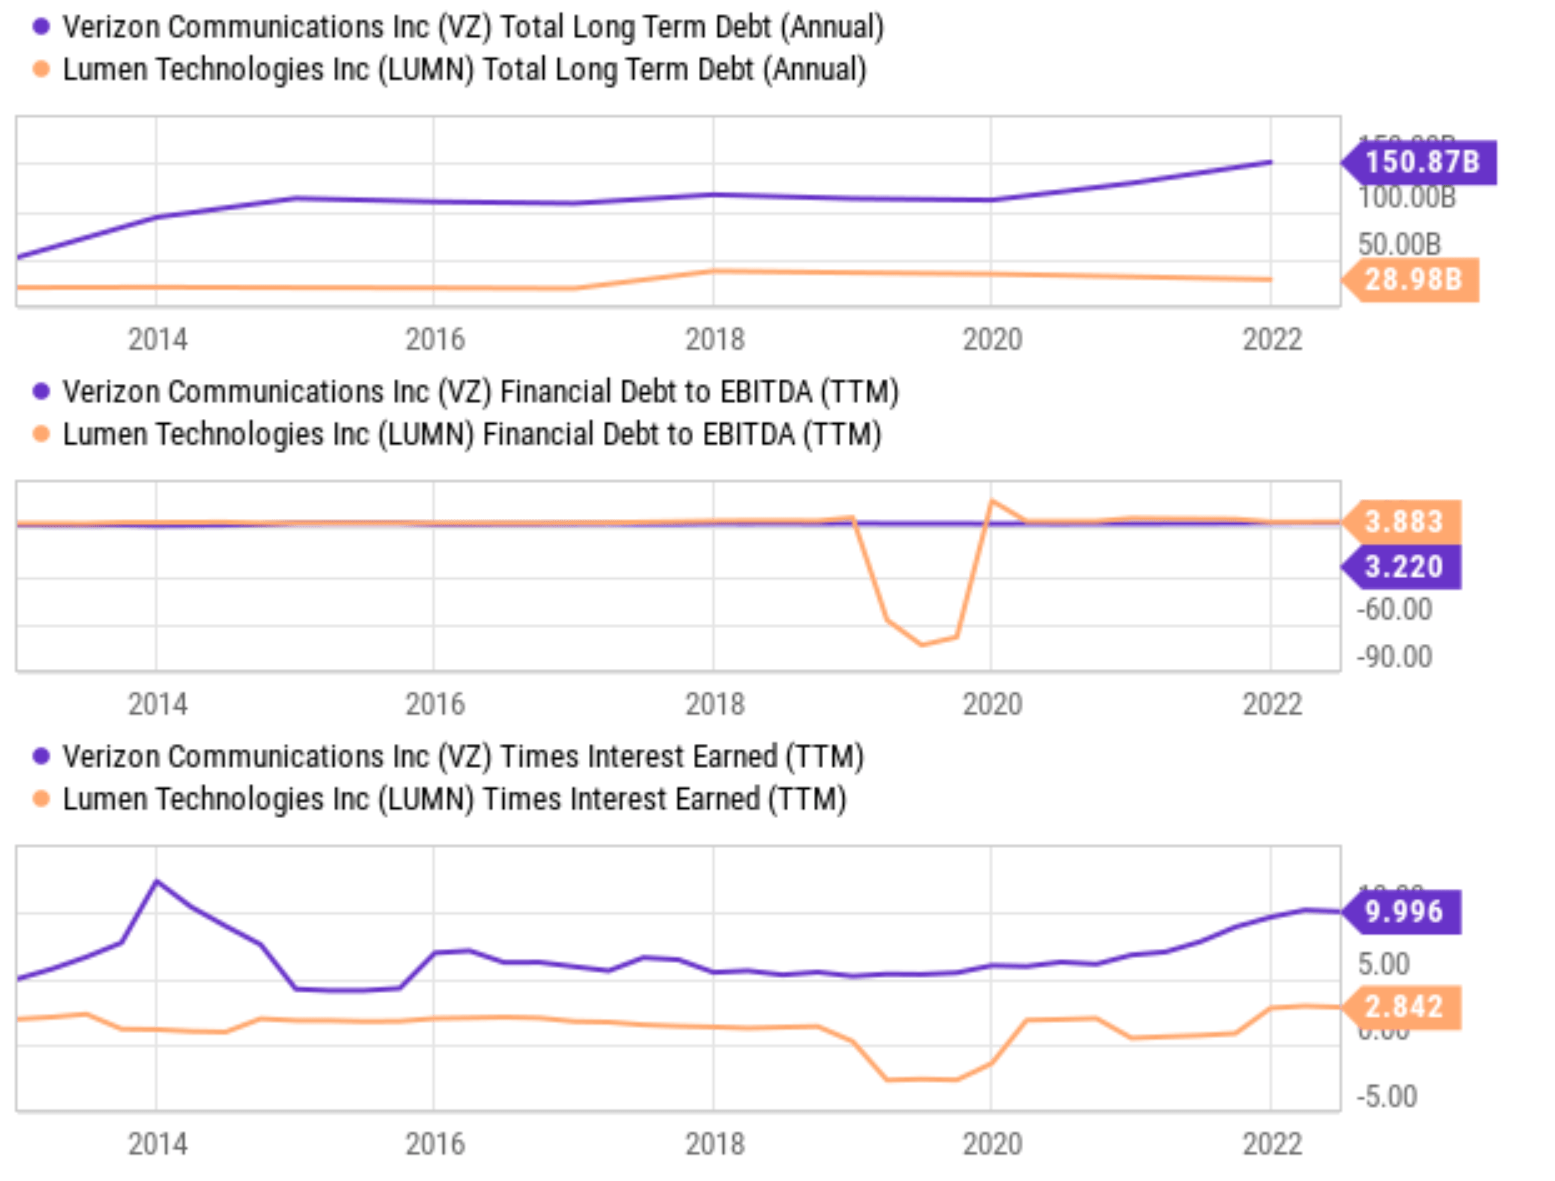
A strong dividend record
This is an easy box to check off. As aforementioned, Graham views a record of continuous dividend payments for the last 20 years as a huge plus. In VZ’s case, the record is much stronger than 20 years. VZ’s current track record for consecutive dividend increases is also 18 years as of 2022 already. As seen in the top panel of the chart below, it has been increasing its quarterly dividend payouts at a CAGR of 2.5% in the past 10 years and 2.0% in the past 5 years. You can also see the consistency of its dividend raises by the quarterly YOY growth in the bottom panel of the chart. It’s pretty much a constant line around 2%.
In contrast, the dividend history of LUMN is much choppier. In the past decade, it had to cut its dividends twice, by more than 20% in 2013 and by more than 50% in 2019. As a result, its dividend payouts have shrunk at a CAGR of 10% in the past 10 years and -14.5% in the past 5 years. And as mentioned above, it is very likely that it will have to cut it again in the near future.
Source: author based on Seeking Alpha data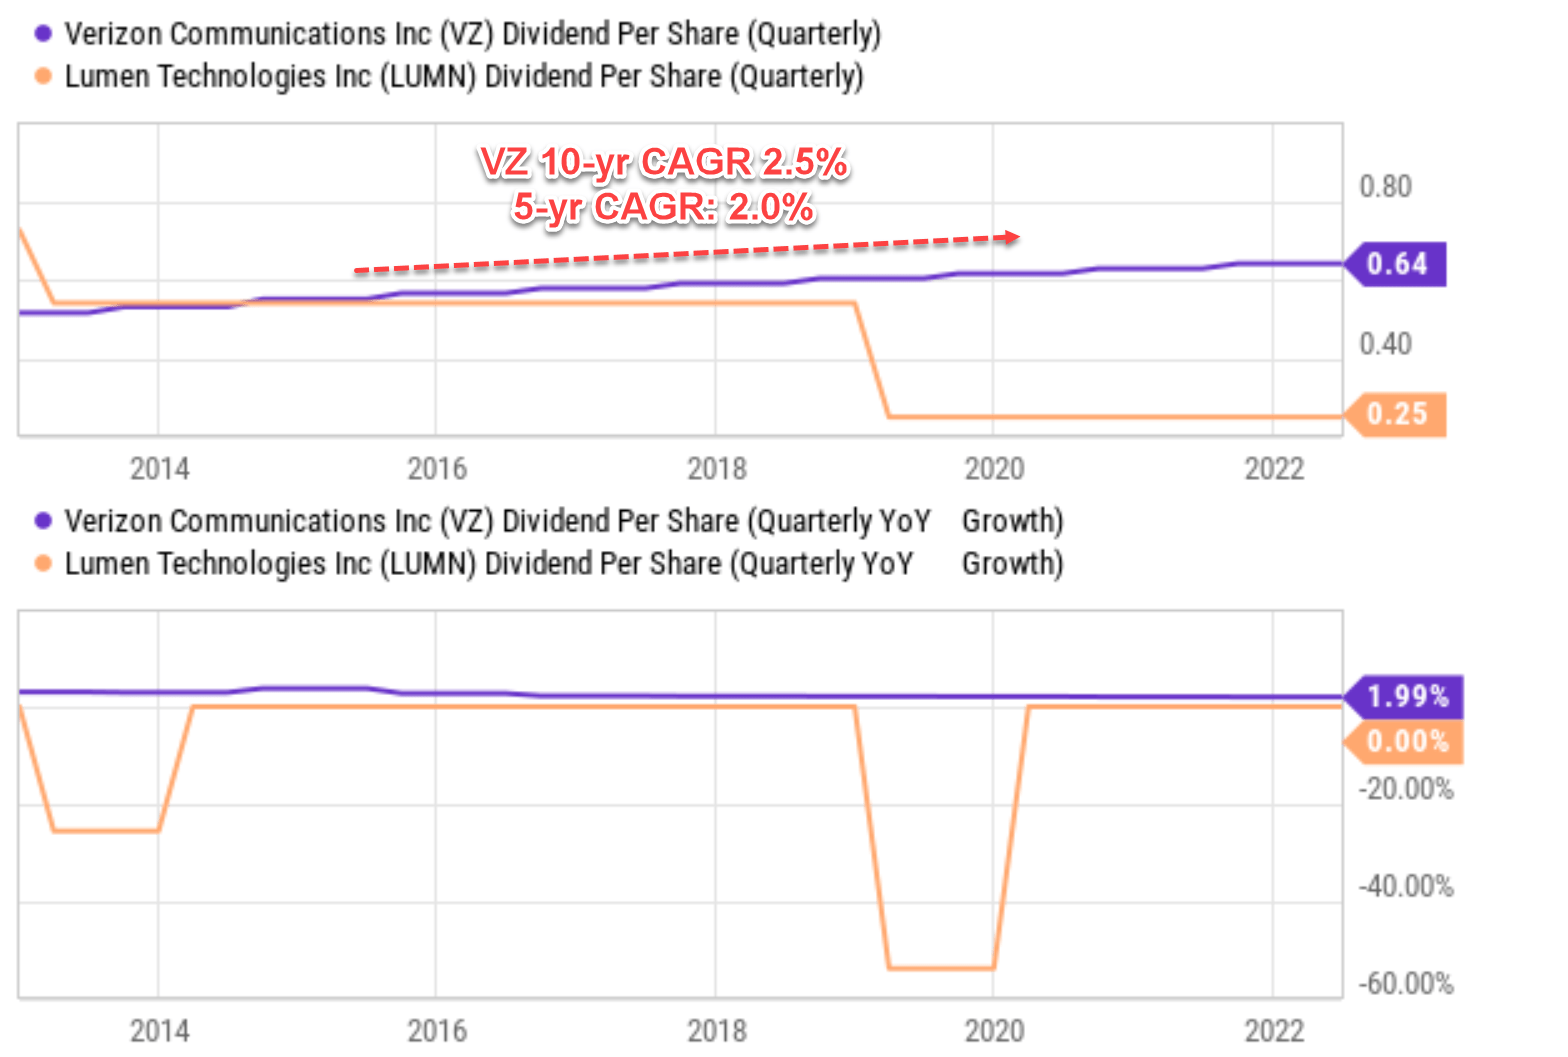
An adequate level of earnings growth
As mentioned earlier,
Graham’s definition of adequate growth is simply an increase of at least one-third in EPS in the past ten years, which translates into about 2.89% CAGR.
VZ again meets this requirement. As aforementioned, using its dividend as an earning metric, it has been growing in the past at a CAGR in the 2% to 2.5% range. Using its net profit as an earning metric, it has been growing in the past at a CAGR in the 5.0% (past 5 years) to 7.5% range (past 10 years). LUMN, in contrast, has been suffering earnings shrinkage across all metrics. As aforementioned, by dividends, it has been shrinking 10% to 14.5% CAGR range. Using cash flow, it has been shrinking in the 3.0% (past 10 years) to 8.0% (past 5 years) range.
A moderate valuation
Finally, as also mentioned earlier,
As a value investor to the core, Graham recommended a series of methods for investors to gauge the price they should pay. Here we will examine two of them (the other methods he recommended essentially paint the same picture). First, he recommended the PE for a defensive stock should be around 8.5 plus twice the expected annual growth rate, which I call the Graham PE. So in his mind, a business that completely stagnates should be worth about 8.5x PE.
And in VZ’s case, consensus estimates project its earnings growth rates of 1.2% in the next 5 years as seen from the chart below. I think the estimate is too conservative as argued in my other articles. A simple estimate involving its return on capital employed and reinvestment rates points to about 3% annual growth rates. But here I will use 2%, the lower bounds of its dividend growth in the past 10 years. Based on this growth rate, the Graham PE would be 12.5x (which equals 8.5 + 2 * 2.0). Compared to its actual PE of 7.04x, its market valuation is only 56% of the Graham PE.
Source: author based on Seeking Alpha data Source: author based on Seeking Alpha data

The picture for LUMN is a stark contrast because of its earnings shrinkage. As aforementioned, its earnings have been shrinking in the past, therefore it does not pass the Graham check at all. Furthermore, its earnings are also projected to keep decreasing. Based on the following consensus estimates, LUMN’s earnings will keep shrinking at a CAGR of 12% in the next 5 years too.
Source: author based on Seeking Alpha data
Graham of course is fully aware of the uncertainties in his own methods (for example, the limitation of the Graham PE in the case of earnings shrinkage as in the case of LUMN). That is why he developed several methods for cross-checking purposes. That is why we will also check the so-called Graham Number:
In general, Graham cautions against paying a price of more than 15x times earnings or more than 1.5x times the book value (“BV“). However, a PE multiple above 15x could be justified if the P/BV ratio is lower than 1.5x. And vice versa. And as a result, the Graham number considers both the 15x PE limit and the 1.5x P/BV limit. More specifically, the Graham number is the square root of A) 22.5 (which equals 15 times 1.5), B) the EPS, and C) the book value.
The inputs and results of the Graham number for both VZ and LUMN are listed in their own corresponding tables. All the financial and price information was taken from Seeking Alpha. As seen, the Graham number worked out to be $48.8 for VZ. At its current market price of $36.3, the stock is for sale at a 25% discount. As for LUMN, the Graham number worked out to be $14.9. At its current market price of $6.7, the stock is for sale at a 55% discount. Although investors should not forget about all the warning signs so far. Those warning signs should have already ruled out LUMN as a viable candidate already for conservative investors.
Source: author based on Seeking Alpha data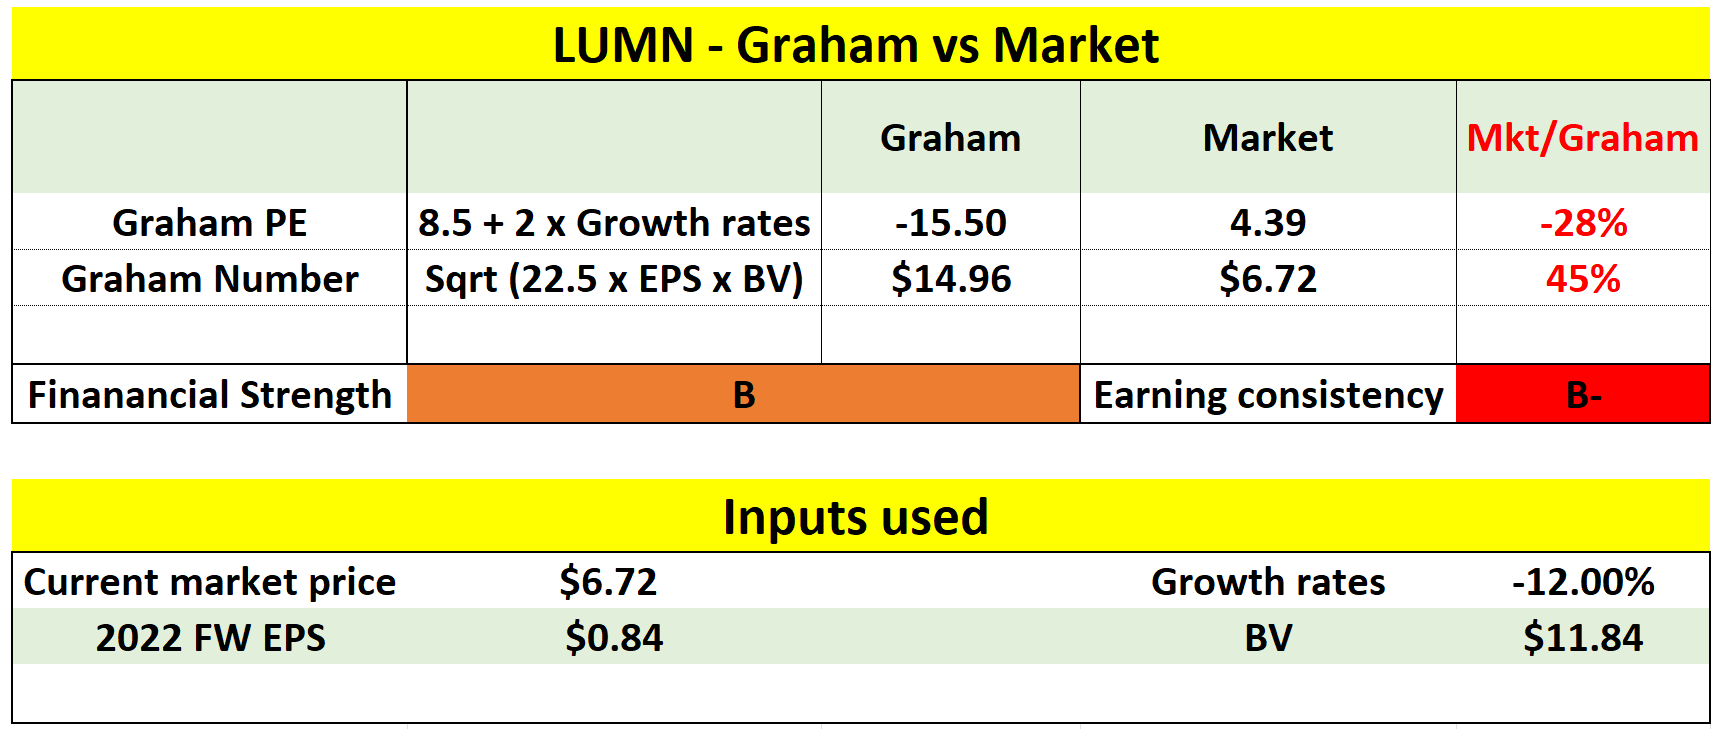
Risks and final thoughts
There is no lack of risks for both LUMN and VZ in the near term. They both face the same macroeconomic risks including geopolitical tensions, inflation, interest rates, or full-scale recession. Specific for VZ, there is a risk that its CAPEX projects can run over budget. The long lifecycle of its assets as just mentioned, combined with the recent inflation hikes and labor shortages, can cause its CAPEX to exceed management guidance. Specific to LUMN, its divestitures of the ILEC and Latin American arms is estimated to be about $10B, a sizable chunk of the company. Such a sizable divestiture can create both operation and accounting uncertainties in the near future for LUMN.
To conclude, investors should not be lured to LUMN by its double-digit dividend yields. Lack of growth CAPEX is likely to cause earnings shrinkage to persist. And it is like it will have cut dividends in the near future. If you have the time to examine its financial statements in detail like what we did in our last article, these problems can be clearly identified. Although a much simpler, yet timeless and equally powerful, framework developed by Benjamin Graham can help you see these problems in about 10 minutes. I hope the application of Graham’s checklist to LUMN, especially when contrasted against VZ, helps to illustrate its potency.
Be the first to comment