

peepo/E+ via Getty Images
By Sandrine Soubeyran and Alberto Allegrucci, Global Investment Research, FTSE Russell
A close inspection of the UK equity market’s composition shows some distinctions. In its totality, the UK market mixes companies that have significant global exposure, and therefore are highly dependent on the external environment, with those that have a higher domestic focus. As a result, differentiating between the large blue chip FTSE 100 and the mid-cap FTSE 250 is important, as index behaviours can differ based on the characteristics of their constituents, such as the extent of their global exposure.
For the purpose of this analysis, we use the FTSE All-Share Index series to represent the UK equity market, which is an amalgam of the blue-chip FTSE 100, the mid-cap FTSE 250, and the FTSE SmallCap Indices. We compare the largest 350 UK companies, represented by the FTSE 100 index and FTSE 250 Index, with the global equity market (FTSE All-World ex UK).
FTSE 100 trumps FTSE 250 and the World over 12 months
Analysing the long, medium and short-term performances of large and medium-sized UK companies with the performance of the global index shows that over a 20-year period, UK domestic companies (FTSE 250) have outperformed (Chart 1).
However, the outcome changes on a shorter timeline. Over a five-year period, both the global index and the blue-chip FTSE 100 have outperformed the FTSE 250, while, over the last twelve months, only the FTSE 100 has gained, contrasting double-digit losses for the FTSE 250 and the global equity index.
Author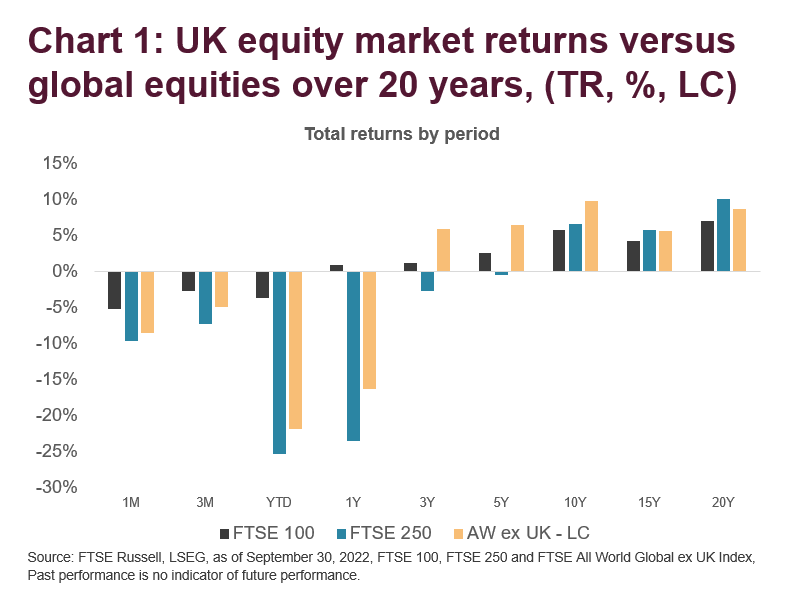
Moreover, the risk-return profile over the last five years indicates that for a similar level of volatility, the FTSE 100 has registered a higher return compared to the FTSE 250, while the World performed better than both UK indices, with a higher return for a lower level of volatility (Chart 2).
Author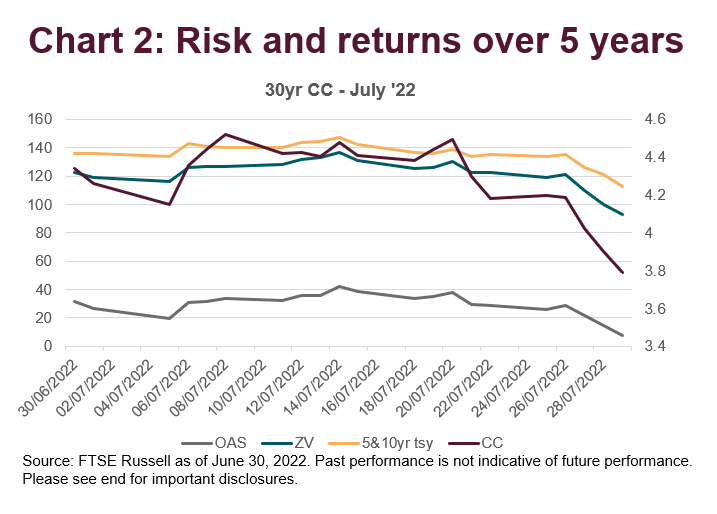
Why is that? Looking into the causes of the FTSE 100’s recent outperformance shows that different industry exposures are a key reason. The blue-chip index has greater exposure to natural resources (i.e., energy and materials) and consumer staples than the FTSE 250, which has a higher exposure to financials, industrials, and real estates.
Historically, large companies have tended to do well during the final phases of an economic cycle, before a downturn. As investors become increasingly concerned about a correction, exacerbated recently by the Bank of England’s monetary tightening (increased from 0.25% to 2.25% in 2022), they have shown a preference for ‘quality’ companies.
In addition, global companies have been more resilient within the challenging economic backdrop of the last years (impacts from Brexit, Covid-19 lockdowns, and conflicts in Europe). The FTSE 100 also has a much higher exposure to energy (13.5% versus 1.8% in the FTSE 250), an industry that has strongly benefited from high oil prices.
Author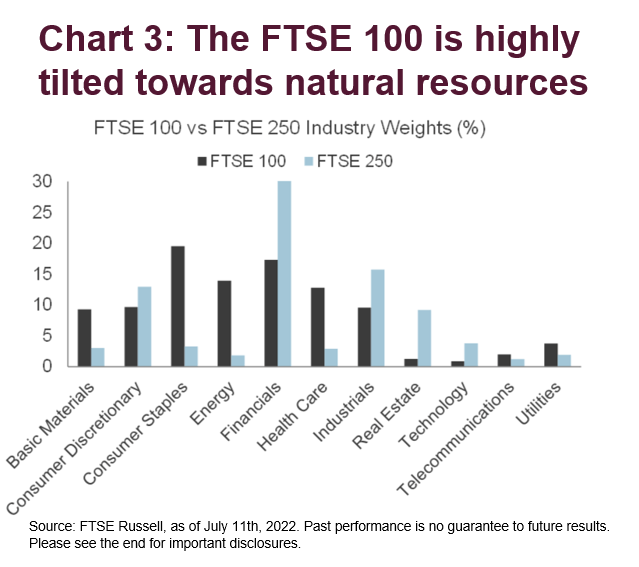
The strong performance from the oil, gas and coal, and metals and mining sector (especially in Q3), over the last twelve months, has helped bolster the FTSE 100 performance relative to that of the FTSE 250 as did the outperformance of the sector in the FTSE 100 compared to its smaller equivalent. Finally, as can be seen in Chart 4, the sharp rebound in the travel and leisure sector has also been positive since Q2 2022.
Author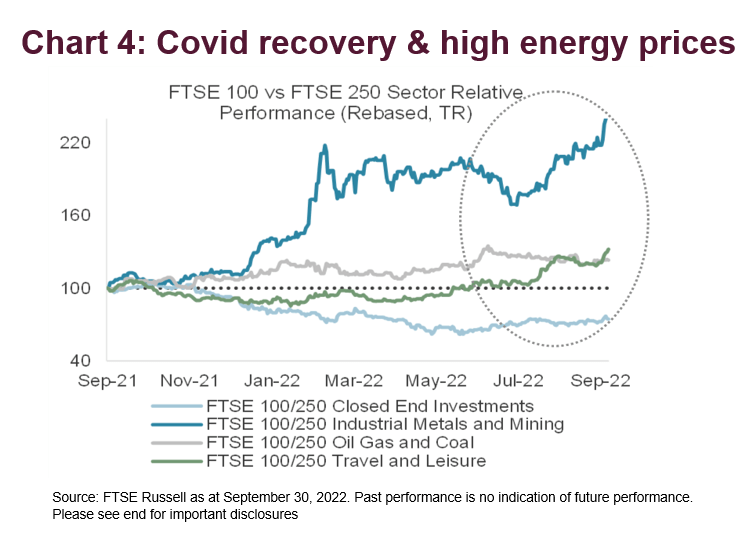
Overseas revenues a boost to global companies
Finally, FTSE 100 companies are more exposed to foreign revenues than those in the FTSE 250. Around 82% of the FTSE 100 revenues are from overseas markets, while, though still sizeable, this figure drops to nearly 57% for the FTSE 250 (Chart 5).
Moreover, the chart shows that dependence on overseas revenues since 2014 has been rising for FTSE 100 companies, while the revenue base for FTSE 250 companies has shifted towards the UK since Brexit in 2016 and during the Covid-19 lockdowns in 2020.
Author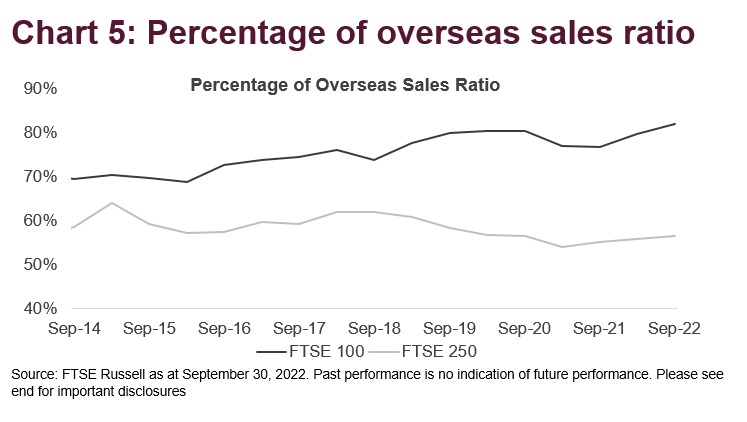
Currency matters
The sharp depreciation of sterling against the euro and the US dollar has provided a greater boost to companies with large overseas revenues than those with a more domestic focus, and as seen in Chart 5, FTSE 100 companies have benefited from that trend.
The question is how much weaker can the sterling get? The recent suggestion that the Bank of England may have to increase rates significantly to control inflation at their next policy meeting in November does not bode well for its future. However, should history repeat itself, a weak sterling could be just the remedy for companies with extensive overseas revenues?
Author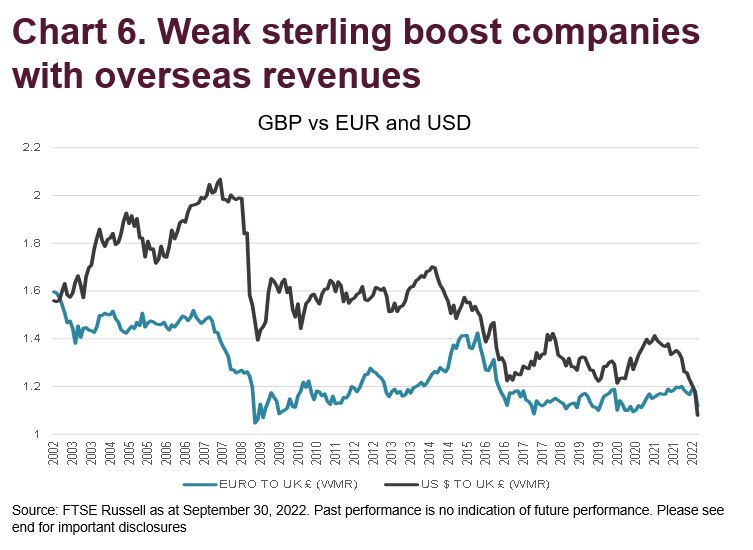
© 2022 London Stock Exchange Group plc and its applicable group undertakings (the “LSE Group”). The LSE Group includes (1) FTSE International Limited (“FTSE”), (2) Frank Russell Company (“Russell”), (3) FTSE Global Debt Capital Markets Inc. and FTSE Global Debt Capital Markets Limited (together, “FTSE Canada”), (4) FTSE Fixed Income Europe Limited (“FTSE FI Europe”), (5) FTSE Fixed Income LLC (“FTSE FI”), (6) The Yield Book Inc (“YB”) and (7) Beyond Ratings S.A.S. (“BR”). All rights reserved.
FTSE Russell® is a trading name of FTSE, Russell, FTSE Canada, FTSE FI, FTSE FI Europe, YB and BR. “FTSE®”, “Russell®”, “FTSE Russell®”, “FTSE4Good®”, “ICB®”, “The Yield Book®”, “Beyond Ratings®” and all other trademarks and service marks used herein (whether registered or unregistered) are trademarks and/or service marks owned or licensed by the applicable member of the LSE Group or their respective licensors and are owned, or used under licence, by FTSE, Russell, FTSE Canada, FTSE FI, FTSE FI Europe, YB or BR. FTSE International Limited is authorised and regulated by the Financial Conduct Authority as a benchmark administrator.
All information is provided for information purposes only. All information and data contained in this publication is obtained by the LSE Group, from sources believed by it to be accurate and reliable. Because of the possibility of human and mechanical error as well as other factors, however, such information and data is provided “as is” without warranty of any kind. No member of the LSE Group nor their respective directors, officers, employees, partners or licensors make any claim, prediction, warranty or representation whatsoever, expressly or impliedly, either as to the accuracy, timeliness, completeness, merchantability of any information or of results to be obtained from the use of FTSE Russell products, including but not limited to indexes, data and analytics, or the fitness or suitability of the FTSE Russell products for any particular purpose to which they might be put. Any representation of historical data accessible through FTSE Russell products is provided for information purposes only and is not a reliable indicator of future performance.
No responsibility or liability can be accepted by any member of the LSE Group nor their respective directors, officers, employees, partners or licensors for (A) any loss or damage in whole or in part caused by, resulting from, or relating to any error (negligent or otherwise) or other circumstance involved in procuring, collecting, compiling, interpreting, analysing, editing, transcribing, transmitting, communicating or delivering any such information or data or from use of this document or links to this document or (B) any direct, indirect, special, consequential or incidental damages whatsoever, even if any member of the LSE Group is advised in advance of the possibility of such damages, resulting from the use of, or inability to use, such information.
No member of the LSE Group nor their respective directors, officers, employees, partners or licensors provide investment advice and nothing in this document should be taken as constituting financial or investment advice. No member of the LSE Group nor their respective directors, officers, employees, partners or licensors make any representation regarding the advisability of investing in any asset or whether such investment creates any legal or compliance risks for the investor. A decision to invest in any such asset should not be made in reliance on any information herein. Indexes cannot be invested in directly. Inclusion of an asset in an index is not a recommendation to buy, sell or hold that asset nor confirmation that any particular investor may lawfully buy, sell or hold the asset or an index containing the asset. The general information contained in this publication should not be acted upon without obtaining specific legal, tax, and investment advice from a licensed professional.
Past performance is no guarantee of future results. Charts and graphs are provided for illustrative purposes only. Index returns shown may not represent the results of the actual trading of investable assets. Certain returns shown may reflect back-tested performance. All performance presented prior to the index inception date is back-tested performance. Back-tested performance is not actual performance, but is hypothetical. The back-test calculations are based on the same methodology that was in effect when the index was officially launched. However, back-tested data may reflect the application of the index methodology with the benefit of hindsight, and the historic calculations of an index may change from month to month based on revisions to the underlying economic data used in the calculation of the index.
This document may contain forward-looking assessments. These are based upon a number of assumptions concerning future conditions that ultimately may prove to be inaccurate. Such forward-looking assessments are subject to risks and uncertainties and may be affected by various factors that may cause actual results to differ materially. No member of the LSE Group nor their licensors assume any duty to and do not undertake to update forward-looking assessments.
No part of this information may be reproduced, stored in a retrieval system or transmitted in any form or by any means, electronic, mechanical, photocopying, recording or otherwise, without prior written permission of the applicable member of the LSE Group. Use and distribution of the LSE Group data requires a licence from FTSE, Russell, FTSE Canada, FTSE FI, FTSE FI Europe, YB, BR and/or their respective licensors.
Editor’s Note: The summary bullets for this article were chosen by Seeking Alpha editors.
Be the first to comment