

everythingpossible
(This article was co-produced with Hoya Capital Real Estate)
Introduction
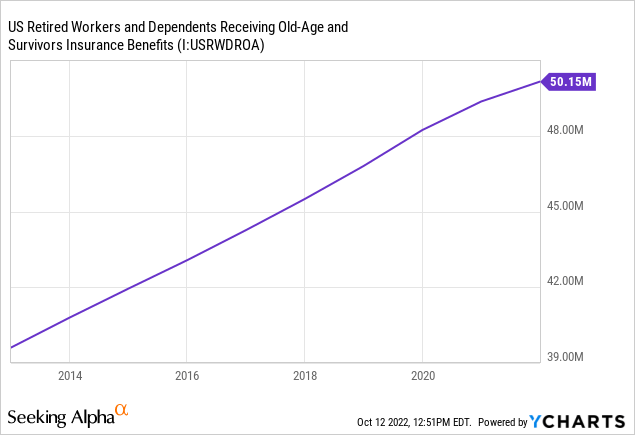
With the aging US population and in the rest of the Developed world, healthcare stocks should continue to do well. Since baby boomers started reaching Medicare age, expenditures to keep them going have soared.
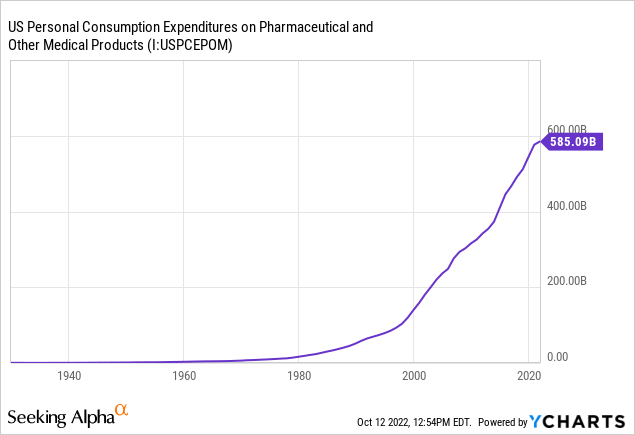
One study shows almost 50% of a person’s lifetime medical costs will occur while on Medicare. The more care you get, the longer you should survive; thus the more you might need additional medical care.
ncbi.nlm.nih.gov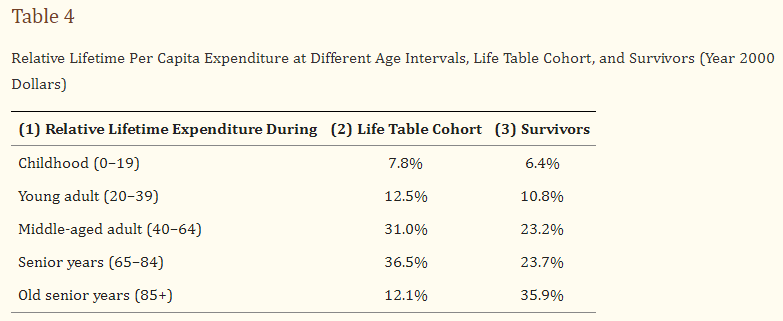
iShares U.S. Healthcare (NYSEARCA:IYH) ETF review
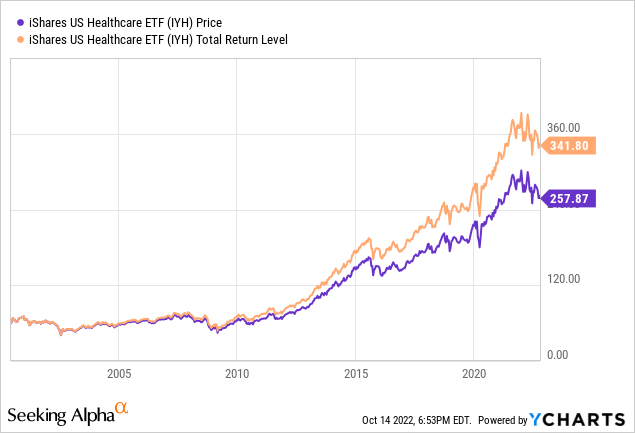
Seeking Alpha describes this ETF as:
The iShares U.S. Healthcare ETF is managed by BlackRock Fund Advisors. The fund invests in public equity markets of the United States. It invests in stocks of companies operating across health care sectors. The fund invests in growth and value stocks of companies across diversified market capitalization. It seeks to track the performance of the Russell 1000 Health Care RIC 22.5/45 Capped Index, by using representative sampling technique. IYH was formed on June 12, 2000.
Source: seekingalpha.com IYH
IYH has almost $3b in AUM and comes with a 39bps fee structure. The current yield is 1.2%. iShares adds that the focus is exposure to U.S. healthcare equipment and services, pharmaceuticals, and biotechnology companies. Key to understanding a passively-managed ETF is the index used, which FTSE/Russell describes as:
The Russell 1000 Health Care RIC 22.5/45 Capped Index measures the performance of US large cap companies that are assigned to the Health Care Industry by the ICB sector classification framework. At the quarterly index reviews, all companies that have a weight greater than 4.5% in aggregate are no more than 45% of the index, and no individual company in the index has a weight greater than 22.5% of the index.
Source: content.ftserussell.com Index
Basic statistics provided are:
research.ftserussell.com Index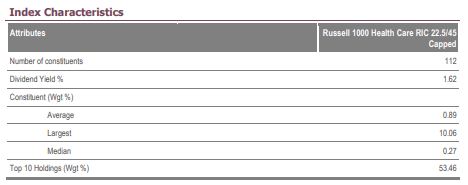
As concentrated as this index appears, and it is, the index used by IHI is even more so. There are two caps applied to reduce concentration risk though:
- Restricts stocks over 4.5% to a maximum of 45% of the total.
- Restricts the maximum weight of any stock to 22.5 of the total.
When the caps are breached, the excess weight is spread across the other stocks held. The Index is rebalanced quarterly. This Index started in 2021, prior to that IYH invested based on the Dow Jones U.S. Health Care Index.
IYH holdings review
Within the medical field, the industry breakdown is:
ishare.com IYH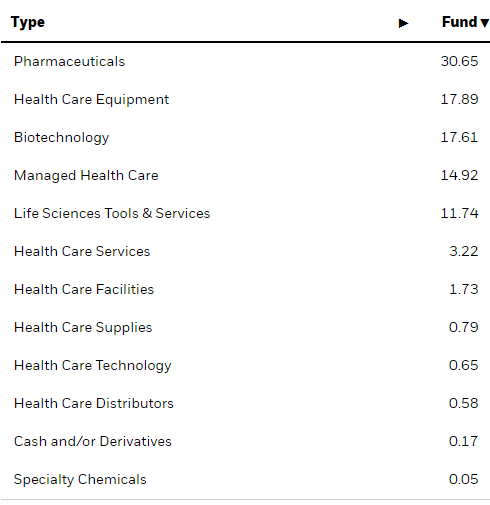
The top 5 industries basically define the portfolio, with drug companies at the top. That could be concern with recent law changes giving Medicare the ability to “negotiate” prices starting in 2026.
Top 20 holdings
ishares.com; compiled by Author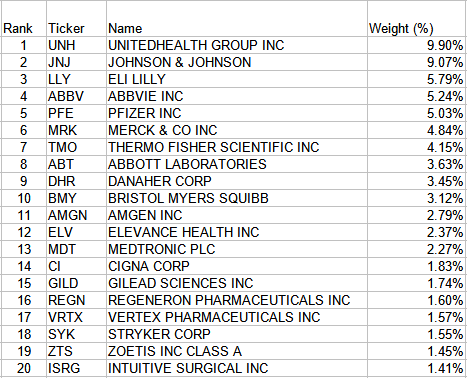
These come to almost 73% of the portfolio. Five of these stocks are held by IHI.
IYH distributions review
seekingalpha.com IYH DVDs
As with the other ETF, the low yield should mean income is not important to investors in this ETF. Despite that fact, overall Seeking Alpha give it a “B” grade for its distribution history.
seekingalpha.com IYH scorecard
iShares U.S. Medical Devices (NYSEARCA:IHI) ETF review
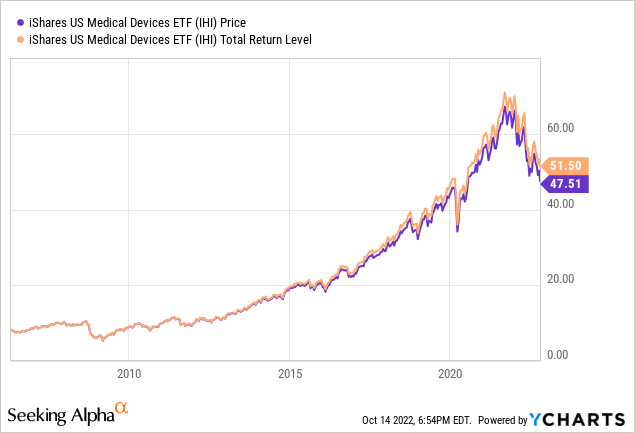
Seeking Alpha describes this ETF as:
The iShares U.S. Medical Devices ETF is managed by BlackRock Fund Advisors The investment seeks to track the investment results of the Dow Jones U.S. Select Medical Equipment Index composed of U.S. equities in the medical devices sector. The fund will invest at least 80% of its assets in the component securities of the index and in investments that are substantially identical to the component securities of the index and may invest up to 20% of its assets in certain futures, options and swap contracts, cash and cash equivalents, as well as in securities not included in the index. IHI started in 2006.
Source: seekingalpha.com IHI
IHI has $5.8b in AUM and comes with a 39bps fee. The current yield is .5%. iShares adds that their ETF seeks to track the investment results of an index composed of U.S. equities in the medical devices sector. Dow Jones defines that index as:
This index tracks the performance of companies in the medical equipment subsector. These companies are manufacturers and distributors of medical devices such as MRI scanners, prosthetics, pacemakers, X-ray machines, and other non-disposable medical devices.
Source: spglobal.com Index
They provide some basic statistics, which shows this is a very concentrated index with 71% in the Top 10 stocks.
spglobal.com Index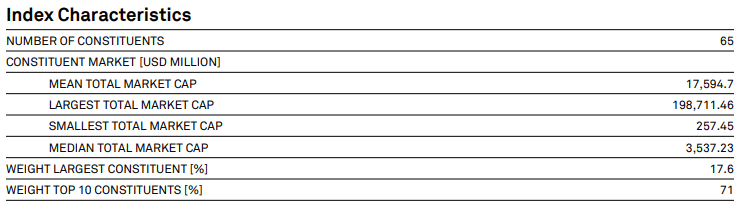
IHI holdings review
IHI is much more focused than IYH in terms of industry exposure.
ishares.com IHI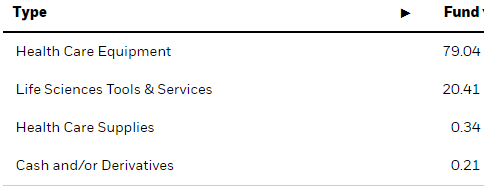
These industries account for about 30% of IYH’s portfolio.
Top 20 holdings
ishares.com; compiled by Author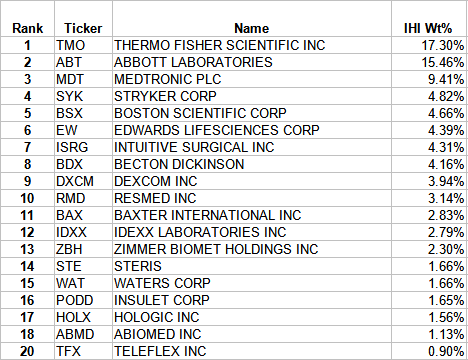
Here, the Top 20 account for 88% of the portfolio, with the biggest two positions combined topping 32%! Only Waters Corp (WAT) is not own by IYH.
IHI distributions review
seekingalpha.com IHI DVDs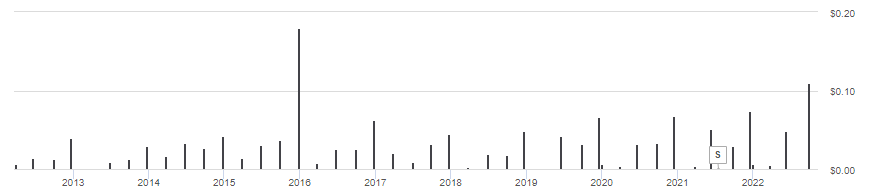
With a .5% yield, not sure how important the payouts are; do not income seekers owning either ETF. That said Seeking Alpha give the ETF a “B-” grade.
seekingalpha.com IHI scorecard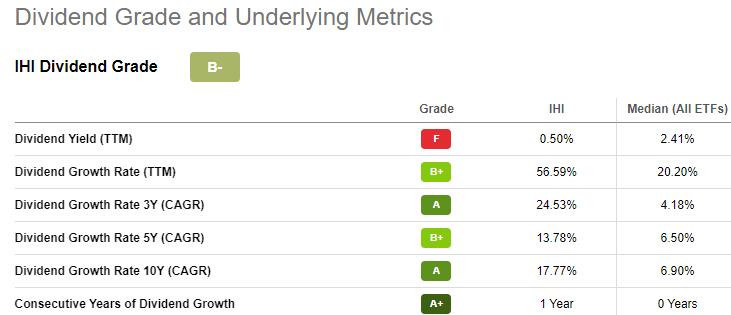
Comparing ETFs
PortfolioVisualizer.com
I added the SPDR S&P 500 ETF (SPY) for comparison purposes. Both medical ETFs have performed better since 2006, also with better Sharpe and Sortino ratios. An additional benefit was their low .8 percent correlation to the US equities market.
When owning similar ETFs, it is important to understand where their holdings overlap. For ETFs, a good website is ETF Research Center.
etfrc.com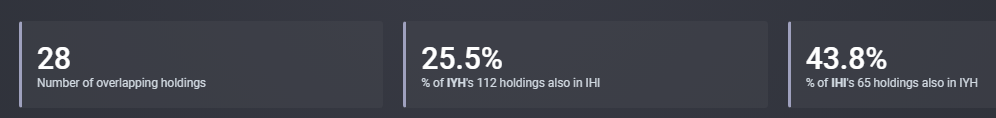
Neither ETF holds that many stocks, especially IHI, where the 28 common holdings equal almost 44% of its positions. Weight-wise, the overlap is only 22% for IYH into IHI, but 92% for IHI into IYH. The next chart shows the largest weighting differences from each ETF’s prospective.
etfrc.com seekingalpha.com IYH seekingalpha.com IHI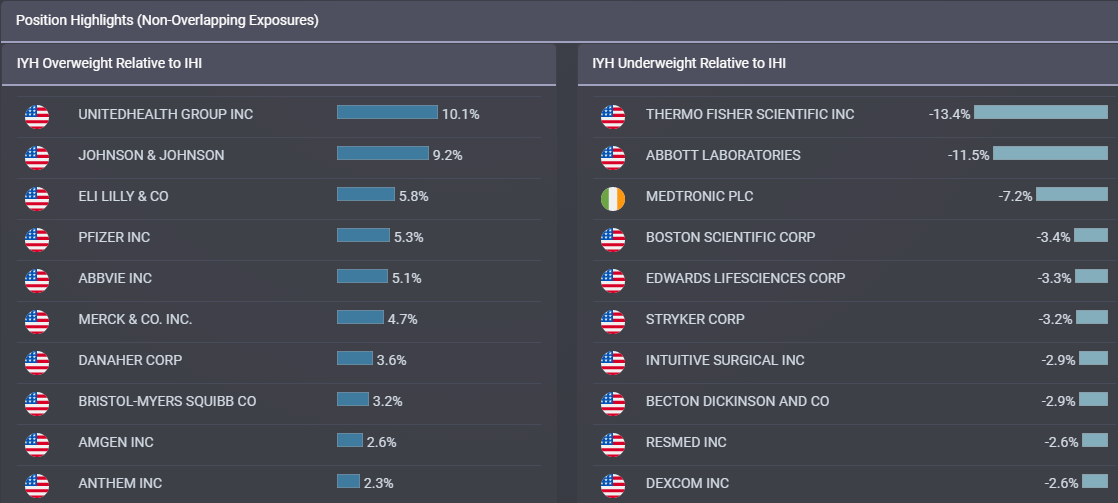
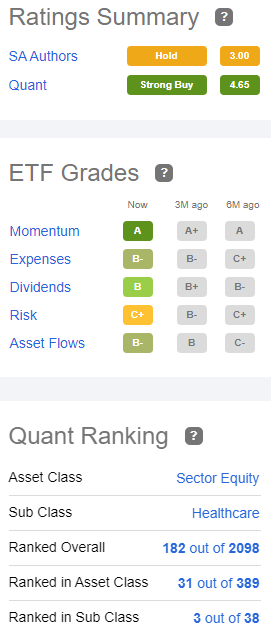
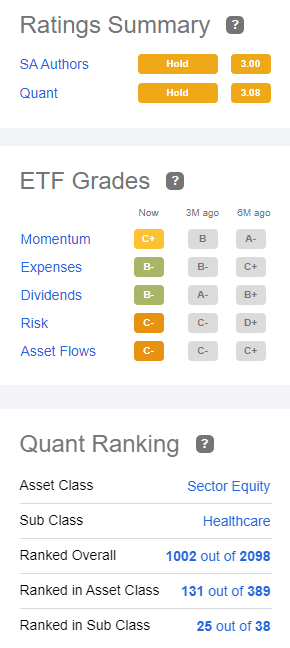
Seeking Alpha’s Quant Ranking system rates IYH the better Buy at this time.
Portfolio strategy
One could look at the results and decide to only hold the IHI ETF since it has the better CAGR or to hold IYH as it has the better risk statistics; either would be a valid strategy. Another was proposed in the article’s title: holding both. Since, by weight, IHI is almost enclosed in IYH, this is what the top 20 holdings would be with a 20/80% allocation of IHI/IYH.
ishares.com; compiled by Author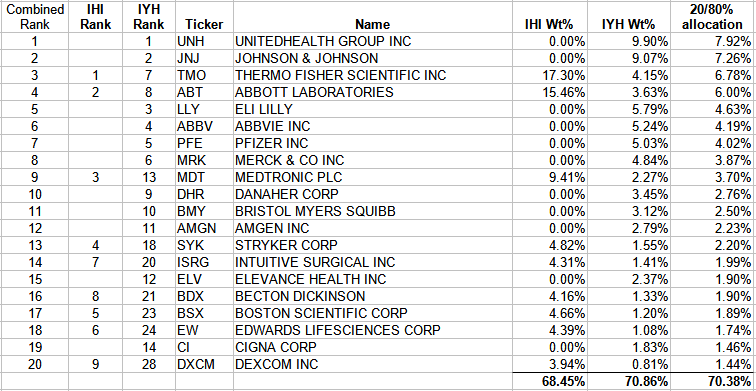
This combination has no stock lower than 28th in either portfolio. No stock only held by IHI is now in the Top 20 listing (it’s #34). For holders of IHI adding IYH, about 62% of the combined allocation comes from stocks only in IYH. In reverse, IYH holders only see 1.5% of their new allocation coming from IHI only stocks. One thing the allocation does for IHI holders is it drastically reduces the individual stock concentration risk, a little less so for the top IYH stocks. This is what such an allocation would have produced.
PortfolioVisualizer.com
As expected, the CAGR falls between the two ETFs but the Sharpe ratio is just so slightly better; the Sortino matches IYH.
Final thought
For investors more confident in their stock selection ability might choose to own one or both of these ETFs and supplement those by adding shares of stocks either held here to adjust the allocation, or add some not held at all to adjust the industry weight exposure provided by owning these ETFs.
Be the first to comment