

D. Homer/iStock via Getty Images
The ALPS | O’Shares U.S. Small-Cap Quality Dividend ETF (BATS:OUSM) targets U.S. dividend stocks utilizing the size, volatility, and quality screens. The allure of the strategy is that investors could reap the benefits of the small-cap equity echelon which is deemed alpha-generating over the long term while also not compromising on profitability and enjoying a yield backed by financial soundness, though only a modest one. However, OUSM has a few nuances I would like to discuss in today’s note.
What principles lie at the crux of OUSM’s investment strategy?
In the past, OUSM saw a few strategy recalibrations.
Incepted in 2016, it initially tracked the FTSE USA Small Cap Qual/Vol/Yield 3% Capped Factor Index until 4 May 2018. Then it switched to the FTSE USA Small Cap Qual/Vol/Yield 3% Capped Factor Index, which it followed until 1 June 2020. Since 1 June 2020, it has been tracking the O’Shares U.S. Small-Cap Quality Dividend Index. After that, in June 2022, the fund was added to the ALPS ETF line-up in the wake of the SS&C’s acquisition of O’Shares ETFs; however, it did not result in profound investment philosophy changes as the fund continued to track the same index.
The O’Shares index targets small-size U.S. companies sporting low volatility, strong quality, and comparatively high while also resilient yields, with the S-Network US Equity Mid/Small-Cap 2500 Index being the selection universe.
For quality, the index provider relies on a mix of profitability and leverage metrics, namely Return on Assets and Total net debt/EBITDA. Screening for the seemingly attractive yields, they use the “logarithm of the trailing-12-month regular cash dividend yield.” For dividend quality, two equally-weighted metrics are taken, namely income available to common shareholders divided by gross dividend and the trailing five-year regular cash dividend growth. Please take notice that the index ignores the energy, materials, and real estate sectors. More details can be found in the index methodology.
OUSM delivers on quality, expectedly lagging on value
So, this ETF brings together small size, quality (leverage & capital efficiency), volatility, and dividend factors in a basket of 116 stocks. The current version of the portfolio is comparatively fresh as it underwent an annual rebalancing in September.
The median market cap in this mix is ~$5.1 billion, with the weighted average at ~$6.7 billion, as of my calculations, so investors who are considering OUSM for small-cap exposure should understand that in reality, this is a mid-cap ETF.
When it comes to profitability & capital efficiency characteristics, OUSM clearly delivers on its promise. Among 116 equity holdings from eight GICS sectors, with most net assets allocated to industrials (22.8%), financials (21.5%), and information technology (~20%), just six have quality issues, with the Quant Profitability rating at D (+/-). These companies are principally utilities, with one exception being J&J Snack Foods (JJSF), a consumer staples player.
Created by the author using data from Seeking Alpha and the fund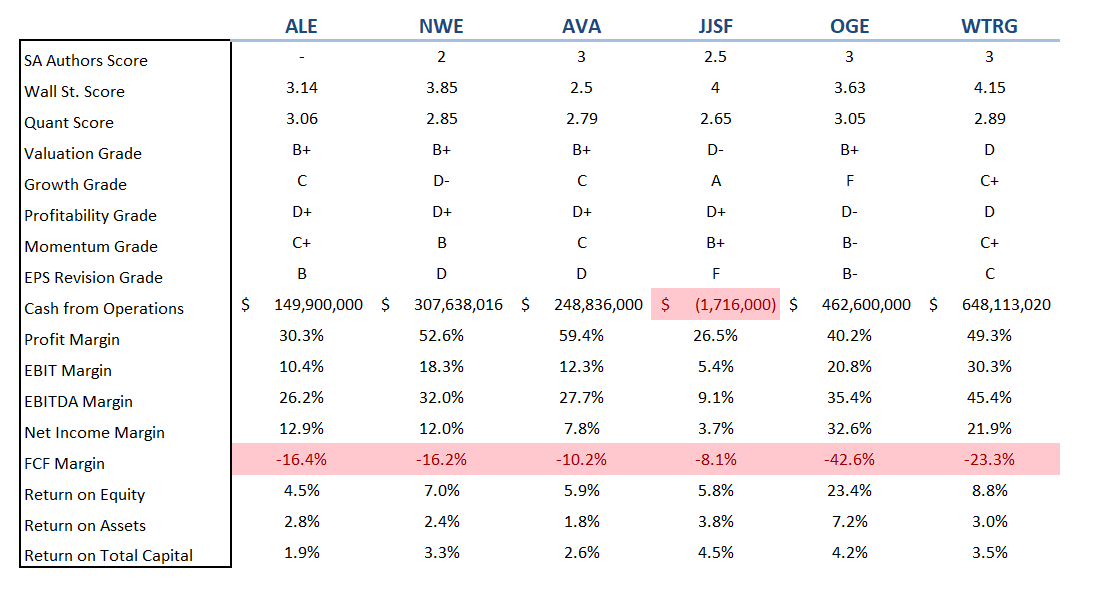
All of the above do have an FCF problem (which bodes ill for dividend sustainability), yet only one player, JJSF, was incapable of delivering a positive number in the last twelve months.
The silver lining here is that they account for a diminutive 1.2% of the portfolio, while those with excellent characteristics (at least a B- rating) have 84.8% weight, which is a more than adequate result for a mid-cap fund. Overall, I spotted just three operating cash flow-negative companies, accounting for less than 3%. Also, none of the holdings is loss-making. In terms of Return on Assets, the weighted-average figure is 10.8%, which is an undoubtedly decent result. For better context, the chart below combines ROA and net income margins; as it can be seen, there is arguably little to criticize.
Created by the author using data from Seeking Alpha and the fund
Yet, quality-centered investing has downsides. Since the fund does not specifically target cheap companies by, for example, tilting the portfolio towards high-yielders only like some maximalist value investment vehicles do, large exposure to the value factor is not to be expected. As a consequence, ~51.4% of the portfolio has a D+ Quant Valuation grade or worse, while only around a quarter is priced attractively (B- and better). Also, the WA Price/Earnings (Last Twelve Months) of this mid-cap ETF is 19x, as per my calculations; in my view, this also points to the fact most holdings are comparatively overappreciated. For context, the iShares Russell Mid-Cap ETF (IWR) has a P/E of 15.88x, according to the fund itself.
A look at returns
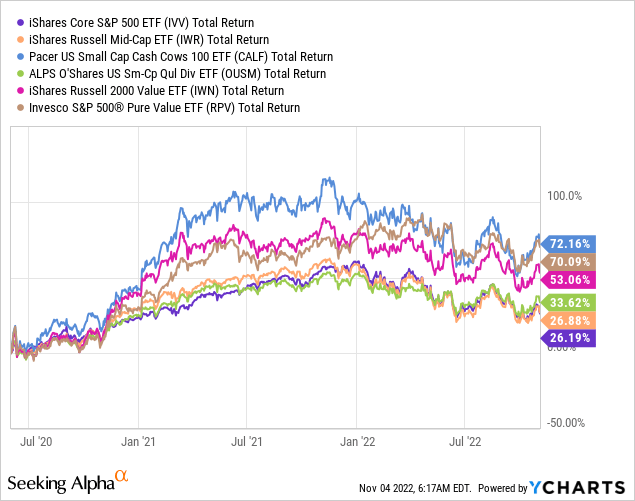
Since the index change, OUSM has outperformed the iShares Core S&P 500 ETF (IVV), as well as the growth/value stocks from the mid-cap segment present in IWR. However, funds more tilted towards the value factor did better, with the FCF-centered Pacer US Small Cap Cash Cows 100 ETF (CALF) being the top performer in this group. The Invesco S&P 500 Pure Value ETF (RPV), one of my favorite large-cap value funds, had only a slightly smaller total return than CALF over that period. The iShares Russell 2000 Value ETF (IWN) outperformed OUSM by almost 20%.
Final thoughts
OUSM is a quality-centered fund investing in U.S. small-size dividend payers. In the current iteration, it is mostly a mid-cap play.
I am positive about its long-term prospects owing to its comparatively strong quality (by the small- and mid-cap echelon standards), yet I am uncertain whether it could beat the S&P 500 systematically since there are insufficient data on returns delivered with the new index.
The fund’s performance this year is much better compared to IVV, with slimmer growth premia in the small-size stocks universe being amongst the likely reasons why its price has not declined deeper.
On the negative side, assuming it shuns energy sector equities, its investors cannot reap all the benefits of this year’s energy crisis that translated into record crude oil and natural gas prices and subsequently engendered massive cash flows for petroleum players, and, hence, record dividends headed into their shareholders’ coffers. However, longer term, this is more of a positive, since the two oil crises of the 2010s vividly illustrated that dividends could be cut steeply or simply suspended without much hesitation in case hydrocarbon prices plunge; valuations in the sector could also crater in a blink of an eye in case the economy sputters and demand sinks.
What concerns me most is that OUSM is a dividend ETF with a D+ Dividend grade, which I would tolerate if it was a sector-focused, growth/value, maximalist quality, thematic, or any other type of investment vehicle. Yet not a dividend one.
The main issue I see with this fund is that with a 1.94% dividend yield, it is barely more attractive than a much less picky IWR. There is no denying that OUSM’s investors are paying a premium for superior quality (for instance, ~76% of its holdings have at least B- Safety grade, like Flowers Foods (FLO)), yet during an era of higher interest rates, with more hikes to come, the income it delivers looks fairly bleak, to say the least.
Another downside is that it comes with a 48 bps expense ratio, which eats into its already fairly slim dividend yield.
So, while acknowledging it did a great job selecting high-quality dividend payers from the small/mid-cap echelon, I see little reason for a Buy rating.
Be the first to comment