

onurdongel
The OPEC Monthly Oil Market Report (MOMR) for September 2022 was published recently. The last month reported in most of the OPEC charts that follow is August 2022 and output reported for OPEC nations is crude oil output in thousands of barrels per day (kb/d). In most of the OPEC charts that follow the blue line is monthly output and the red line is the centered twelve month average (CTMA) output.
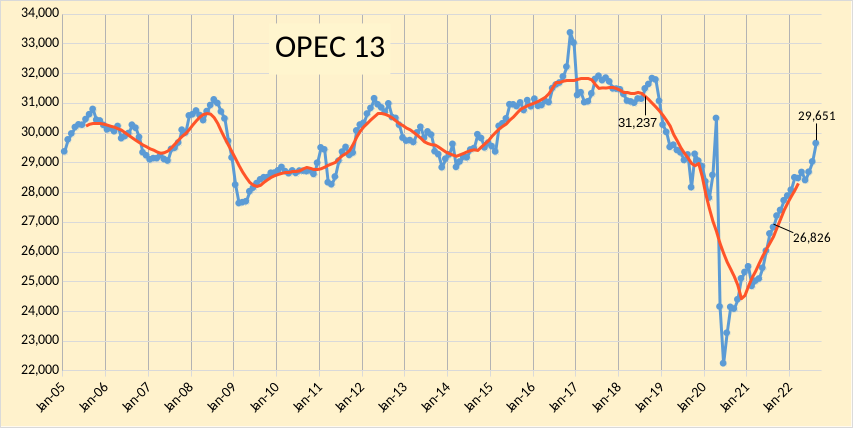
Figure 1
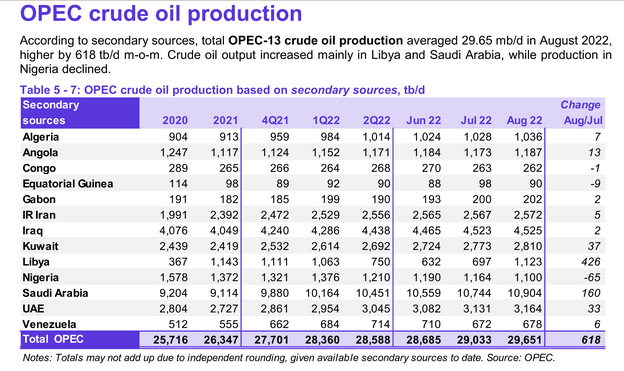
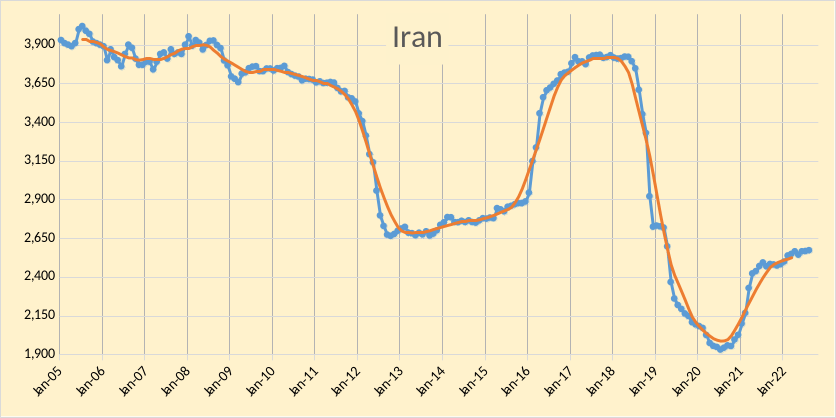
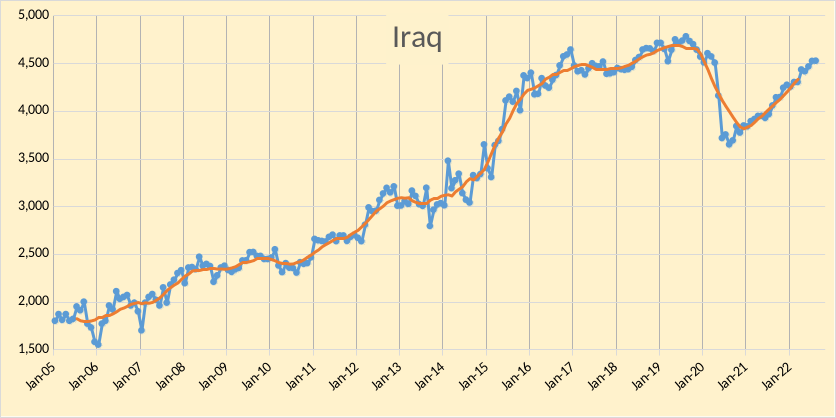
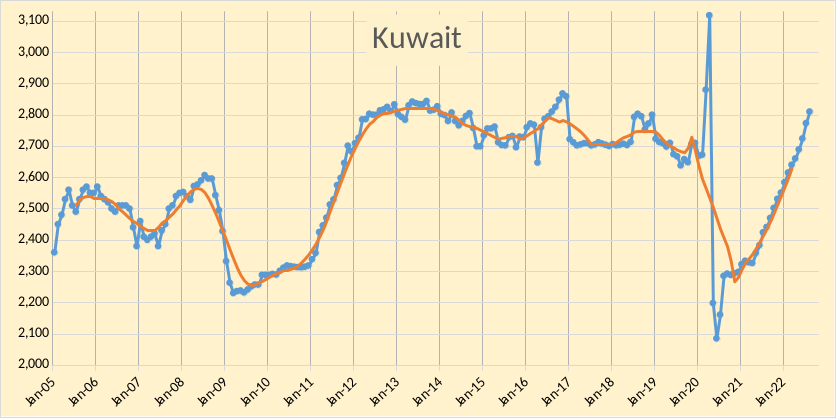
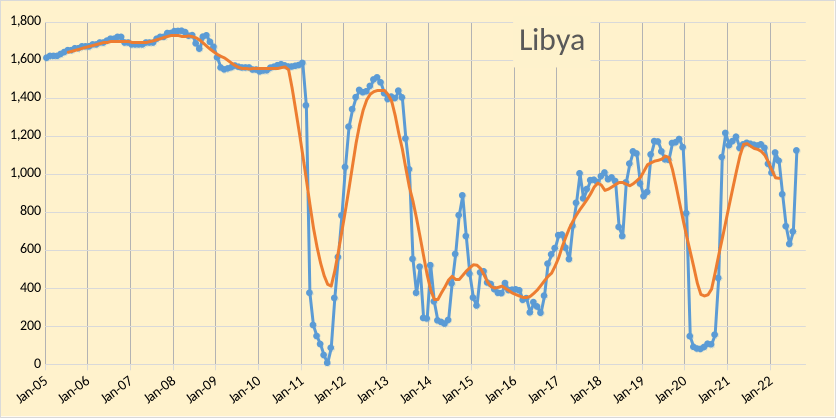
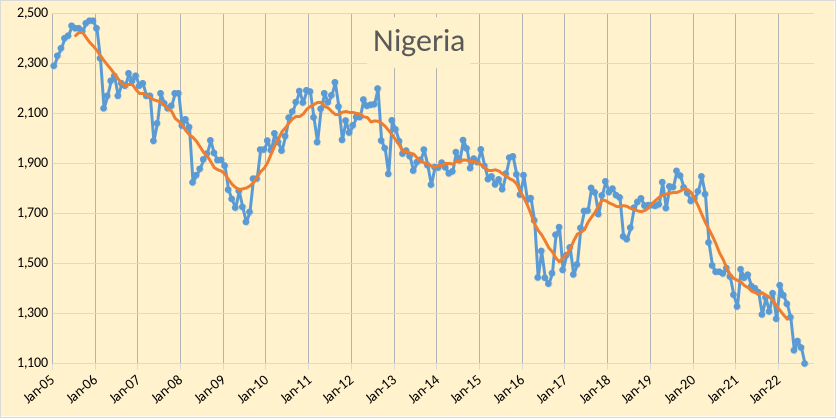
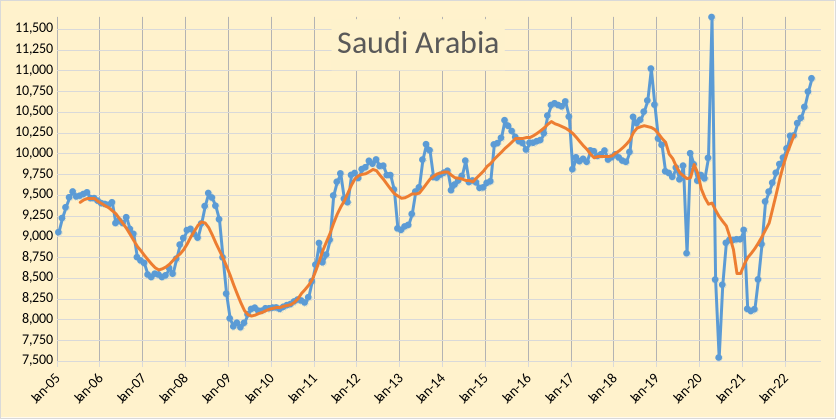
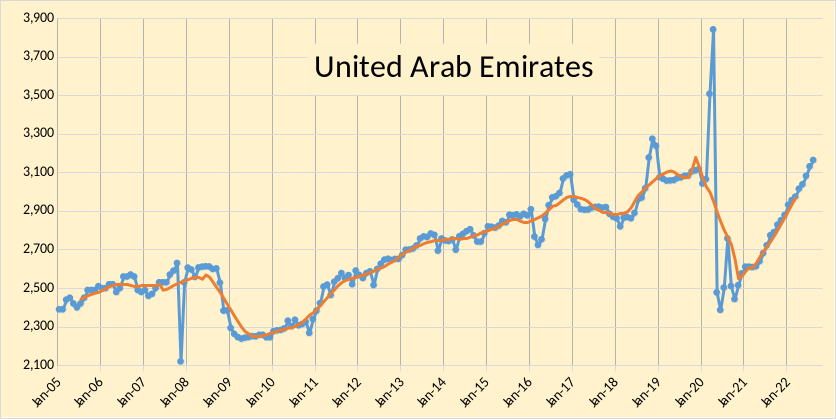
OPEC output increased by 618 kb/d in August after being revised higher in July 2022 by 37 kb/d and June 2022 output was revised up by 5 kb/d compared to last month’s MOMR. The bulk of the August increase in OPEC output (69%) was from Libya(426), with smaller increases from Saudi Arabia(160), Kuwait(37), and UAE(33). Nigeria had a decrease of 65 kb/d. The rest of the OPEC producers had small increases or decreases of less than 20 kb/d with a total increase of 25 kb/d for all 8 nations.
In the chart below we have Russian C + C and OPEC crude oil output. Output in August 2022 was 2192 kb/d below the centered 12 month average (CTMA) in August 2018 of 42,433 kb/d (when the World CTMA of C+C output was at its peak.)
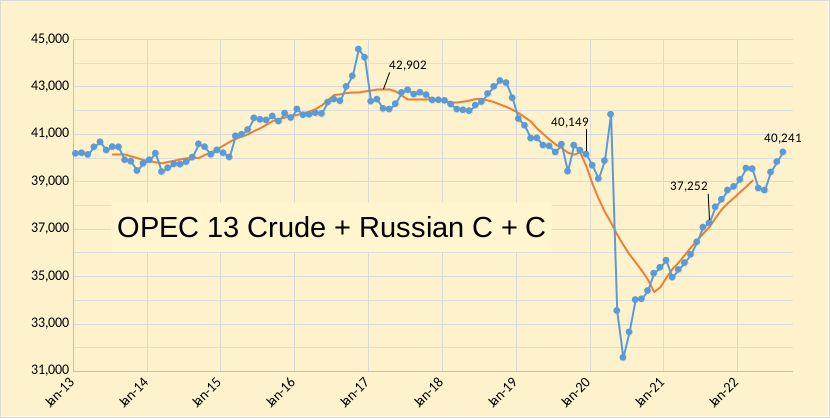
Figure 3
The chart below shows the ordinary least squares trend for the October 2021 to August 2022 period for OPEC crude oil plus Russian C+C output, the average annual rate of increase has been 1623 kb/d over this period. I expect future growth rate will be far slower, possibly close to zero in the near term (next 3 years).
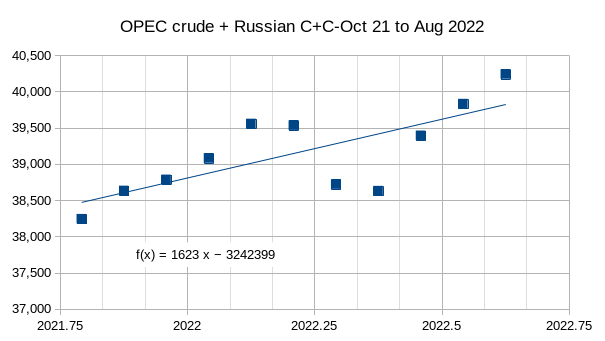
Figure 4
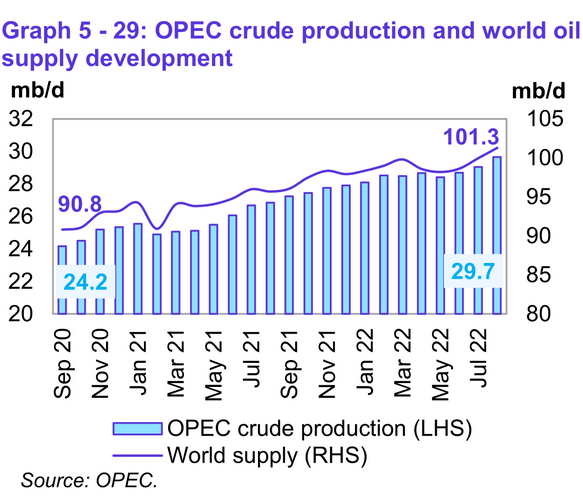
Figure 5
World Liquids supply increased to 101.3 Mb/d in August 2022, about 10.5 Mb/d higher than 2 years ago.
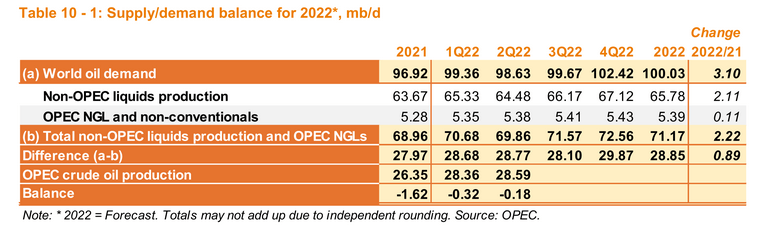
Figure 6
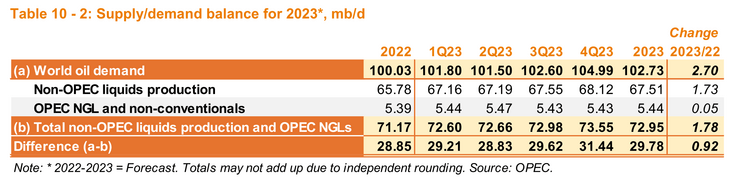
Figure 7
At present it looks like OPEC will be able to meet the call on OPEC in 2022 (if we assume OPEC forecasts for non-OPEC supply and World demand for oil are correct). Without higher output from Iran and with a nuclear compromise seemingly out of reach, it may be difficult for OPEC to meet the call on OPEC for the last quarter of 2023.
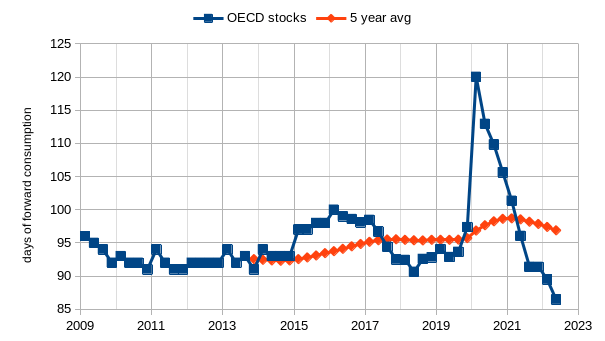
Figure 8
OECD stock levels have fallen to very low levels for the second quarter of 2022 in days of forward consumption at 86.5 days. This is far below the lowest level of 2010 to 2014 (91 days) and well below the trailing 5 year average at its lowest point in 2014 which was 92.3 days. This suggests future oil prices are likely to be high in the future unless we see a robust stock build in the future.
Editor’s Note: The summary bullets for this article were chosen by Seeking Alpha editors.
Editor’s Note: This article covers one or more microcap stocks. Please be aware of the risks associated with these stocks.
Be the first to comment