

sankai
Top Performing Industry
Continuing observation of the semiconductors industry, I’m covering here Onto Innovation (NYSE:ONTO), a company classified as part of the Semiconductors industry by Finviz, but amongst Semiconductor Equipment & Materials by Morningstar. A $4.2 B market cap Onto designs, develops and manufactures process control tools that are used to perform macro defect inspection and 2D/3D optical metrology, lithography, and data analysis systems used by microelectronics device manufacturers.
According to Finviz, the 1-week return of the Semiconductor Equipment & Materials group was 15.75%, while the group Semiconductors achieved a 14.50% return – both being the top-performing industries over the last week.
1-week price performance of industry groups (Finviz.com)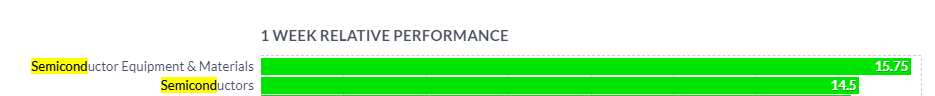
As for the 1-month performance, Semiconductor Equipment & Materials group returned nearly 49%, while the other group returned nearly 26% – with Oil & Gas, Solar, and Copper in between.
1-month price performance of industry groups (Finviz.com)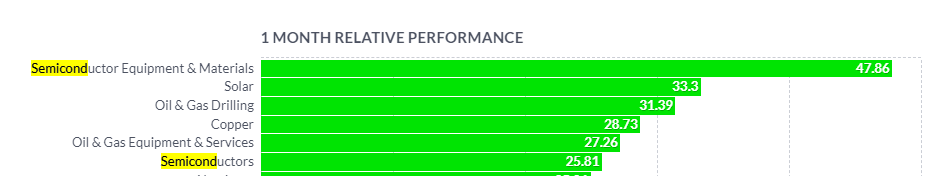
I will analyze Onto Innovation from a perspective of a number of technical analysis tools and show the screenshots of the monthly, weekly, and daily timeframes on the Heikin Ashi candles chart. I will complement the picture with a daily Renko chart. Due to the number of tools, I will show for clarity two screenshots per each of Heikin Ashi three timeframes.
Short Intro to My Favorite Technical Tools
The first chart setup (I will call it Chart 1) uses Bill William’s Alligator indicator and Awesome Oscillator, as well as Ichimoku Clouds and On Balance Volume indicator line. The second chart setting (Chart 2) uses 2 moving averages (10- and 50-period), volume and volume’s 20-period average, MACD (Moving Average Convergence Divergence), Composite Index Divergence Indicator (CIDI), and Directional Movement Indicator (DMI). In order not to repeat in each article the explanation of my personalized approach to these tools, see my last article on Amkor Technology (AMKR) to read more about the methodology I apply.
The Long-Term Trend
For the long-term trend analysis, I use monthly charts. See below Chart 1.
Monthly Chart 1 (Tradingview.com)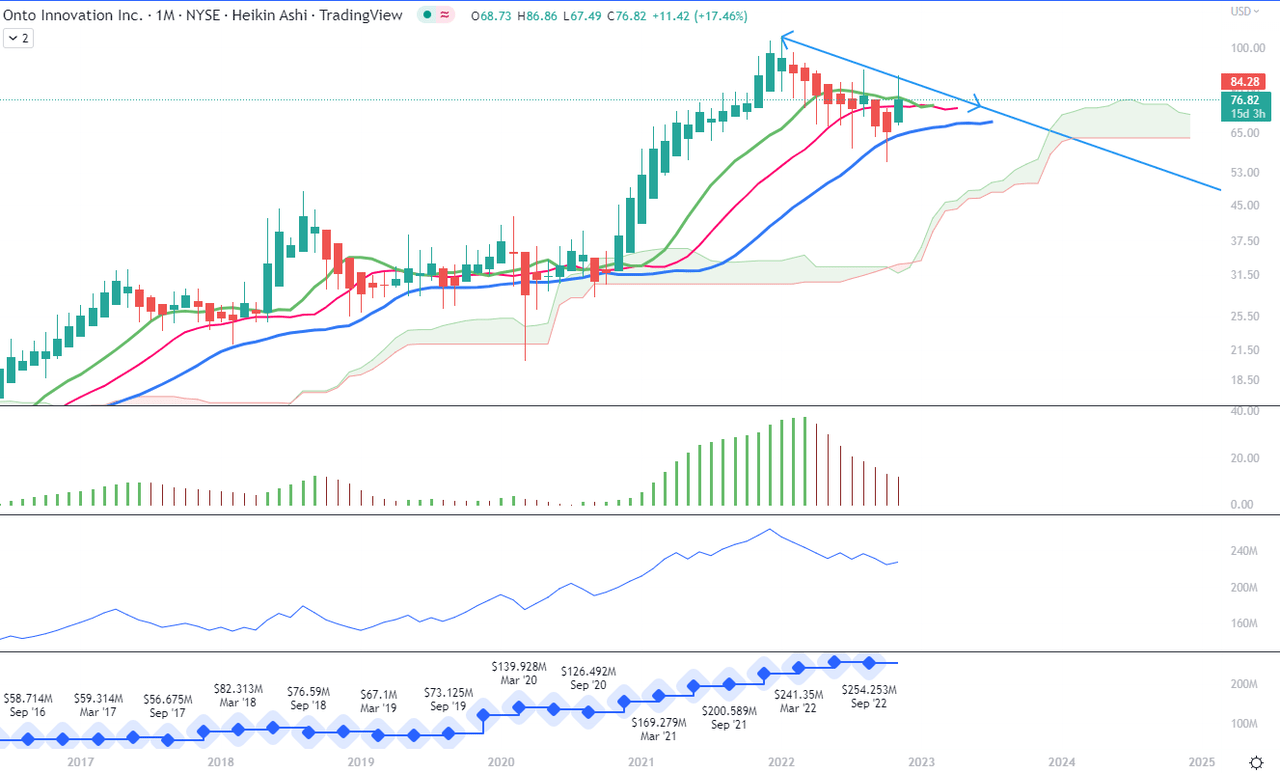
The current month has been so far positive and the candle is green. We see that the trend line is supported by the wick of the November candle and nearly touching the August candle. Alligator’s Lips (red) line is crossing above the Teeth (red) line, both remaining above the Jaw (blue line). Despite a 9-month-long correction of Onto’s price (however, not as deep and dramatic as other companies in the industry), the Ichimoku cloud has remained green and the nearest strong support line lies on the level of $63.20. The Awesome Oscillator is still in red, but the bars are not in a sharp descent: they have a smooth rounded line. On Balance Volume line is heading upwards.
Chart 2 indicates that the selling volume this year has rarely ever reached above-average strength.
Monthly Chart 2 (Tradingview.com)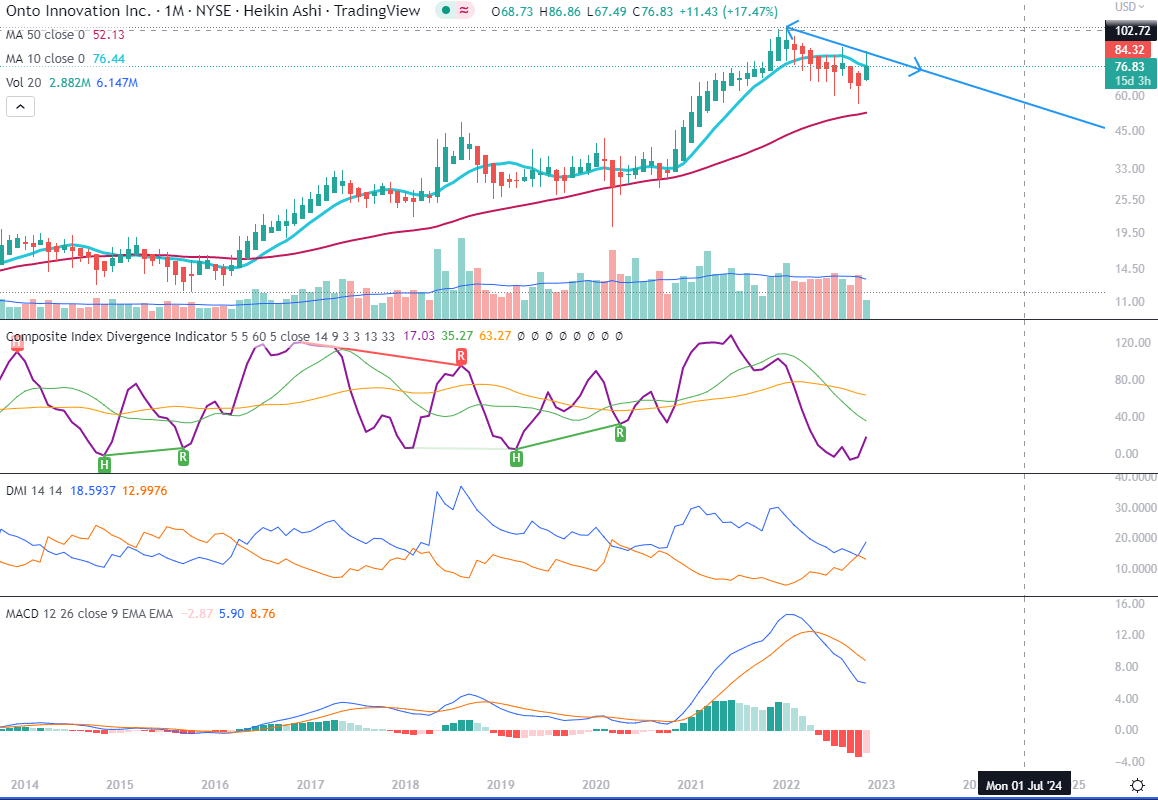
The November candle has crossed above the 10-month MA but still remains to be seen how the month ends. The Composite Index Divergence Indicator line (purple) has bounced back and is heading toward the fast-moving average. Positive Direction Indicator DI+ (DI+) has bounced off the Negative Direction Indicator (DI-), while the monthly MACD has flattened its course still below its signal, leading to a rise in the histogram.
The long-term trend is yet to be confirmed, but the most positive sign is that Onto’s indicators have not really shown any dramatic dip to negative territories, hence also the recovery indicates a slow, steady pick-up.
The Mid-Term Trend
As we can notice on Chart 1, Onto is currently in a downtrend which could potentially still last a couple of months.
Weekly Chart 1 (Tradingview.com)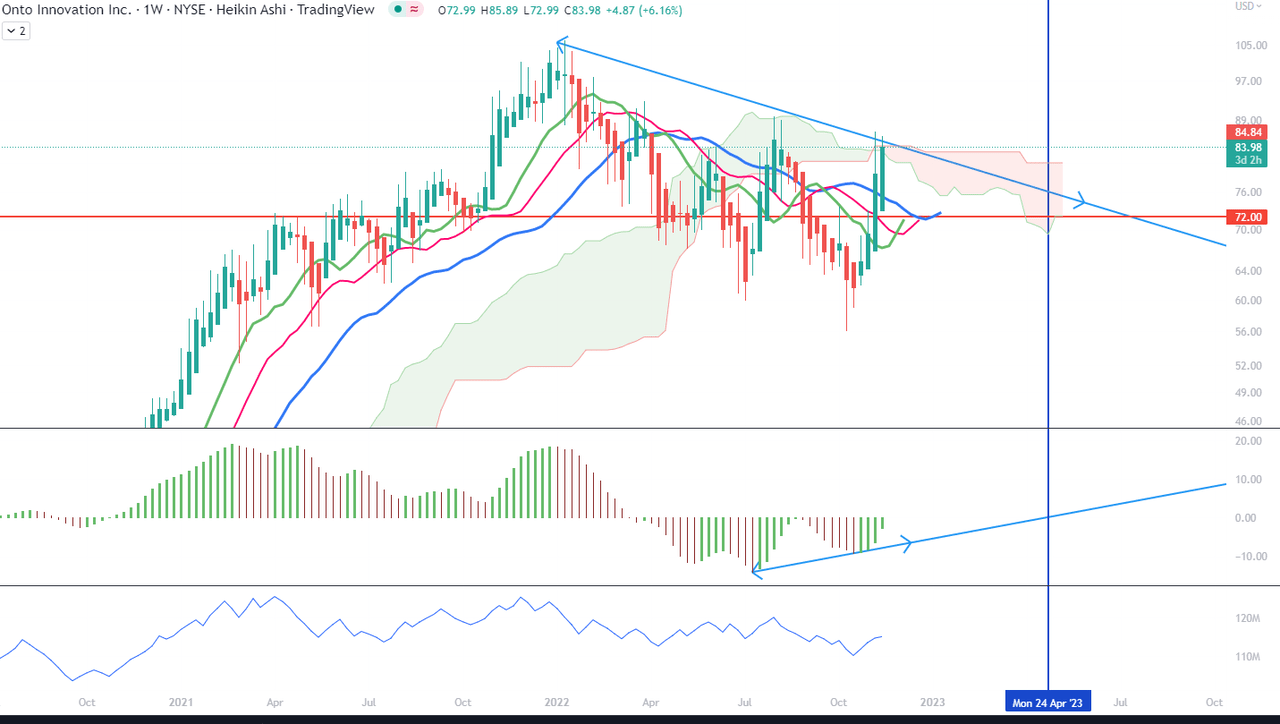
Correction candles have lower lows and the Ichimoku cloud is currently red. However, the Lips and Teeth lines are facing upwards towards the cross with the Jawline. The two averages may not succeed in crossing above the Jawline if the area between $81.40 and $83.40 confirms as a strong resistance zone. The line drawn on the rising bottoms of the AO could indicate that the indicator turns positive only around the end of April 2023 – where I placed a vertical blue line. The same current negative picture is seen on OBV with lower lows and lower highs.
On Chart 2, we can appreciate that the 10-week MA has been under the 50-week MA since April.
Weekly Chart 2 (Tradingview.com)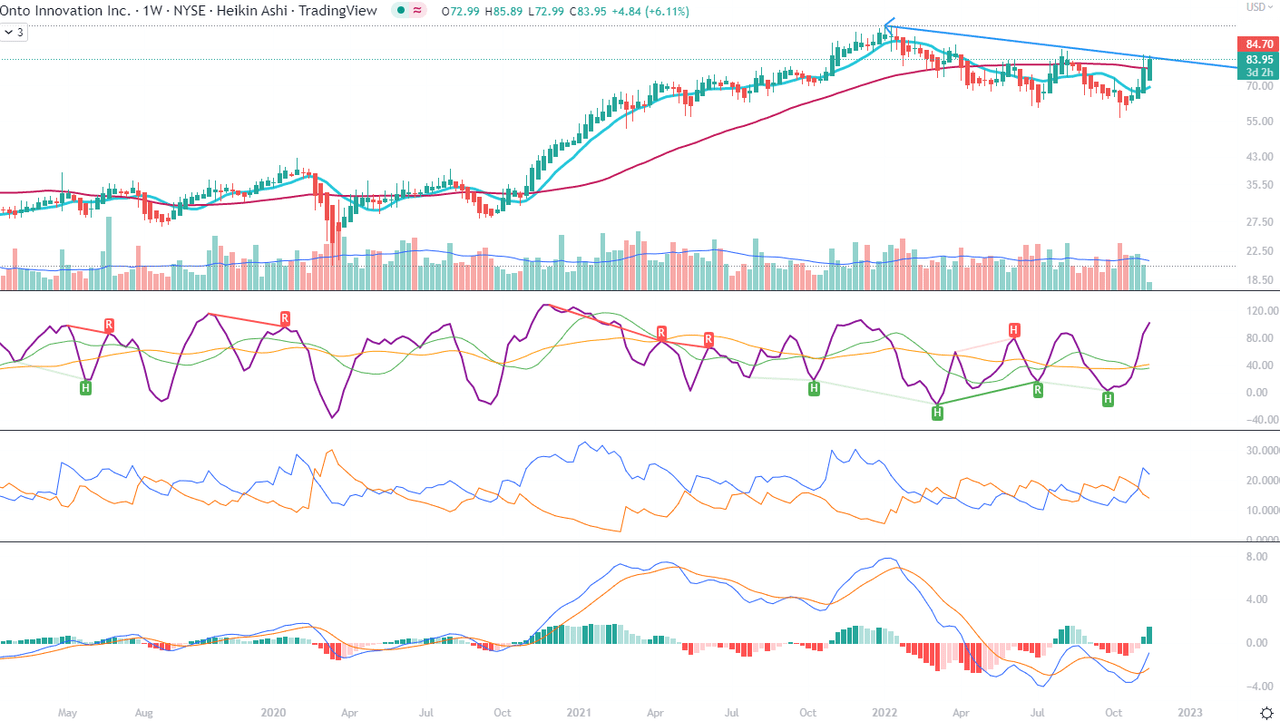
CIDI crossed above both averages, and the fast (green) average seems to be turning upwards to cross the slow (orange) one. DI+ has reached the highest level since January and crossed strongly above the DI-. The weekly MACD flattened below zero level and is heading upwards toward the zero level.
The Short-Term Trend
As we can see on Chart 1, the upswing that started around October 20 may be coming to the end and may correct to the level of $72, which I marked with a red horizontal line. It may as well test the lowest of this year’s lows.
Daily Chart 1 (Tradingview.com)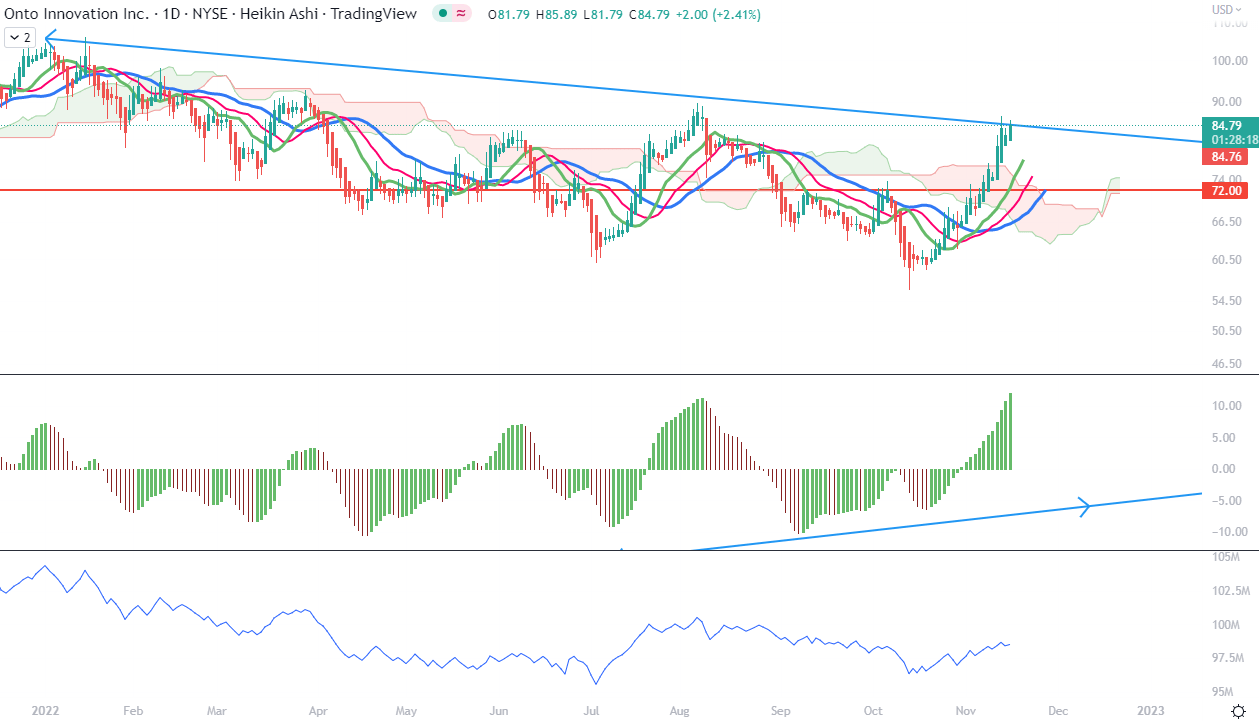
All three lines of the Alligator indicator have spread widely and seem to come to the end of steam.
On chart 2, we can appreciate that all the indicators (CIDI, DMI, MACD) seem to have topped a short cycle and a correction on this timeframe may be coming.
Daily Chart 2 (Tradingview.com)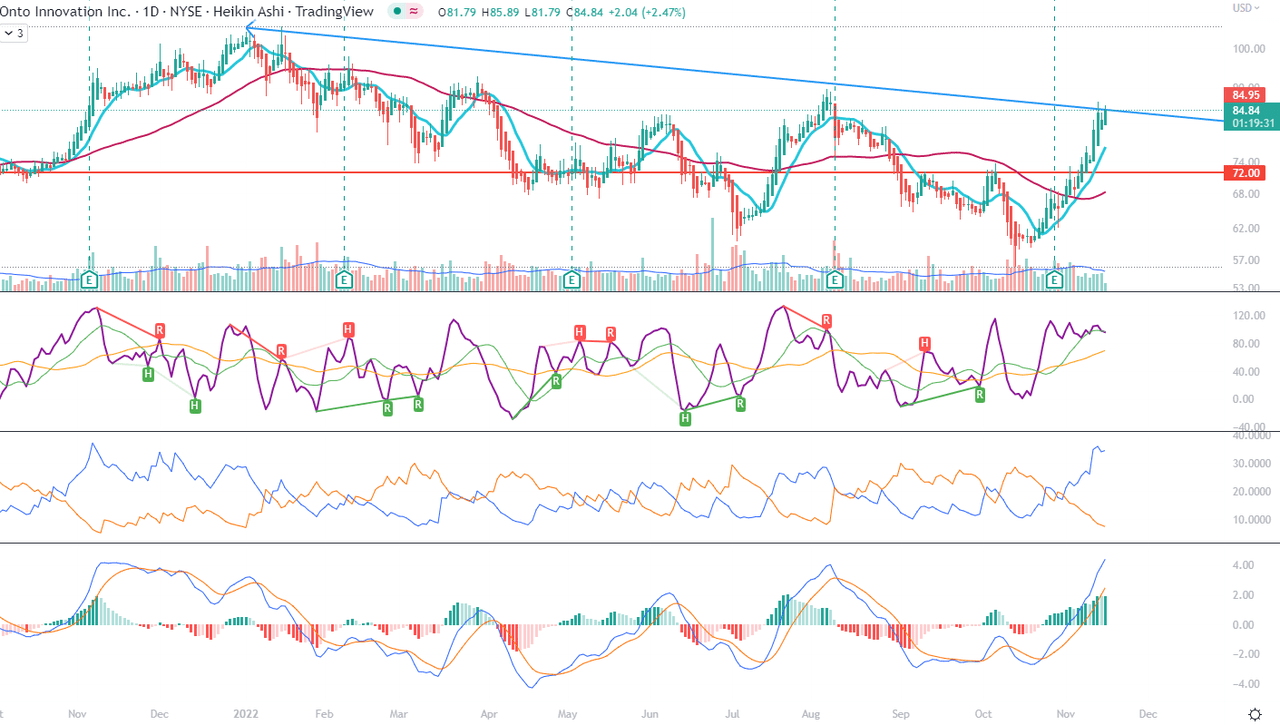
The most positive signs I see, however, are in the rising lows of CIDI and MACD and stronger highs of both DMI and MACD. Also, 50-day MA seems to have made a rounder bounce-back.
Price Momentum
The daily Renko chart does not provide a decisive response to the question of whether Onto is on the cusp of break-out or break-down. The 10-box MA would still need to cross the 50-box average. However, I want to draw your attention to the MACD calculated on the Renko chart. It behaves differently than MACD for regular candles. This one on Renko charts moves more decisively and may mark a strong reversal. In the case of Onto, the best sign would be if MACD crossed the zero line.
Daily Renko Chart (Tradingview.com)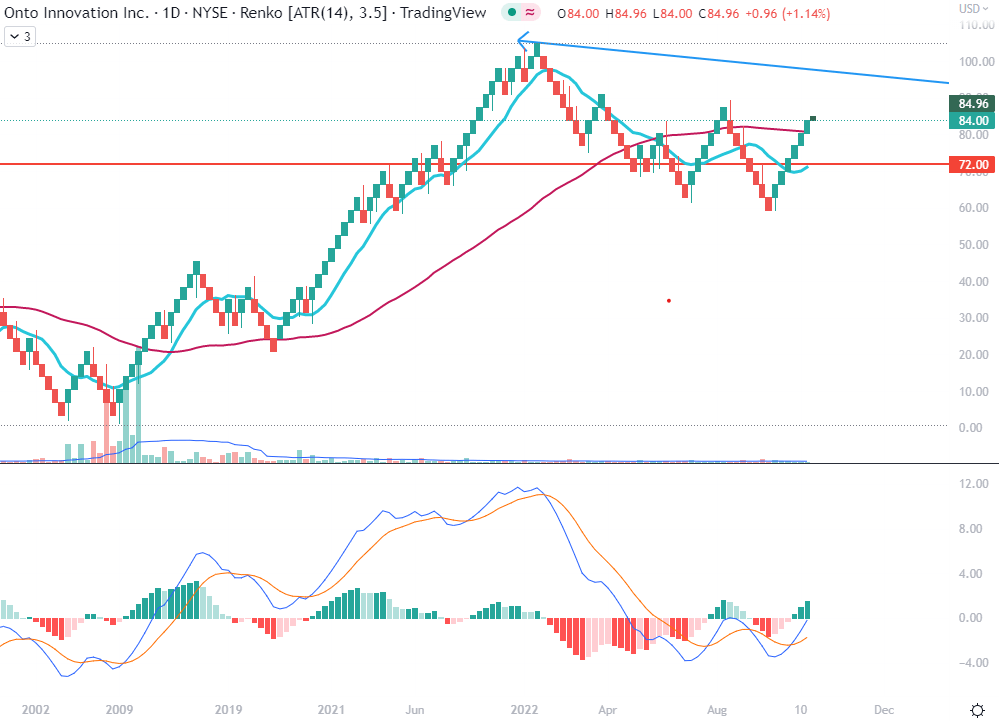
Conclusion
Onto Innovation is a relatively strong company when it comes to its growth and profitability. It has had a Revenue growth of 36% YoY, close the double the sector median, while the Diluted EPS growth YoY was more than triple the sector median (75% vs nearly 17%, respectively). However, the time to jump on shares has not come yet. I suggest you use one of the described indicators and set an alert on a low- or mid-term timeframe to monitor the price action and direction. For me, Onto Innovation is currently a Hold.
Be the first to comment