

Darren415
This article was first released to Systematic Income subscribers and free trials on Nov. 8.
In this article, we catch up on Q3 results from the Business Development Company BlackRock TCP Capital Corp (NASDAQ:TCPC). TCPC is currently trading at a dividend yield of 9.6% and a valuation of 94%.
TCPC is currently fairly-valued in our view as its historic total NAV returns and its valuation are both at the sector average level. As we discuss below, however, TCPC occasionally dips to a significant discount relative to the sector average at which point it becomes an attractive hold.
Quarter Update
TCPC NAV came in near the top of the sector, increasing by 1.1% from Q2. As we discuss below this is primarily due to a large level of retained income. That said, it’s still good to see net flat realized and unrealized gains which suggests that the portfolio is holding up very well in this environment.
Systematic Income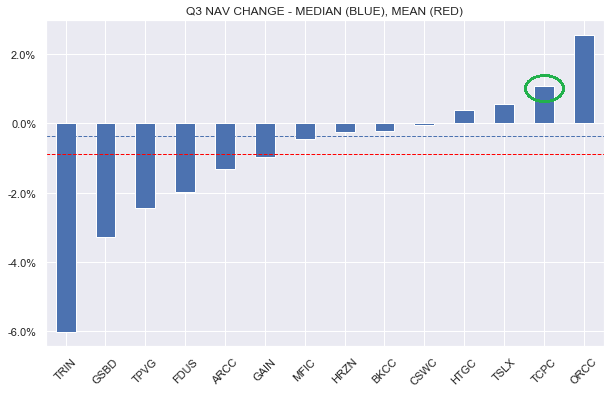
The company’s Q3 total NAV return came in at a bit over 3% or more than 1% above the average of BDCs in our coverage that have reported as of this writing.
Systematic Income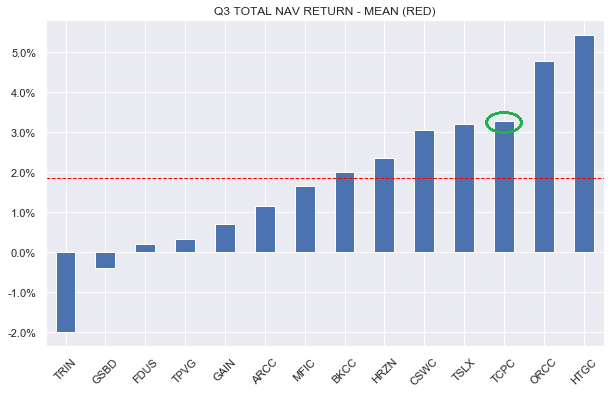
Net income came in at $0.422 – a 15% jump from Q2. Looking at the chart below of steadily rising net income versus a flat dividend shows why the company decided to raise the dividend to $0.32. What’s surprising is not the dividend raise but how late it is and how small it is. At the new $0.32 dividend the dividend coverage is a ridiculous 132%. And although there was $0.06 of non-recurring income during Q3 (and there is always some), recurring income is still well above the new dividend. The company’s spillover is a healthy $1.17 or a bit over three months of base distributions.
Systematic Income BDC Tool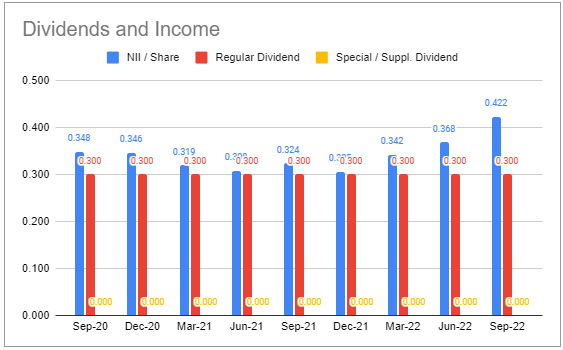
This strong rise in net income does not fully take into account the ongoing rise that is already baked in. 3M Libor finished the quarter at 3.75% and is now 4.56%. In short, not only is Libor already much higher than it was at quarter-end but even the 3.75% as of the quarter-end has not fully made its way into Q3 income. In other words, the $0.422 significantly understates the company’s current level of income generation.
Total investment income rose for the fourth straight quarter and now stands at the highest level in the last couple of years.
Systematic Income BDC Tool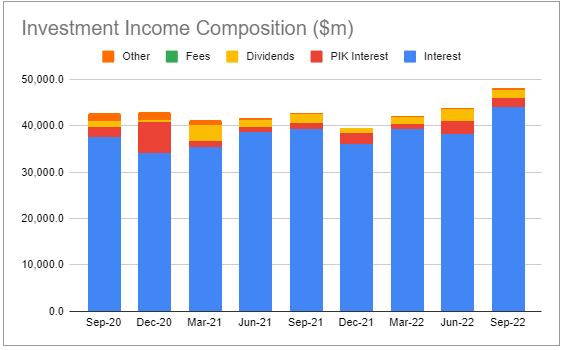
Income Dynamics
There were sizable repayments in the portfolio (along with associated fees) and this will be a small headwind for income in the near term.
Systematic Income BDC Tool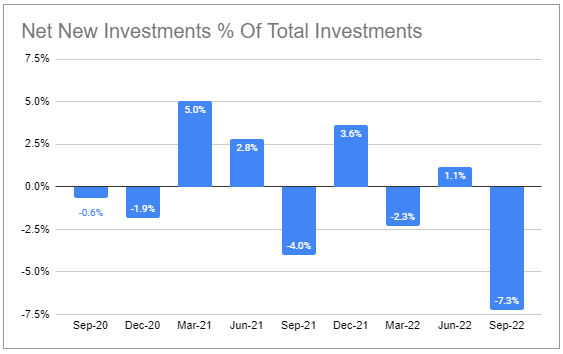
Net negative new investments also caused leverage to fall slightly. That said, TCPC leverage remains slightly above the sector average.
Systematic Income BDC Tool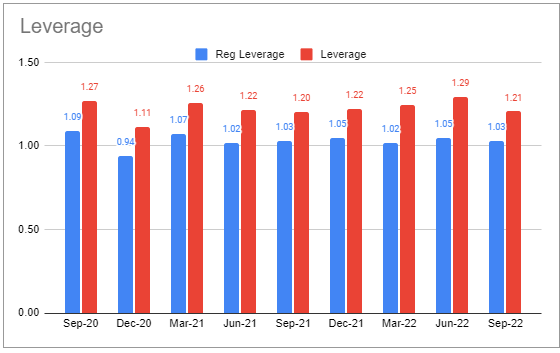
Yield on debt assets increased sharply from 9.8% to 11.3% while interest expense increased only slightly.
Systematic Income BDC Tool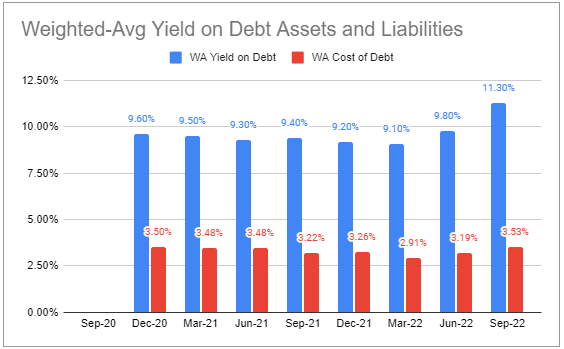
The company maintains a below-average amount of floating-rate liabilities while its level of floating-rate assets is above the sector average – a great combination in the current environment. These two features, along with above-sector leverage, result in a high net income beta to rising short-term rates. Its earliest fixed-rate debt maturities are in 2024, mostly in the second-half of the year.
Systematic Income BDC Tool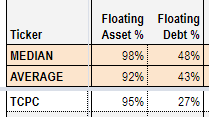
The company expects sizable gains in net income as short-term rates continue to rise.
Systematic Income BDC Tool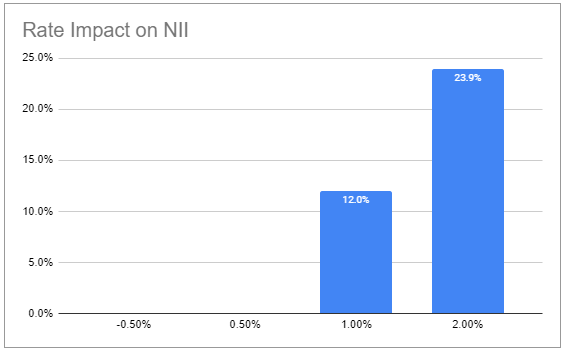
Yields on new assets of 11.3% came in above exits of 9.9% during the quarter, providing a further tailwind to income in the coming quarter.
Finally, the company’s interest expense of just 3.5% (vs. 3.9% sector average) is a function of its well-timed refinancings as well as its investment-grade rating.
Portfolio Quality
Non-accruals remained at 0.3% on fair value. There were no additional non-accruals in the portfolio over the quarter.
Systematic Income BDC Tool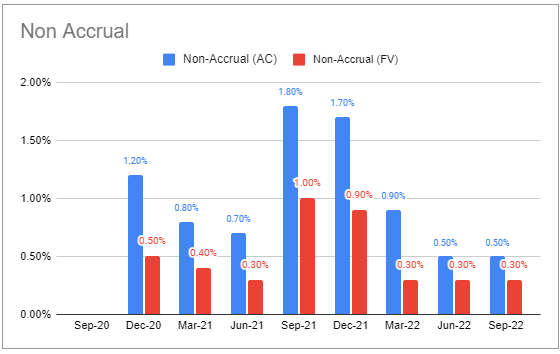
PIK fell over the quarter and is below the sector average level.
Systematic Income BDC Tool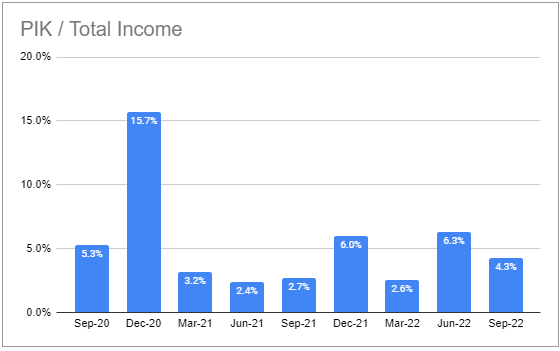
Unfortunately the company does not disclose internal bucketed portfolio ratings as most others, however we can get a good sense of a shift in portfolio quality from the NAV and non-accruals which were very healthy.
Management have commented that the rough weighted average interest coverage of the portfolio is 2.5x. Anecdotally this is on the low side in the sector however it has been trending up.
Valuation And Return Profile
As always, valuation of any given BDC has to be gauged in relation to the level and stability of its historic total NAV returns. If we look across various time horizons, TCPC has tended to deliver above sector-average returns though not by much.
Systematic Income BDC Tool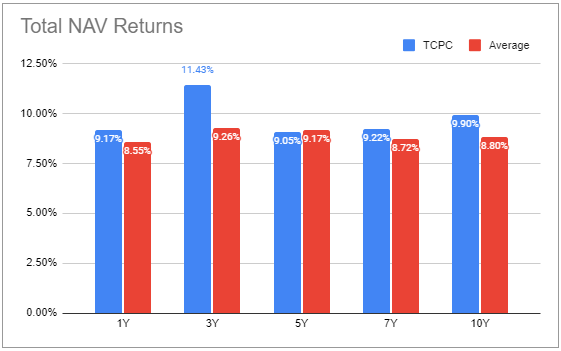
The consistency of returns has wavered somewhat – as the company underperformed (yellow line below zero) in the period of 2017 to 2020, then outperformed (yellow line above zero) in the period of 2020 to 2021 and has been running close to the sector average as the following chart shows.
Systematic Income BDC Tool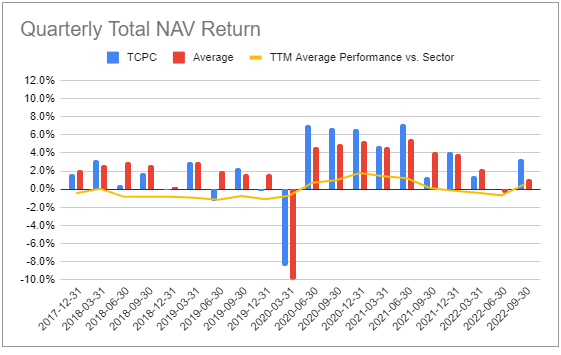
The valuation of TCPC has been counterintuitive but not unusual. In the period it underperformed the sector it tended to trade above the sector-average valuation and in the period it outperformed the sector it tended to trade below the sector average valuation.
Systematic Income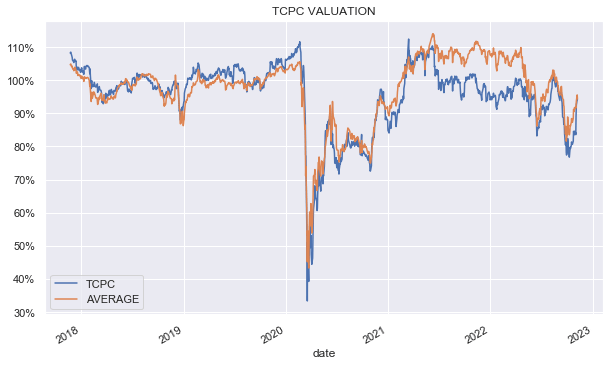
The chart below shows its relative valuation more clearly.
Systematic Income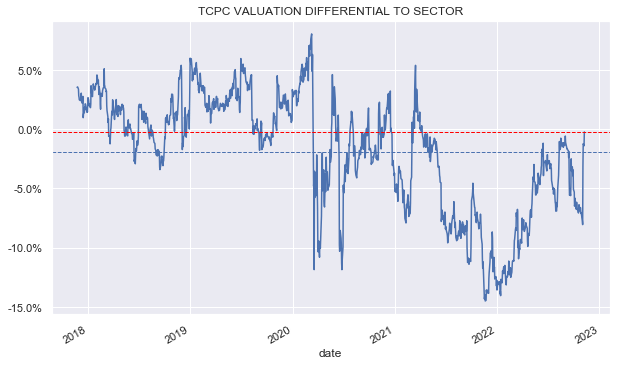
In an earlier article we discussed our strategy for TCPC. Although TCPC was an average performer, allocating to it at a double-digit valuation discount vs. the sector average was an attractive proposition. The chart below comes from the article and shows the valuation differential between TCPC and the sector average. It also shows our initial allocation (blue vertical line) and the subsequent sale (red vertical line).
Systematic Income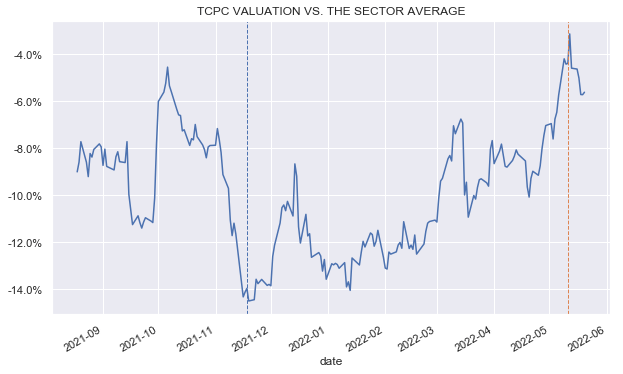
More recently, TCPC has started to become fairly attractive as it moved out to a high single-digit valuation discount vs. the sector but it has since rallied back to the sector-average level on the back of its strong Q3 results. The key point here is that, as a fairly-average performer, TCPC may not make anyone’s top BDC lists but at a significant discount versus the sector average, which the stock occasionally dips down to, it becomes a very attractive proposition.
Takeaways
TCPC caught a bid recently on the back of its dividend hike after consistently outearning it. However, even with this rise, distribution coverage remains one of the highest in the sector. The company’s relatively stingy distribution may be annoying to some investors however there are also some benefits. First, it allows the company to use the retained income to compound returns. And two, it arguably keeps the valuation lower than it would otherwise be if the yield were higher. This, in turn, allows investors to compound their dividends from TCPC at a lower valuations.
Another attractive feature of TCPC is its historic resilience through previous macro shocks we discussed earlier. This increases the likelihood that the company will navigate the coming challenges reasonably well.
Systematic Income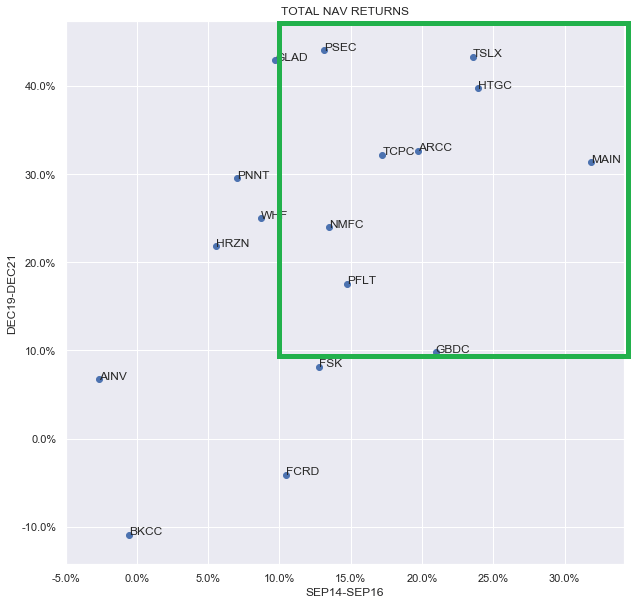
Be the first to comment