


Deagreez
Today’s market seems crazy to many, and I understand why. Interest rates have gone vertical, not just in the US but globally.
The UK is in chaos, with a recent crisis in their bond market resulting in 50% decline in 30-year UK bonds in a matter of days.
- for one week, the 30 year UK treasury bond was 5X more volatile than Bitcoin
90% of the UK pension industry was at risk of bankruptcy, forcing the Bank of England to state that for one month it would buy an infinite amount of long bonds to stabilize England’s financial markets.
Global stocks sold off on the news, and now Europe and the UK are facing an energy crisis that makes recession all but inevitable. For now the US has managed to avoid this fate, but recession risk is elevated here as well.
The US market is down five consecutive weeks and three quarters in a row. The last time that happened was in 2009.
The US bond market is having its worst bear market in history and a 60/40 is down 21% on the year. That’s the worst performance since 1937.
In this time of chaos, when “risk-free” government bonds literally trade like cryptos and there seems no place to hide, the idea of dependable blue chips is more important than ever.
How To Determine The Most Dependable Dividend Blue Chips
Dividend safety and steady growth, like what you get from dividend aristocrats, is one kind of dependability that helps income investors sleep well at night in turbulent times.
But there’s more to dependability than just a safe and steadily-growing dividends.
The Dividend Kings uses a 100 point dependability model that incorporates:
- dividend safety
- dividend growth dependability
- moatiness and business model stability
- management quality
- historical and future expected growth rates
- historical and future expected total returns
- long-term risk management scores from seven risk rating agencies (such as S&P, Moody’s, MSCI, and Morningstar)
This is part of our 296 point safety and quality model, designed to help members always know what companies are the safest, highest quality, and most dependable companies to entrust with their hard earned savings.
Let me show you how you can very quickly and easily find the most dependable high-yield, world-class blue chips during these crazy times.
How To Find The 5 Most Dependable High-Yield Blue-Chips… In 2 Minutes
I use the Dividend Kings Zen Research Terminal for every article I write.
It runs off the Dividend Kings 500 Master List.
The DK 500 Master List is one of the world’s best watchlists, including
-
every dividend aristocrat (S&P companies with 25+ year dividend growth streaks)
-
every dividend champion (every company, including foreign, with 25+ year dividend growth streaks)
-
every dividend king (every company with 50+ year dividend growth streaks)
-
every foreign aristocrat (every company with 20+ year dividend growth streaks)
-
every Ultra SWAN (wide moat aristocrats, as close to perfect quality companies as exist)
-
40 of the world’s best growth stocks
Here’s the very simple screen I used to find five high-yield super dependable blue-chips for these crazy times.
| Step | Screening Criteria | Companies Remaining | % Of Master List |
| 1 | Reasonable Buy, Good Buy, Strong Buy, Very Strong Buy, Ultra Value Buy (Never Overpay For Stocks) | 394 | 78.17% |
| 2 | Dividend Safety Score 81+% (Very Safe, 2% or less risk of a cut in a severe recession) | 255 | 50.60% |
| 3 | 3+% Yield | 91 | 18.06% |
| 4 | 10+% Consensus LT Total Return Potential | 67 | 13.29% |
| 5 | Add “Dependability Score” | NA | NA |
| 6 | Sort By Dependability Score | NA | NA |
| 7 | Use Watchlist Builder To Select Top 5 Super Dependable High-Yield Blue-Chips | 5 | 0.99% |
| Total Time | 2 minutes |
In just two minutes we can sort through 500 of the world’s best blue chips to find the five that are the most dependable options for high-yield investors today.
5 Super Dependable High-Yield Blue-Chips For These Crazy Times
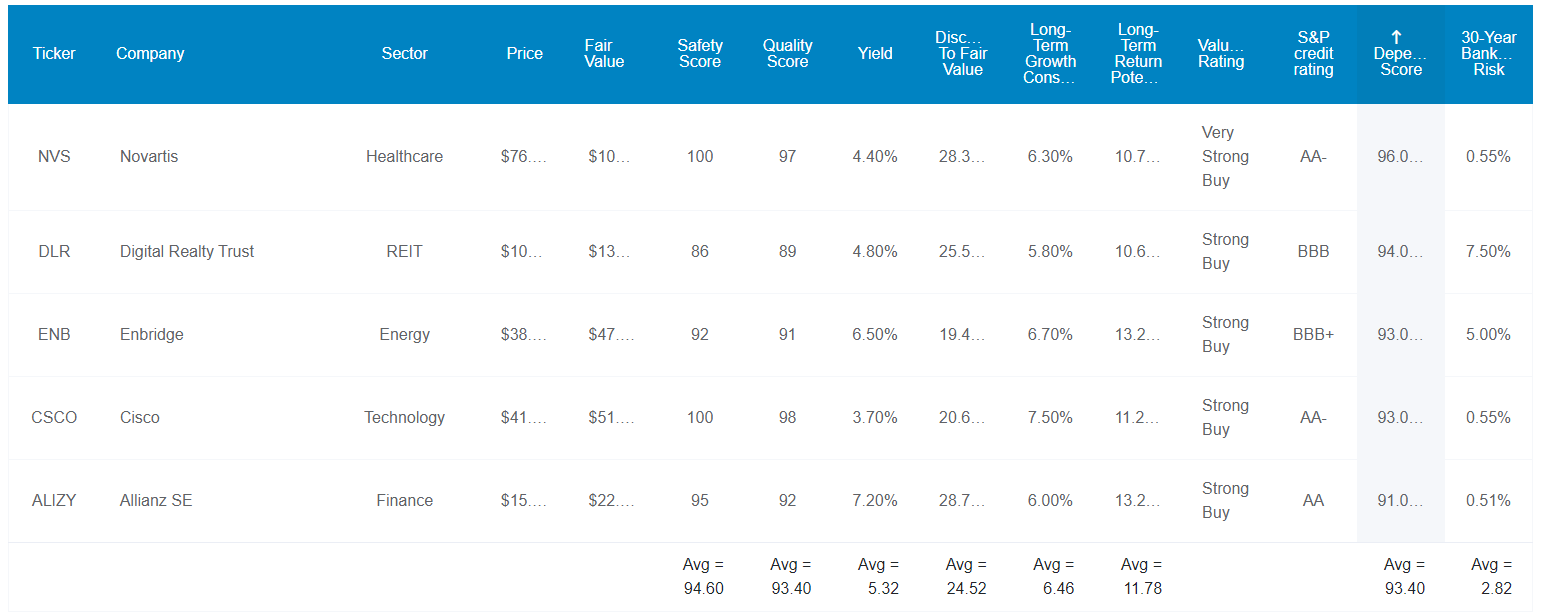
(Source: Dividend Kings Zen Research Terminal)
I’ve linked to articles about each company’s investment thesis, growth outlook, risk profile, valuation, and return potential. Here they are in order of highest to lowest dependability.
- Novartis (NVS) – global aristocrat
- Digital Realty Trust (DLR)
- Enbridge (ENB) – global aristocrat
- Cisco (CSCO)
- Allianz (OTCPK:ALIZY) – rating agencies call it the world’s best run insurance company
Tax Implications
- ENB is Canadian
- 15% dividend tax withholding ONLY IN TAXABLE ACCOUNTS
- none in retirement accounts
- tax credit available for taxable accounts to recoup the withholding
- NVS is Swiss (15% withholding under US tax treaty)
- BUT requires paperwork filed by your broker otherwise it’s a 35% withholding
- ALIZY is German
- 26.375% withholding
- own ALIZY and NVS in taxable accounts to be eligible for the tax credit
- own ENB in retirement accounts to avoid the withholding
FAST Graphs Up Front
Novartis 2024 Consensus Total Return Potential
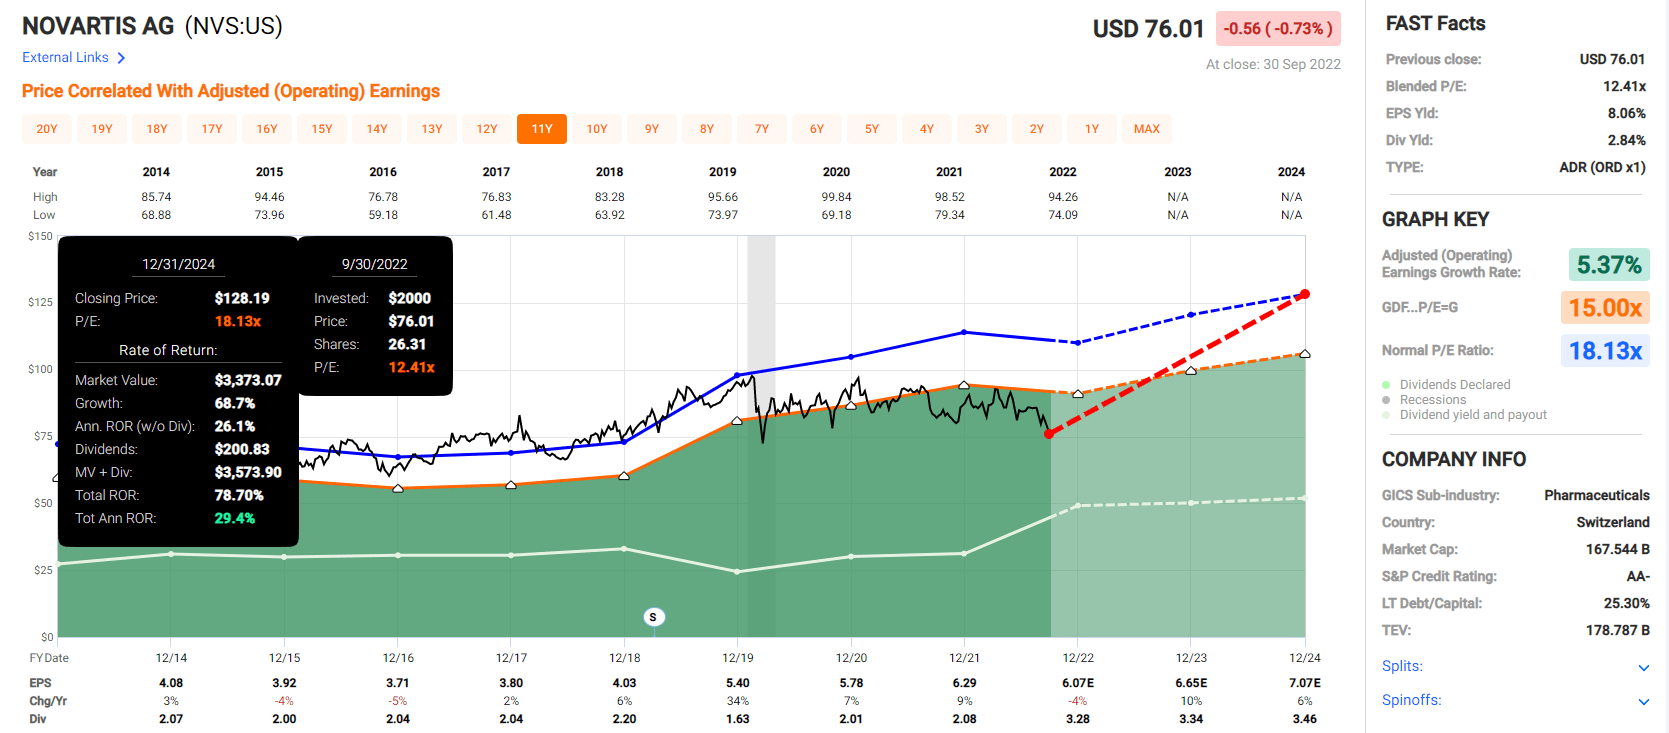
(Source: FAST Graphs, FactSet Research)
Digital Realty Trust 2024 Consensus Total Return Potential
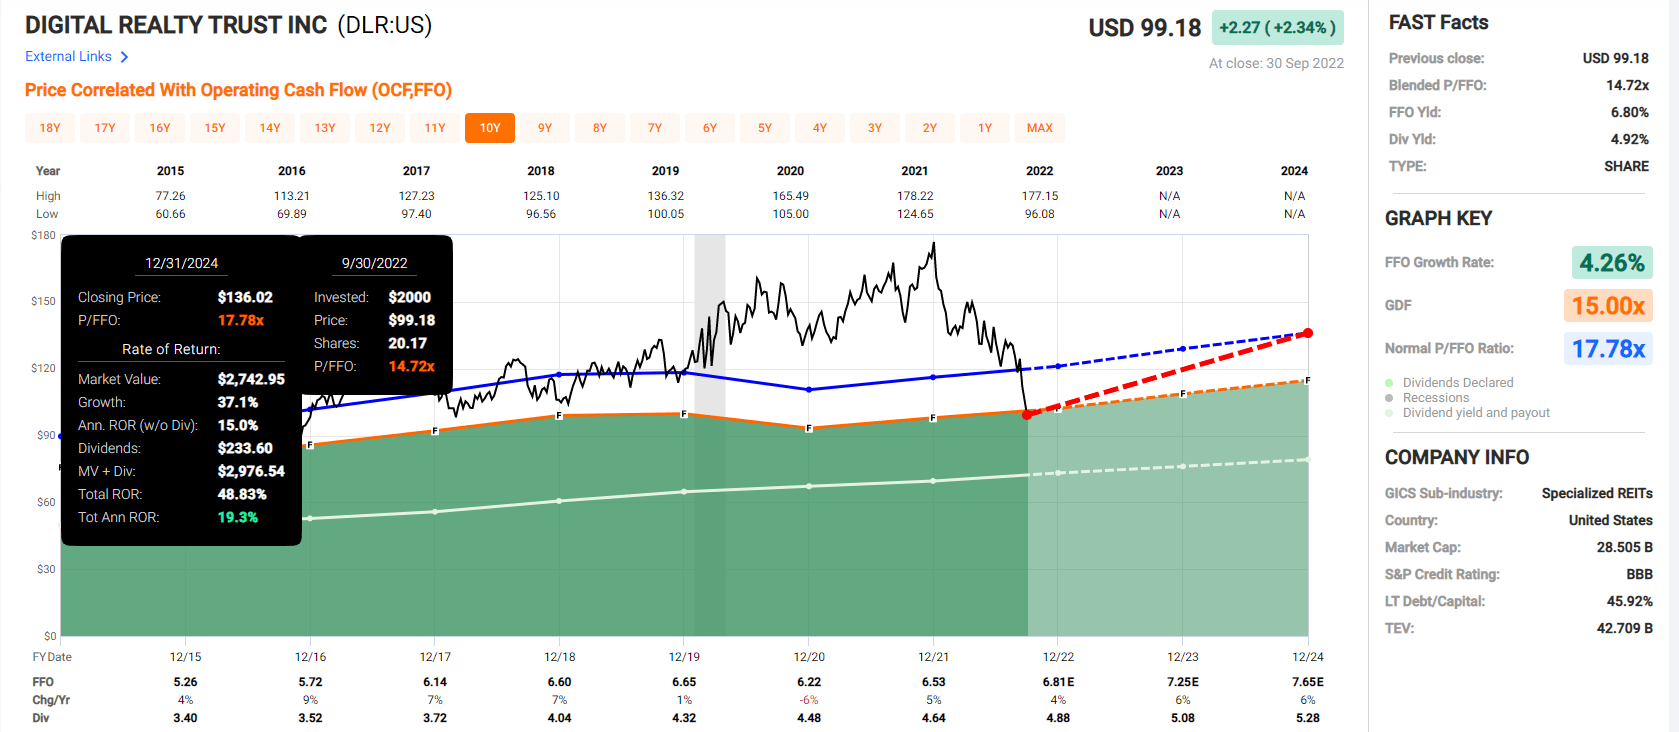
(Source: FAST Graphs, FactSet Research)
Enbridge 2024 Consensus Total Return Potential

(Source: FAST Graphs, FactSet Research)
Cisco 2024 Consensus Total Return Potential
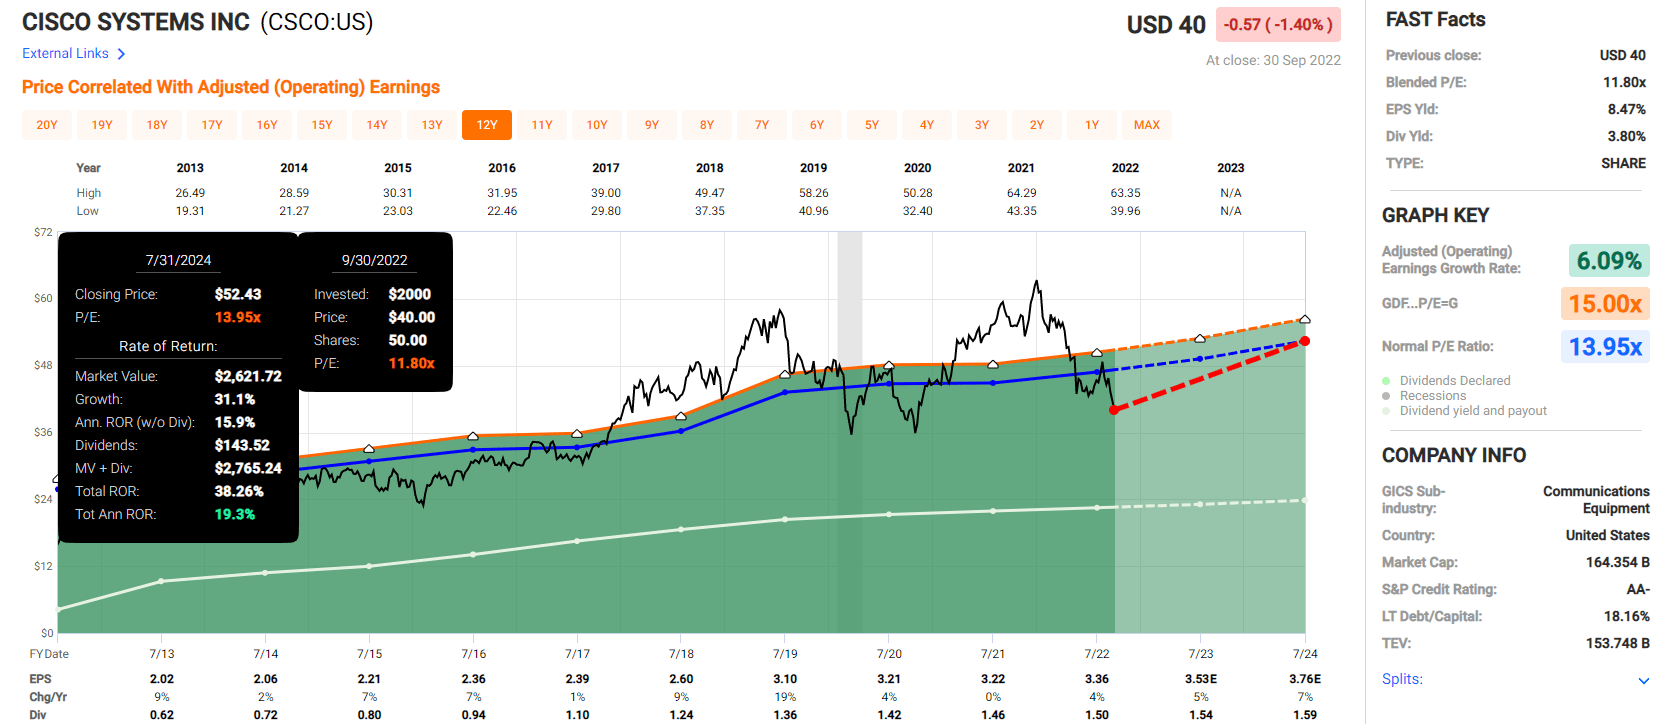
(Source: FAST Graphs, FactSet Research)
Allianz 2024 Consensus Total Return Potential (1.4 BV = 12.3 PE)
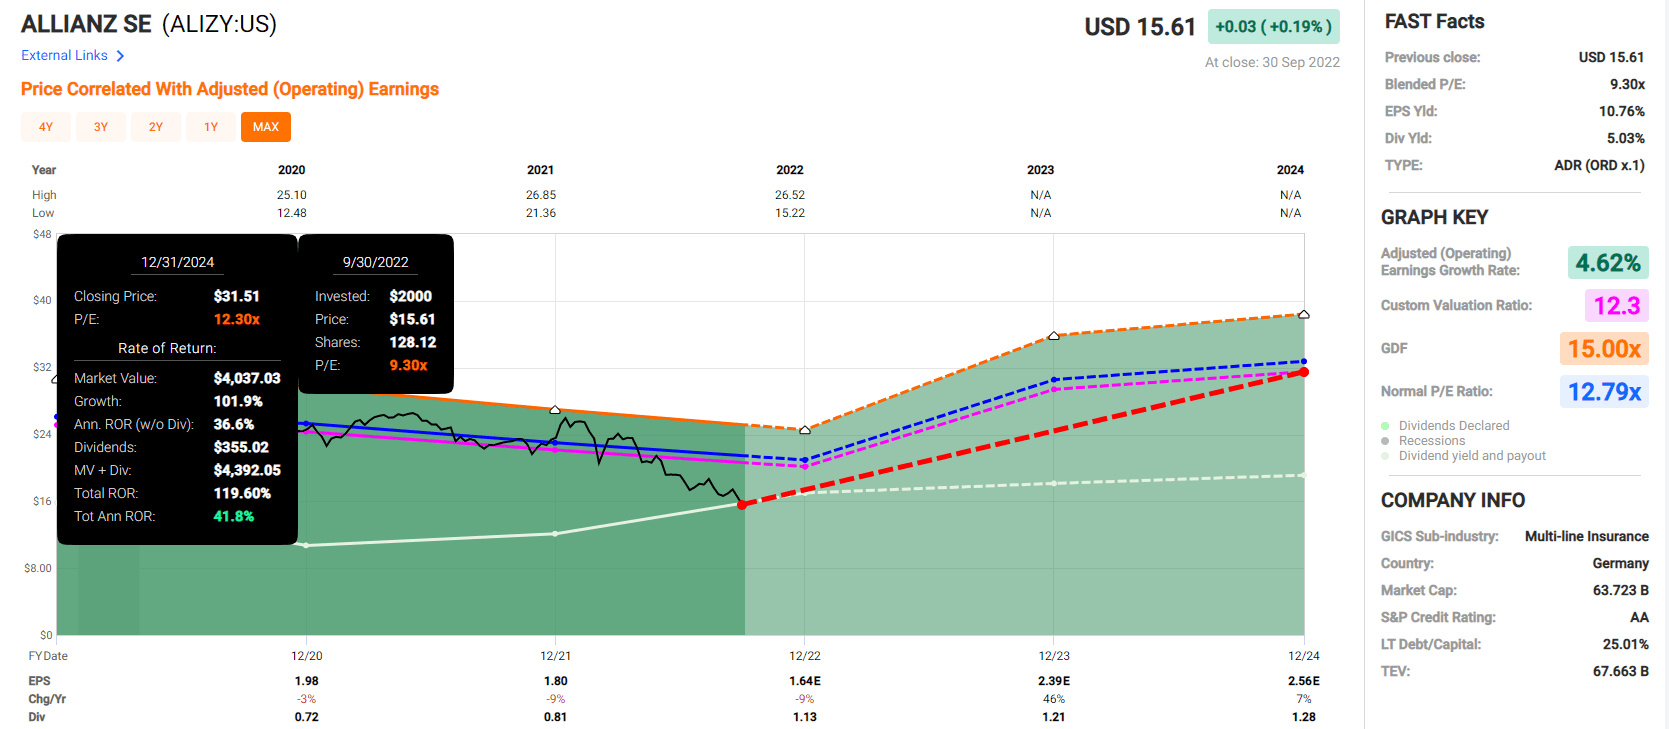
(Source: FAST Graphs, FactSet Research)
Now compare these return potentials to the 10% undervalued S&P 500.
S&P 500 2024 Consensus Total Return Potential
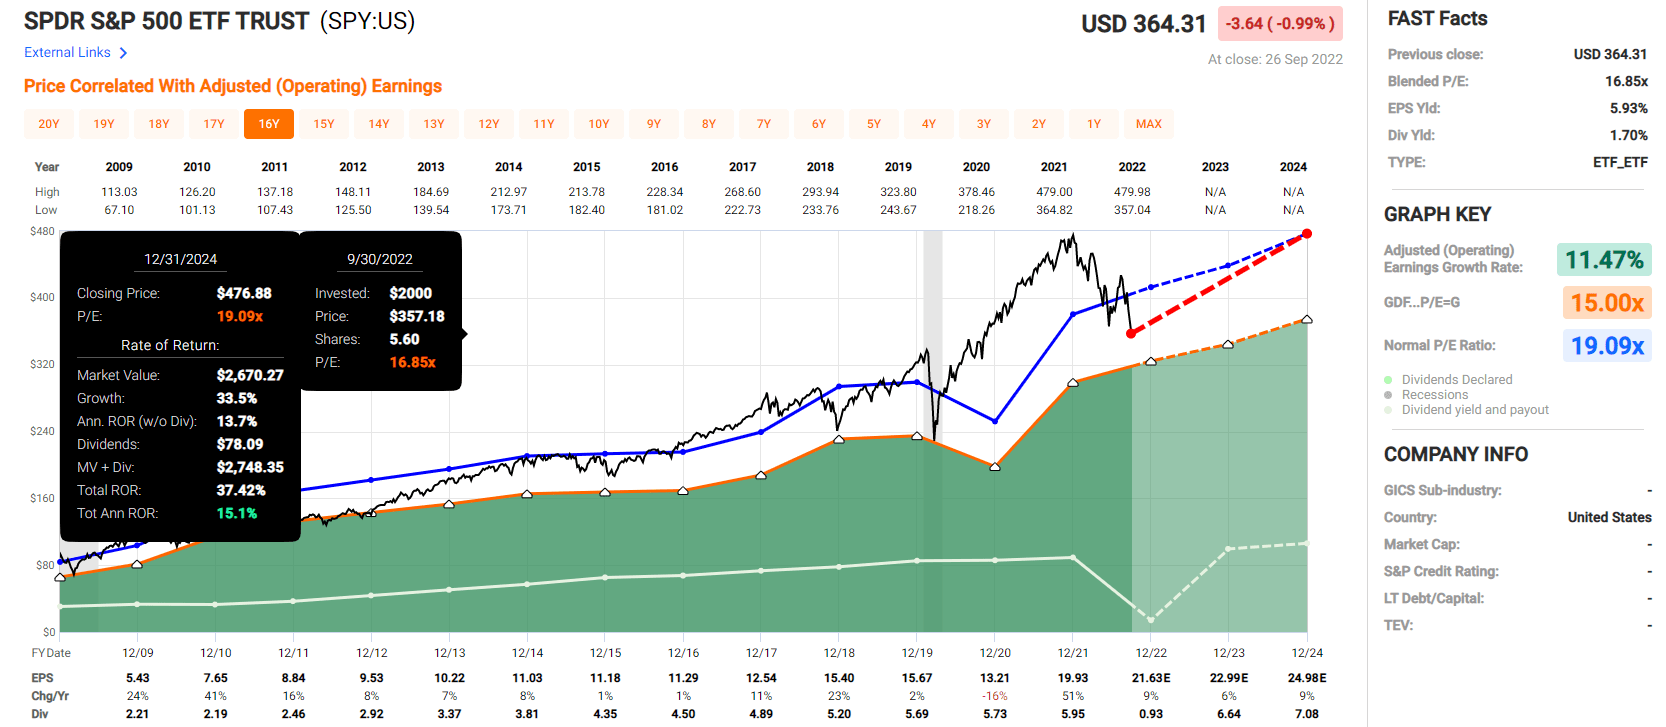
(Source: FAST Graphs, FactSet Research)
Analysts expect the S&P 500 might be able to deliver 15% annual returns through 2024, which is excellent.
But these five super dependable high-yield blue-chips offer 25% average annual return potential through 2024.
- 65% total return through 2024
- 2X that of the S&P 500
But my goal isn’t to help you achieve 2X the market’s returns through 2024.
It’s not to help you potentially nab Buffett-like returns from five of the world’s most dependable blue chips in the short term. I want to help you take charge of your financial destiny, sleep well at night in this bear market, and potentially retire in safety and splendor.
Five Of The World’s Most Dependable Blue Chips
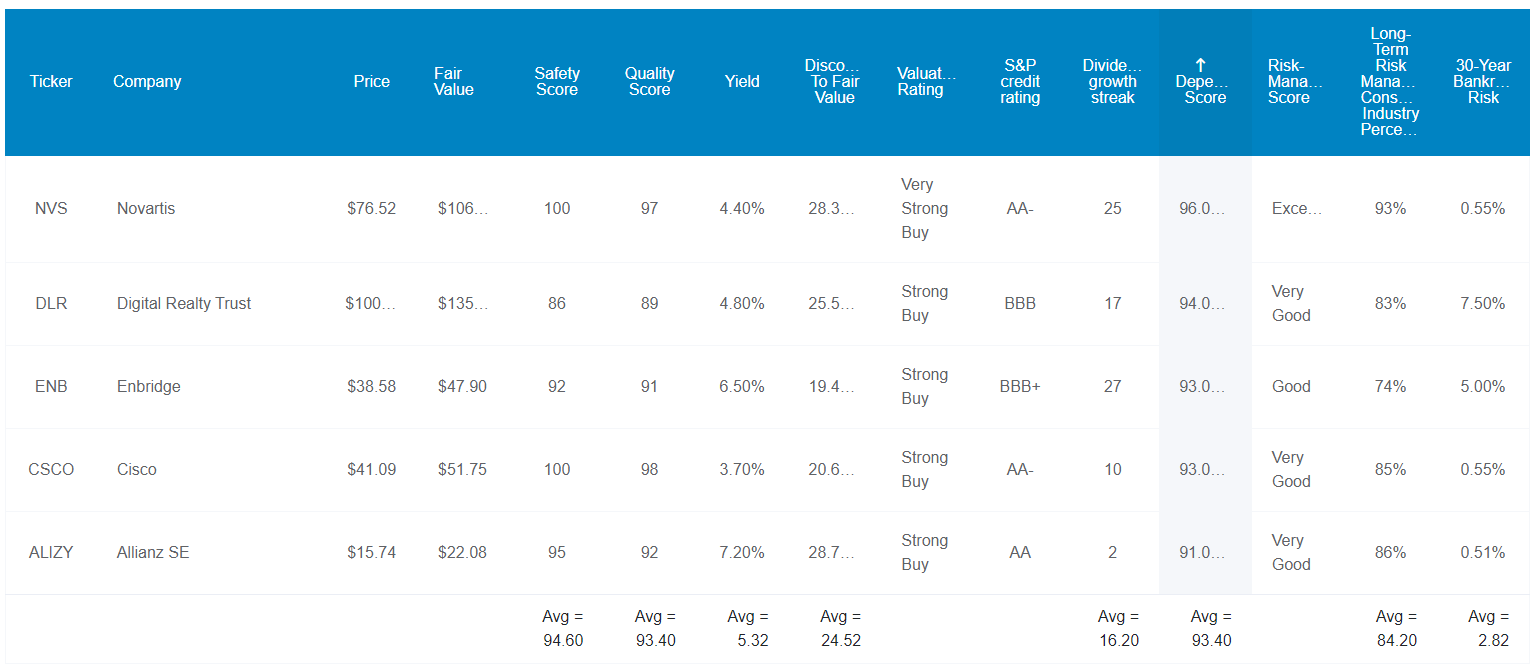
(Source: Dividend Kings Zen Research Terminal)
These aren’t just super dependable blue-chips. They average 12.6/13 Ultra SWAN (sleep well at night) quality that makes them perfect high-yield options for today’s crazy world.
How can we know this? By comparing their fundamentals to the dividend aristocrats, the bluest of blue-chips.
Quality And Dependability That Matches Or Surpasses The Dividend Aristocrats
| Metric | Dividend Aristocrats | 5 Super Dependable High-Yield Blue-Chips |
Compared To Aristocrats |
| Quality | 87% | 93% | 107% |
| Safety | 90% | 95% | 106% |
| Average Recession Dividend Cut Risk | 0.5% | 0.5% | 100% |
| Severe Recession Dividend Cut Risk | 1.50% | 1.25% | 83% |
| Dependability | 84% | 93% | 111% |
| Dividend Growth Streak (Years) | 44.8 | 16.2 | 36% |
| Long-Term Risk Management Industry Percentile | 67%, Above-Average, Low Risk | 84% Very Good, Very Low Risk | 125% |
| Average Credit Rating | A- Stable | A- Stable | NA |
| Average Bankruptcy Risk | 3.04% | 2.82% | 93% |
| Average Return On Capital | 105% | 634% | 604% |
| Average ROC Industry Percentile | 83% Wide Moat | 99% Very Wide Moat | 119% |
| 13-Year Median ROC | 89% | 230% | 258% |
| Forward PE | 18.3 | 9.8 | 54% |
| Discount To Fair Value | 10% | 25% | 250% |
| DK Rating | Good Buy | Very Strong Buy | NA |
| Yield | 2.8% | 5.3% | 191% |
| LT Growth Consensus | 8.7% | 6.5% | 75% |
| Total Return Potential | 11.5% | 11.8% | 103% |
| Risk-Adjusted Expected Return | 7.8% | 7.9% | 101% |
| Inflation & Risk-Adjusted Expected Return | 5.6% | 5.6% | 102% |
| Conservative Years To Double | 13.0 | 12.8 | 98% |
| Average | 143% |
(Source: Dividend Kings Zen Research Terminal)
These super dependable high-yield Ultra SWANs surpass the aristocrats in most fundamental safety metrics.
Their average severe dividend cut risk is 1.25% and their average fundamental bankruptcy risk is slightly less, just 2.8%.
Their return on capital or ROC is among the highest in the world.
- return on capital = annual operating profits/the cost of running the business
- Joel Greenblatt’s gold standard proxy for quality and moatiness
The S&P 500’s 2021 ROC was 14.6%, and the aristocrats 12 month ROC is 105%.
These super dependable Ultra SWANs have mind blowing 634% ROC, or more than 6X more than the aristocrats.
Their ROC is in the 99th industry percentile, not just wide moat, but very wide moat.
And their 13-year median ROC is 230%, more than 2X that of the aristocrats, and indicating their very wide moats are getting wider.
Seven risk-rating agencies estimate their long-term risk management is in the 84th industry percentile, very low risk companies with very good risk management.
- everything from moat preservation, to maintaining safe balance sheets over time, to supply chain management, to labor relations, and even adapting to climate change
These Super Dependable High-Yield Ultra SWAN’s Long-Term Risk Management Is The 34th Best In The Master List (93rd Percentile)
| Classification | Average Consensus LT Risk-Management Industry Percentile |
Risk-Management Rating |
| S&P Global (SPGI) #1 Risk Management In The Master List | 94 | Exceptional, Very Low Risk |
| 5 Super Dependable High-Yield Blue-Chips | 84 | Very Good Exceptional, Very Low Risk |
| Strong ESG Stocks | 73 |
Good, Low Risk |
| Foreign Dividend Stocks | 75 | Good, Low Risk |
| Ultra SWANs | 71 | Good, Low Risk |
| Low Volatility Stocks | 68 | Above-Average, Low Risk |
| Dividend Aristocrats | 67 | Above-Average, Low Risk |
| Dividend Kings | 63 | Above-Average, Low Risk |
| Master List average | 62 | Above-Average, Low Risk |
| Hyper-Growth stocks | 61 | Above-Average, Low Risk |
| Monthly Dividend Stocks | 60 | Above-Average, Low Risk |
| Dividend Champions | 57 | Above-Average, Medium Risk |
(Source: DK Research Terminal)
Their risk-management consensus is in the top 7% of the world’s highest quality companies and similar to that of such other blue-chips as
- Colgate-Palmolive (CL): Ultra SWAN dividend king
- Lockheed Martin (LMT): Ultra SWAN
- BlackRock (BLK): Ultra SWAN
- Ecolab (ECL): Super SWAN dividend aristocrat
- Microsoft (MSFT): Ultra SWAN
The bottom line is that all companies have risks, and these super dependable high-yield Ultra SWANs are very good at managing theirs.
How We Monitor Their Risk Profile
- 121 analysts
- 5 credit rating agencies
- 8 total risk rating agencies
- 129 experts who collectively know this business better than anyone other than management
- the bond market for real-time fundamental risk-assessment
When the facts change, I change my mind. What do you do, sir?” – John Maynard Keynes
There are no sacred cows at iREIT or Dividend Kings. Wherever the fundamentals lead, we always follow. That’s the essence of disciplined financial science, the math behind retiring rich and staying rich in retirement.
OK, so now that you see why these are such dependable Ultra SWANs, here’s why you might want to buy some or all of them today.
Wonderful Companies At Wonderful Prices
It’s far better to buy a wonderful company at a fair price, than a fair company at a wonderful price.” – Warren Buffett
If it’s good to buy wonderful companies at fair prices, then just imagine how great it is to buy wonderful companies at wonderful prices.
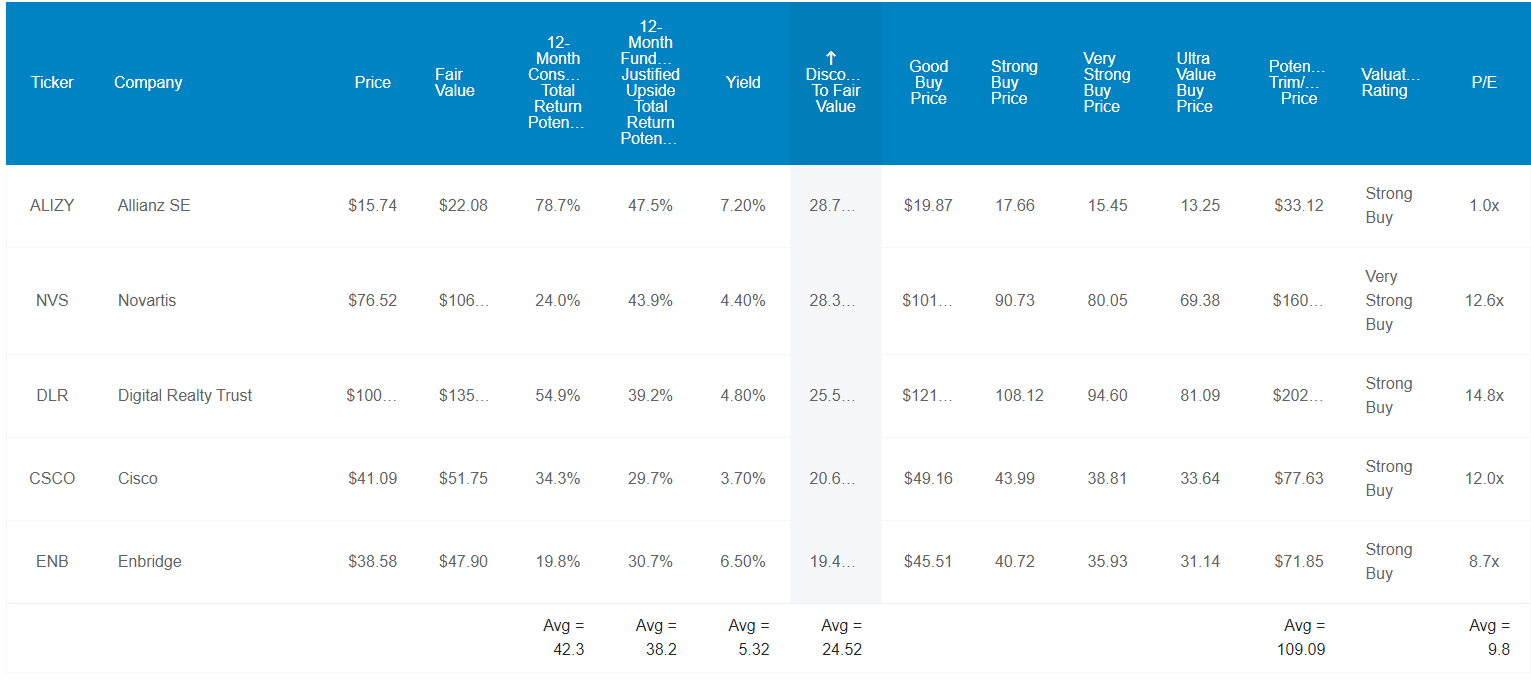
(Source: Dividend Kings Zen Research Terminal)
For context, the S&P 500 is 10% historically undervalued at 15.1X forward earnings, and the dividend aristocrats are also 10% undervalued at 18.3X forward earnings.
These super dependable high-yield blue-chips are 25% historically undervalued at 9.8X earnings.
- 11.6 PE was the low for the S&P 500 in 2009
The last time the S&P was 9.8X earnings was in the mid 1980s. Five of the world’s most dependable high-yield blue-chips are trading at a valuation the market hasn’t seen in almost 40 years and likely never will again.
That’s why analysts think they will deliver 42% total returns within a year, and 38% total returns within the next 12 months would be justified by fundamentals.
But my goal isn’t to help you potentially earn 38% or even 42% returns within a year. My goal is to help change your life with 30X returns over the next 30 years.
How These 5 Super Dependable High-Yield Blue Chips Can Help You Potentially Retire In Safety And Splendor

(Source: Dividend Kings Zen Research Terminal)
These super dependable Ultra SWANs not just offer one of the safest and most dependable 5.3% yields on earth, they are also growing at 6.5% and thus offer 11.8% CAGR long-term return potential.
| Investment Strategy | Yield | LT Consensus Growth | LT Consensus Total Return Potential | Long-Term Risk-Adjusted Expected Return | Long-Term Inflation And Risk-Adjusted Expected Returns | Years To Double Your Inflation & Risk-Adjusted Wealth |
10-Year Inflation And Risk-Adjusted Expected Return |
| Safe Midstream | 6.3% | 6.4% | 12.7% | 8.9% | 6.6% | 10.9 | 1.89 |
| 5 Super Dependable High-Yield Blue-Chips | 5.3% | 6.5% | 11.8% | 8.3% | 6.0% | 12.1 | 1.79 |
| REITs | 3.9% | 6.1% | 10.0% | 7.0% | 4.7% | 15.3 | 1.58 |
| Schwab US Dividend Equity ETF | 3.6% | 8.80% | 12.4% | 8.7% | 6.4% | 11.3 | 1.86 |
| Dividend Aristocrats | 2.8% | 8.7% | 11.5% | 8.1% | 5.8% | 12.5 | 1.75 |
| S&P 500 | 1.9% | 8.5% | 10.4% | 7.3% | 5.0% | 14.4 | 1.63 |
(Sources: DK Research Terminal, FactSet, Ycharts, Morningstar)
There are ways to earn a higher safe yield than 5.3%, but none that offer five sector diversification like we have here.
There are ways to potentially earn more than 12% long-term returns, but few offer a very safe and super dependable 5%-plus yield like Ultra SWANs do.
Inflation-Adjusted Consensus Total Return Potential: $1,000 Initial Investment
| Time Frame (Years) | 8.0% CAGR Inflation-Adjusted S&P 500 Consensus | 9.2% Inflation-Adjusted Dividend Aristocrats Consensus | 9.5% CAGR Inflation-Adjusted 5 Super Dependable High-Yield Blue-Chip Consensus | Difference Between Inflation-Adjusted 5 Super Dependable High-Yield Blue-Chip Consensus And S&P Consensus |
| 5 | $1,470.01 | $1,553.50 | $1,574.96 | $21.45 |
| 10 | $2,160.92 | $2,413.37 | $2,480.49 | $67.12 |
| 15 | $3,176.58 | $3,749.18 | $3,906.67 | $157.49 |
| 20 | $4,669.60 | $5,824.36 | $6,152.84 | $328.48 |
| 25 | $6,864.35 | $9,048.16 | $9,690.46 | $642.30 |
| 30 (retirement time frame) | $10,090.65 | $14,056.34 | $15,262.07 | $1,205.73 |
| 35 | $14,833.34 | $21,836.56 | $24,037.11 | $2,200.55 |
| 40 | $21,805.13 | $33,923.16 | $37,857.43 | $3,934.27 |
| 45 | $32,053.72 | $52,699.72 | $59,623.86 | $6,924.13 |
| 50 | $47,119.24 | $81,869.16 | $93,905.05 | $12,035.89 |
| 55 | $69,265.69 | $127,183.97 | $147,896.48 | $20,712.51 |
| 60 (investing lifetime) | $101,821.14 | $197,580.66 | $232,930.70 | $35,350.05 |
| 100 (institutional time frame, multi-generational wealth) | $2,220,223.05 | $6,702,560.00 | $8,818,158.41 | $2,115,598.41 |
(Source: DK Research Terminal, FactSet)
Over the next 30 years analysts believe these super dependable high-yield Ultra SWANs could potentially deliver 15X inflation-adjusted returns, and 233X over and investing lifetime.
| Time Frame (Years) | Ratio 5 Super Dependable High-Yield Blue-Chip Consensus/Aristocrat Consensus | Ratio Inflation And 5 Super Dependable High-Yield Blue-Chip Consensus vs. S&P consensus |
| 5 | 1.01 | 1.07 |
| 10 | 1.03 | 1.15 |
| 15 | 1.04 | 1.23 |
| 20 | 1.06 | 1.32 |
| 25 | 1.07 | 1.41 |
| 30 | 1.09 | 1.51 |
| 35 | 1.10 | 1.62 |
| 40 | 1.12 | 1.74 |
| 45 | 1.13 | 1.86 |
| 50 | 1.15 | 1.99 |
| 55 | 1.16 | 2.14 |
| 60 | 1.18 | 2.29 |
| 100 | 1.32 | 3.97 |
(Source: DK Research Terminal, FactSet)
That’s much higher and more dependable yield today and potentially significantly higher inflation-adjusted wealth over the coming decades.
OK, so all this sounds amazing, but what evidence is there that these super dependable high-yield blue-chips can deliver anything close to 12% long-term returns?
Historical Returns Since November 2004 (Equal Weighting, Annual Rebalancing)
The future doesn’t repeat, but it often rhymes. – Mark Twain
In our case, “past performance is no guarantee of future results.”
Still, studies show that blue chips with relatively stable fundamentals offer predictable returns based on yield, growth, and valuation mean reversion over time.
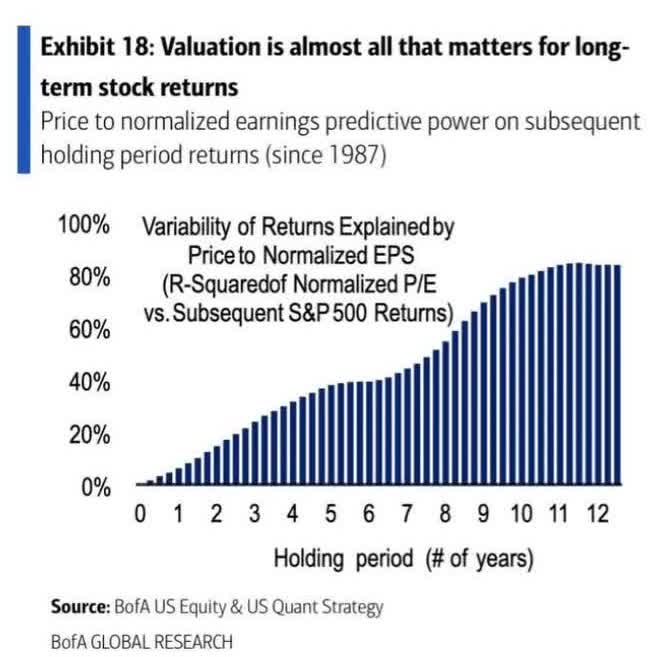
Bank of America
So let’s see how these super dependable high-yield Ultra SWANs have performed over the last 18 years, when 90% of results were the result of fundamentals, not luck.
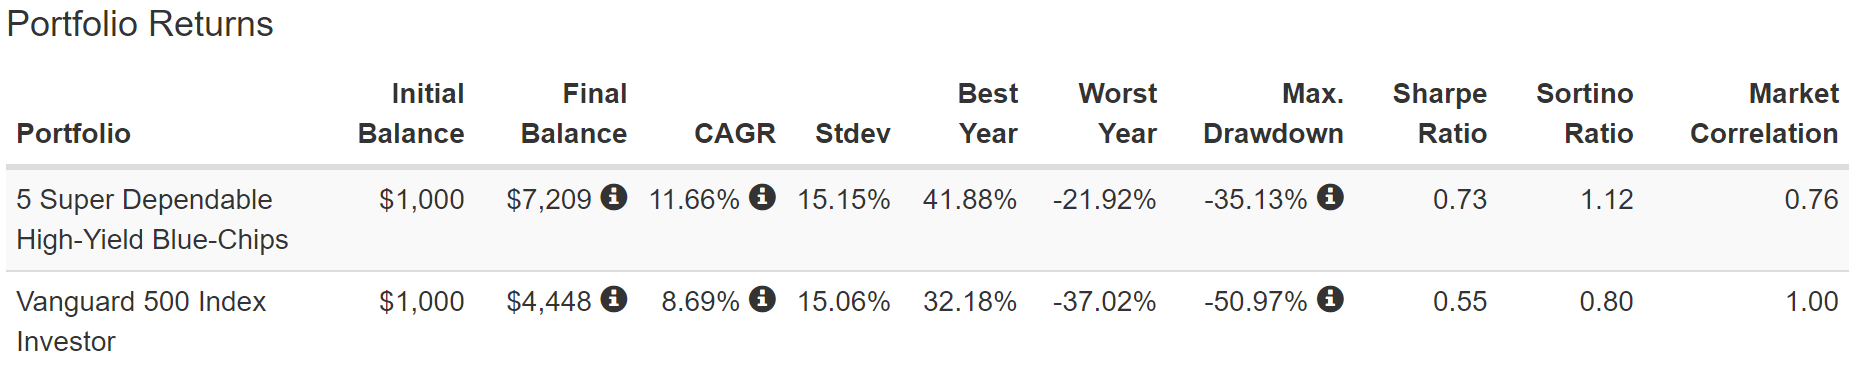
(Source: Portfolio Visualizer Premium)
Five super dependable high-yield Ultra SWANs that analysts think can deliver 11.8% long-term returns, identical to the returns of the last two decades.
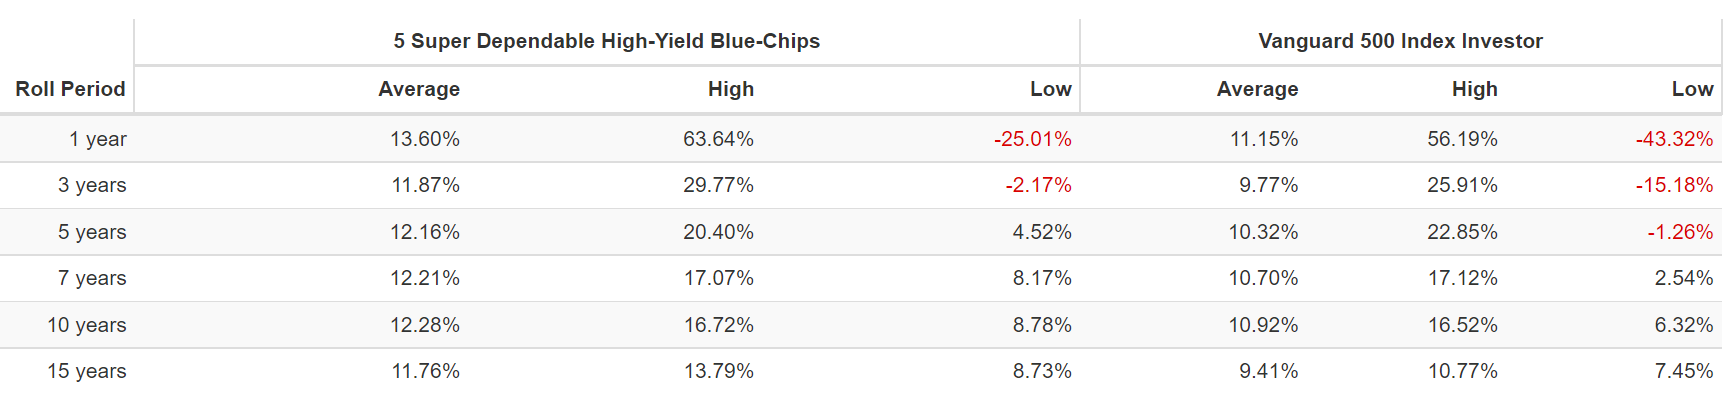
(Source: Portfolio Visualizer Premium)
Very consistent 12%, market-beating returns over two decades, just as analysts expect in the future from these mature super dependable blue-chips.
Two decades in which their annual volatility was equal to the market’s despite being 100X fewer companies.
- a 35% peak decline in the Great Recession
- better than the 60/40’s -44% drop in the GFC
- 40% better annual negative-volatility-adjusted total returns

(Source: Portfolio Visualizer Premium)
During the Pandemic, they fell half as much as the market.
But remember that the goal here is super dependable, high-yield blue-chips, so how did they deliver on dividend growth across almost two decades of recessions and bear markets?
Income You Can Depend On In Crazy Market Times

Per $1,000 Initial Investment, in USD ((Source: Portfolio Visualizer Premium))
Despite dividends paid in four currencies, this basket of super dependable high-yield blue-chips delivered steady income growth in almost every economic, market, and global event environment.
Cumulative Dividends Since 2005: $1,000 Initial Investment
| Metric | S&P 500 | 5 Super Dependable High-Yield Blue-Chips |
| Total Dividends | $781 | $2,714 |
| Total Inflation-Adjusted Dividends | $503.87 | $1,750.97 |
| Annualized Income Growth Rate | 8.2% | 16.2% |
| Total Income/Initial Investment % | 0.78 | 2.71 |
| Inflation-Adjusted Income/Initial Investment % | 0.50 | 1.75 |
| More Inflation-Adjusted Income Than Altria | NA | 3.48 |
| Starting Yield | 2.0% | 3.1% |
| Today’s Annual Dividend Return On Your Starting Investment (Yield On Cost) | 7.6% | 39.9% |
| 2022 Inflation-Adjusted Annual Dividend Return On Your Starting Investment (Inflation-Adjusted Yield On Cost) | 4.9% | 25.7% |
(Source: Portfolio Visualizer Premium)
Thanks to much higher yields to compounding reinvested dividends, these 12% growing blue-chips delivered 16% annual income growth, 2X faster than the S&P 500.
They paid 3.5X more inflation-adjusted dividends than the market and turned a 3.1% yield in 2005 into a 26% inflation-adjusted yield on cost in 2022.
This is the power of super dependable high-yield blue-chips to help you retire in safety and splendor.
Bottom Line: Here Are Five Perfect High-Yield Blue Chips For These Crazy Times
I understand that the world seems crazy today, and parts of it are. I understand that any strategy that doesn’t involve going all to cash and hiding until the “just settles” and uncertainty fades, might seem like madness.
But history is very clear on this fact. Time in the market will make you rich, and timing the market will leave your finances in the ditch.
This is where super dependable Ultra SWAN high-yield world-beater blue-chip bargains like NVS, DLR, ENB, CSCO, and ALIZY can help.
- 5.3% very safe yield
- average A- stable credit rating (2.8% 30-year bankruptcy risk)
- 84th industry percentile risk management (very low risk, very good risk management)
- average dividend growth streak 16 years (since 2006, through 2 economic catastrophes)
- 6.5% CAGR long-term growth consensus
- 11.8% CAGR long-term return potential (same as the last 18 years)
- 16% CAGR annual income growth since 2005
- low volatility in periods of market panic (half the declines of the S&P during the Pandemic and a smaller decline in the Great Recession than a 60/40)
Blue chips like these can help you safely pays the bills today, while compounding your wealth at double-digits over decades.
Blue chips like these can help you achieve true financial freedom by living off very generous and dependable growing income in all economic conditions.
- including the most extreme recessions in the last 75 years
If you’re tired of worrying about inflation, the Fed, interest rates, Russia, China, and what next crazy thing could spring from fate’s jack in the box, maybe it’s time to stop gambling and start investing for your future.
Maybe it’s time to stop obsessing over the market’s short-term gyrations and focus on what can actually help you retire rich and stay rich in retirement; cold, hard cash.
When you entrust your hard-earned savings to the world’s most dependable high-yield world-beater blue chips like these, you never have to pray for luck.
Because over years and decades, you’ll make your own.
And that, my friends, is the true secret to sleeping well at night and retiring in safety and splendor.
Be the first to comment