


Justin Sullivan
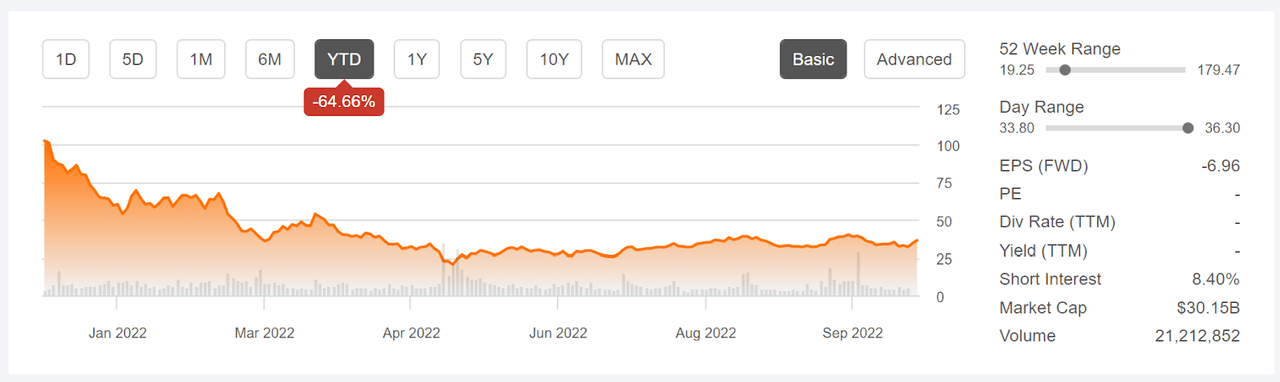
Shares of electric vehicle maker Rivian (NASDAQ:RIVN) rose 13.8% on Oct. 4 in response to solid Q3 production numbers and affirmed full-year guidance for 25,000 vehicles to be delivered in 2022. Even with today’s gain, the shares are down 64.7% for the YTD and down 79% from the post-IPO peak closing price of $172 on Nov. 16, 2021, (RIVN’s IPO was on Nov. 9, 2021). Rivian’s IPO was well timed to take advantage of growing enthusiasm for EVs, but the company has faced an increasingly challenging economic environment in 2022. Rapid gains in interest rates and rising geopolitical uncertainty have crushed prices of growth stocks like RIVN, as investors have rotated from growth to value.
Seeking Alpha
Price history for the YTD and basic statistics for RIVN (Source: Seeking Alpha)
Especially for companies that are not yet profitable, valuations of growth stocks are sensitive to rising rates. The valuation for a stock is determined by estimating the discounted value of future earnings. When the earnings occur further into the future, the compounding effects of rising discount rates (as a result of rising interest rates) disproportionately reduce the net present value of the forecasted earnings. On the positive side, market enthusiasm for a shift to electrification, and for EV’s in particular, have helped to mitigate investors’ flight to value.
ETrade.com
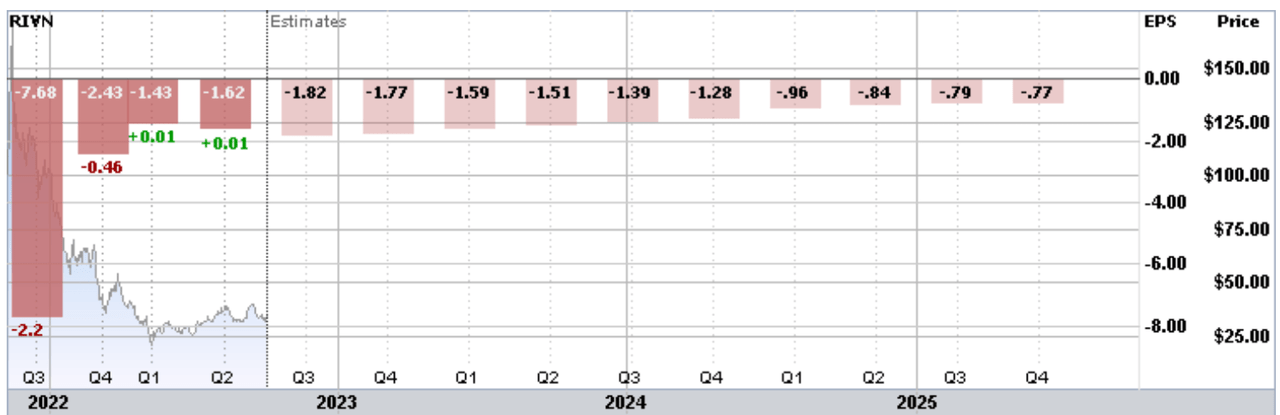
Historical and estimated future quarterly EPS for RIVN. Green (red) values are the amounts by which quarterly EPS beat (missed) the consensus expected value (Source: ETrade)
RIVN has demonstrated an impressive earnings growth trajectory since the company went public, although the projected earnings indicate that the company will remain unprofitable for the next several years. This is not, in itself, a problem. Given the massive capital investment required to manufacture cars at scale, a long runway to positive earnings is expected. The earnings outlook reinforces the high sensitivity that RIVN’s valuation will have to earnings that are anticipated to be realized years into the future. Higher interest rates make it hard for RIVN’s valuation to recover.
Given where RIVN is in its growth cycle, current fundamentals are far less relevant in evaluating the shares than outlooks. In analyzing RIVN, I’m relying on two forms of consensus outlooks. The first is the well-known Wall Street analyst outlook. The second is the market-implied outlook, a probabilistic price forecast calculated by analyzing the prices of call and put options on a stock. The market-implied outlook represents the consensus view among buyers and seller of options.
For readers who are unfamiliar with the market-implied outlook, a brief explanation is needed. The price of an option on a stock is largely determined by the market’s consensus estimate of the probability that the stock price will rise above (call option) or fall below (put option) a specific level (the option strike price) between now and when the option expires. By analyzing the prices of call and put options at a range of strike prices, all with the same expiration date, it’s possible to calculate a probabilistic price forecast that reconciles the options prices. This is the market-implied outlook. For a deeper explanation and background, I recommend this monograph published by the CFA Institute.
I have calculated the market-implied outlook for RIVN to early- and mid-2023 and I have compared these with the current Wall Street consensus outlook in assigning an overall rating.
Wall Street Consensus Outlook for RIVN
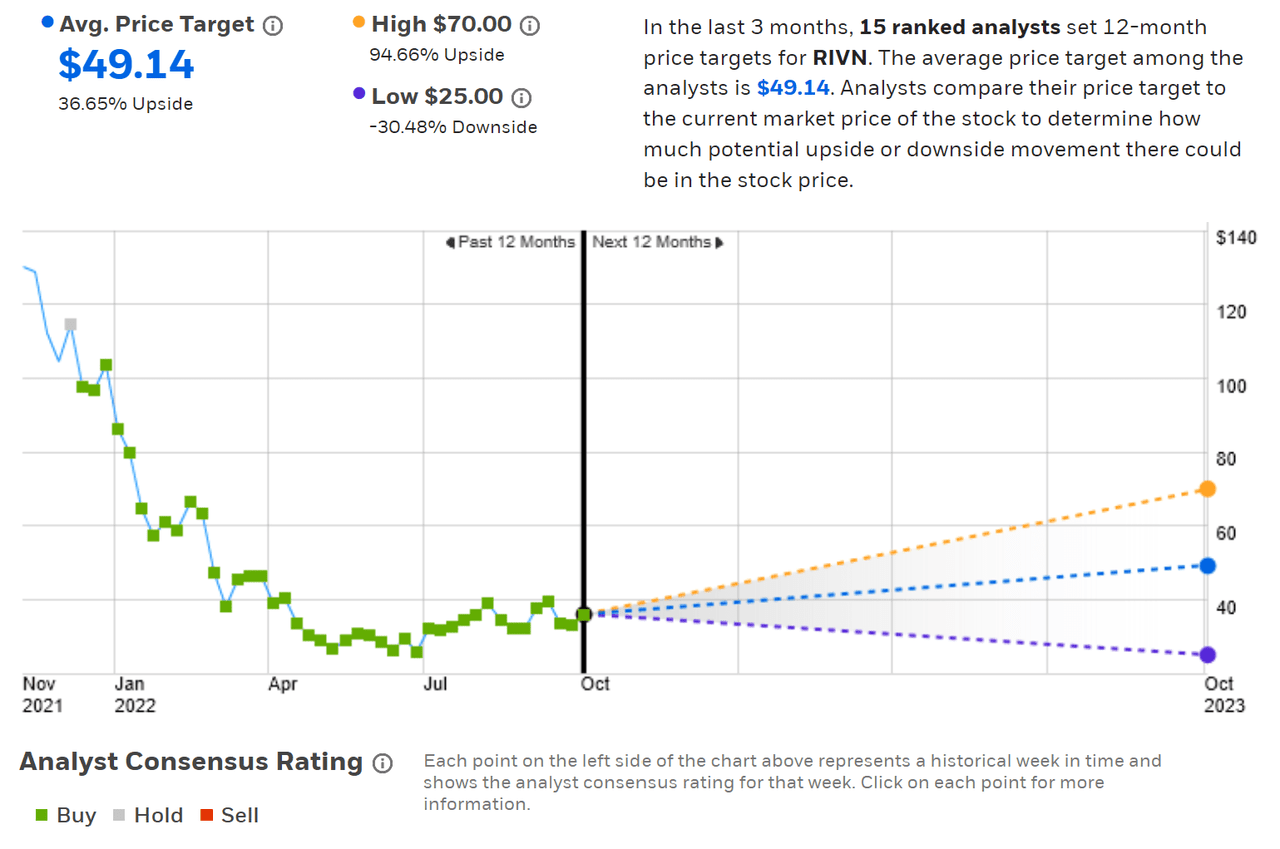
ETrade calculates the Wall Street consensus outlook using price targets and ratings published by 15 ranked analysts over the past three months. The consensus rating is a buy and the consensus 12-month price target is 36.7% above the current share price. There are a couple of concerns with the Wall Street consensus, however. First, the consensus rating has been a buy going all the way back to when the shares were over $100 in December of 2021. On Dec. 24, 2021, there were 14 ranked analysts contributing to the consensus rating. Of this number, 10 assigned a buy rating and four assigned a hold rating. The analysts have been over-optimistic on RIVN’s near-term prospects. The second concern is the high level of dispersion among the individual analyst price targets. The consensus price target tends to have predictive value, except when the spread among the individual price targets is high. When the dispersion is very high, the price appreciation implied by the consensus price target is actually negatively correlated to future returns (see previous link). As a rule of thumb, I strongly discount the consensus price target when the highest analyst price target is more than twice the lowest. In this case, the difference is 2.8 times the lowest.
ETrade
Wall Street consensus rating and 12-month price target for RIVN (Source: ETrade)
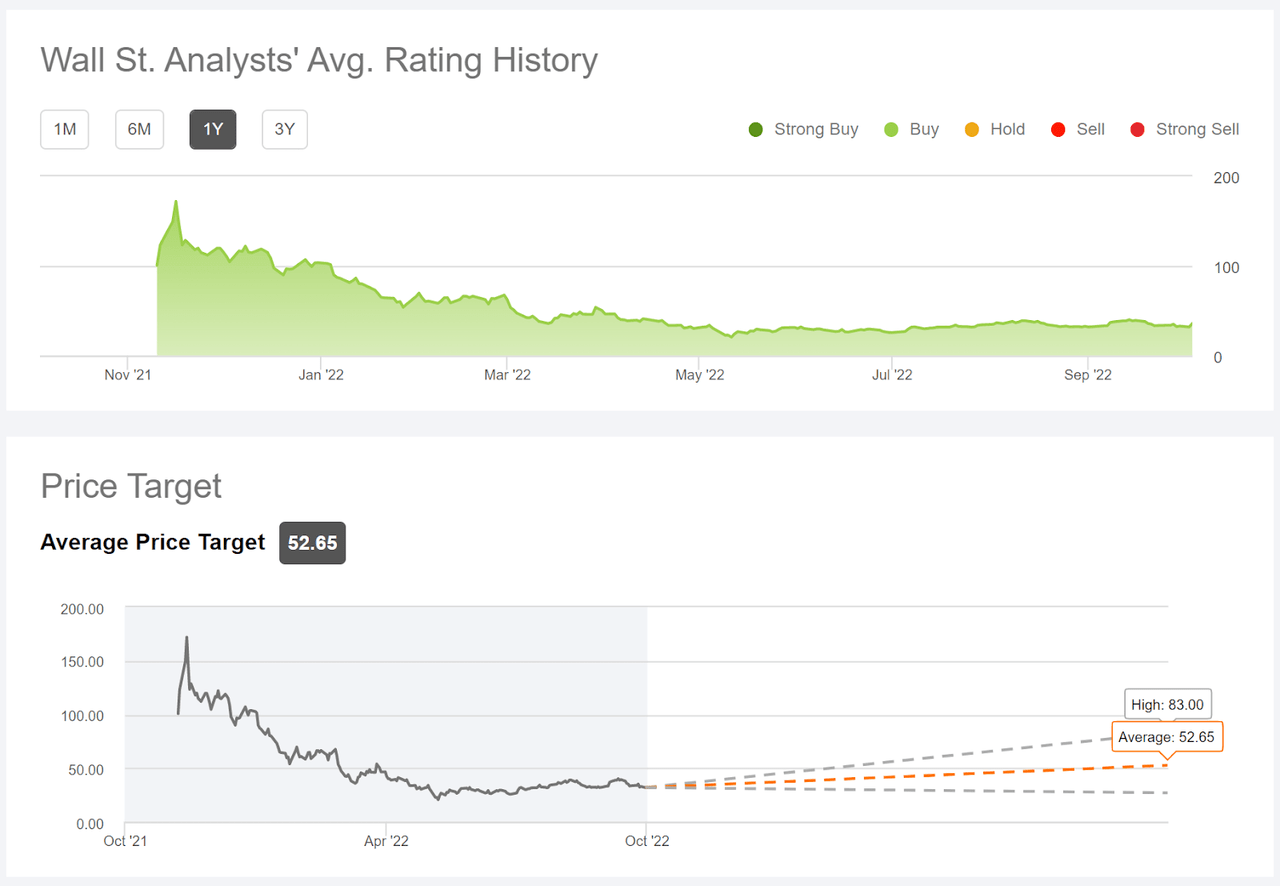
Seeking Alpha’s version of the Wall Street consensus outlook is calculated by aggregating the views of 19 analysts who have published price targets and ratings for RIVN over the past 90 days. The consensus rating has been a buy ever since RIVN went public and the consensus 12-month price target is 46.4% above the current share price.
Seeking Alpha
Wall Street consensus rating and 12-month price target for RIVN (Source: Seeking Alpha)
At first glance, the Wall Street consensus outlook appears to provide considerable reason for optimism in RIVN’s trajectory over the next year. Given the shares’ very high valuation shortly after the IPO, the consistent buy rating suggests that analysts have tended to underestimate the potential challenges facing Rivian. The high spread among the individual price targets is also a reason for concern and reduces my confidence in using the consensus price target as a guide.
Market-Implied Outlook for Rivian Stock
I have calculated the market-implied outlook for RIVN for the 3.5-month period from now until January 20, 2023 and for the 8.3-month period from now until June 16, 2023, using the prices of call and put options that expire on these dates. I selected these two dates to provide a view to the start and middle of 2023, as well as because the options expiring in January and June tend to be among the most liquid.
The standard presentation of the market-implied outlook is a probability distribution of price return, with probability on the vertical axis and return on the horizontal.
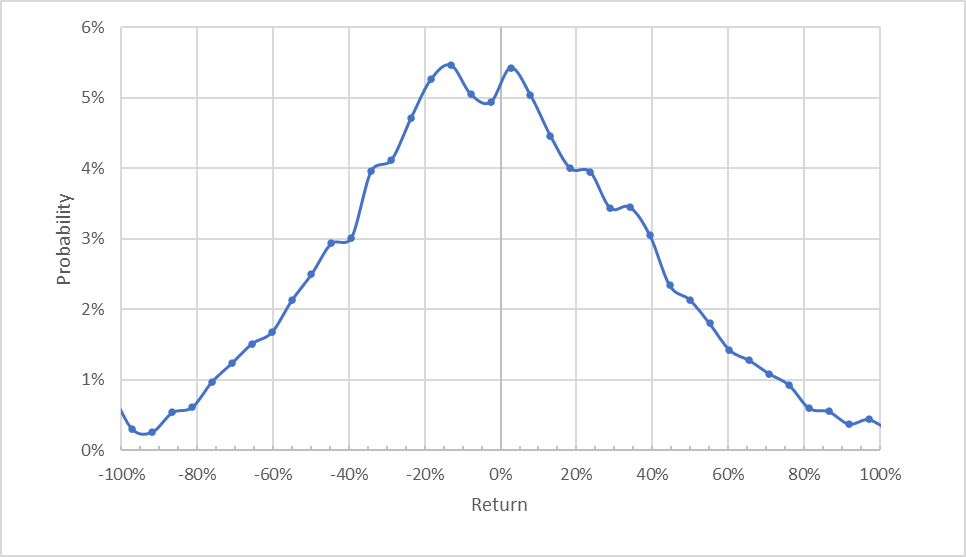
Geoff Considine
Market-implied price return probabilities for RIVN for the 3.5-month period from now until January 20, 2023 (Source: Author’s calculations using options quotes from ETrade)
The market-implied outlook for the next 3.5 months is slightly bimodal, with two peaks in probability. The peak in probability on the negative return side of the distribution occurs at a return of -13.2% while the positive peak occurs at a return of +2.6%. The really notable feature of this distribution is the 82% expected volatility (annualized). For comparison, ETrade calculates the option implied volatility for the January 2023 options to be 79%. This is a very high level of uncertainty in the possible future outcomes. The estimated 20th percentile outcome from this outlook is -35%. This means that the worst 1-in-5 outcomes will have returns of -35% or worse for the period from now until January 20, 2023. The 80th percentile return (the best 1-in-5 outcomes) is +34%.
To make it easier to compare the relative probabilities of positive and negative returns, I rotate the negative return side of the distribution about the vertical axis (see chart below).
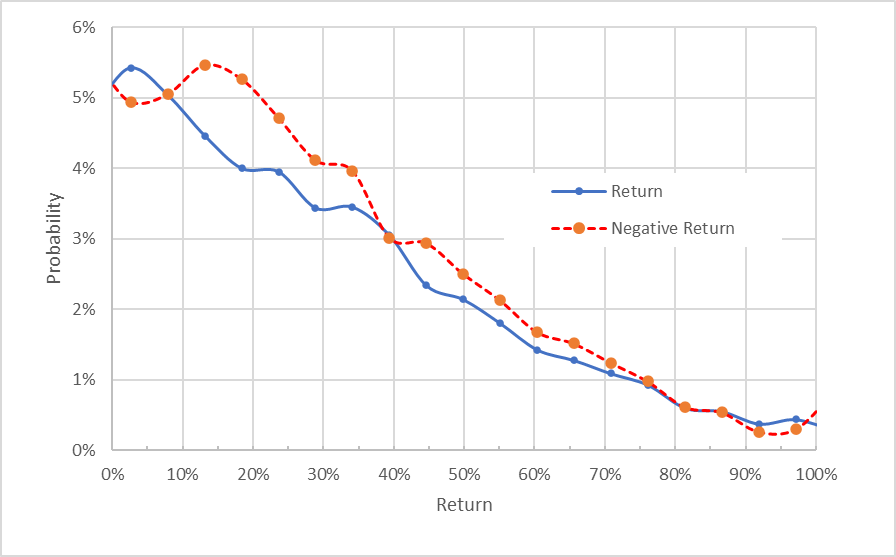
Geoff Considine
Market-implied price return probabilities for RIVN for the 3.5-month period from now until January 20, 2023. The negative return side of the distribution has been rotated about the vertical axis (Source: Author’s calculations using options quotes from ETrade)
This view shows the aggregate tilt in the market-implied outlook to favor negative returns over the next 3.5 months. The probabilities of negative returns are higher than those for positive returns of the same size across a wide range of probabilities (the dashed red line is above the solid blue line over almost all of the chart above).
Theory indicates that the market-implied outlook is expected to have a negative bias because investors, in aggregate, are risk averse and thus tend to pay more than fair value for downside protection. There’s no way to measure the magnitude of this bias, or whether it is even present, however. The expectation of a negative bias tempers the apparent bearish tilt in the probabilities, so I interpret this market-implied outlook as slightly bearish.
The market-implied outlook for the 8.3-month period from now until June 16, 2023, has a more pronounced bearish orientation. The peak in probability corresponds to a price return of -26% and the spread between the probabilities of negative and positive returns is considerably more pronounced (the dashed red line is further above the solid blue line) than for the shorter-term outlook. Even understanding the potential for a negative bias in the market-implied outlook, I interpret this outlook as bearish. The expected volatility calculated from this distribution is 82% (annualized), consistent with the outlook to January of 2023.
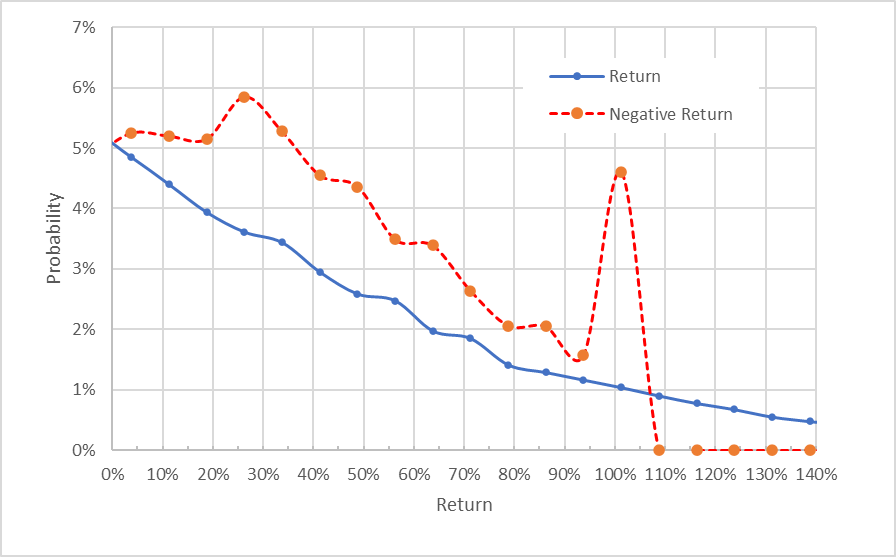
Geoff Considine
Market-implied price return probabilities for RIVN for the 8.3-month period from now until June 16, 2023. The negative return side of the distribution has been rotated about the vertical axis (Source: Author’s calculations using options quotes from ETrade)
The secondary peak in probability corresponding to a return of -100% reflects the estimated probability that RIVN will be in default by the middle of next year. Using the market-implied outlook’s estimates of the probabilities of these types of extreme outcomes is not appropriate however (a topic that is discussed in the CFA monograph linked in an earlier section). Trying to estimate the probabilities of extreme events using options prices is problematic because (1) the sensitivity to the market’s unknown risk aversion is amplified, (2) the volume of options trading for these extreme events is very limited, and (3) estimating the extreme tails of any distribution of real-life events (hurricanes, floods, extreme market swings) is innately problematic because of the high estimation risk due to having so little data on these events. That said, there’s a relationship between option implied volatility and the prices of credit default swaps, so the option-implied information has some value. I do not have any confidence that the estimated default risk from the market-implied outlook is meaningful beyond the fact that RIVN has extremely high implied volatility that reflects the uncertainties for the stock.
Summary
RIVN went public in late 2021 to considerable enthusiasm and the share price rose substantially above the IPO price. So far in 2022, the shares have declined almost 65% largely due to a substantial shift in the market’s enthusiasm for innovative, high-risk companies. The Wall Street analyst consensus rating on RIVN is a buy, but it also was a buy when the shares were trading above $100. One might reasonably conclude that the prevailing enthusiasm for RIVN has been overdone. The consensus 12-month price target for RIVN implies a gain of 41.5% over the next year (averaging the consensus price targets from ETrade and Seeking Alpha). The very high dispersion in the individual price targets suggests that the consensus is probably of little predictive value. In fact, the high dispersion and high implied return from the consensus may actually be a bearish indicator. As a rule of thumb for a buy rating, I want to see an expected 12-month return that is at least ½ the expected annualized volatility. Even taking the consensus price target at face value (which I would not do), RIVN barely meets this threshold (expected return of 41.5% on projected volatility of 82%). The market-implied outlook for RIVN is slightly bearish to January of 2023 and solidly bearish to June of 2023. I will note, however, that the market-implied outlook for TSLA has been bearish over the last year, and that has not turned out very well. In light of the huge uncertainties (80%-plus expected volatility), the high dispersion in the analyst outlooks (which suggest that there is little or not predictive value from the consensus) and the bearish market-implied outlooks (albeit with low confidence), I default to a hold / neutral rating. I would not want to buy RIVN but I would not short it because of the massive expected volatility / uncertainty.
Be the first to comment