

hapabapa/iStock Editorial via Getty Images
The SPDR Russell 1000 Yield Focus ETF (NYSEARCA:ONEY) favors mostly large-cap U.S. equities with robust quality and higher dividend yields.
ONEY has a fairly competitive expense ratio of 20 bps, with assets under management amassed since its inception on 2 December 2015 being north of $910 million, a solid level.
The previous time I covered this investment vehicle was on 3 June 2021 when I opted for a Buy rating, with one of the reasons for optimism being its substantial exposure to cyclicals which boded well for its performance amid the reopening-related economic rebound.
Since then, it has delivered a total return of about 4.6% while the S&P 500 has declined by almost 5% dragged down by the rotation out of pricier stocks amid the painful inflation and higher interest rates issue.
Seeking Alpha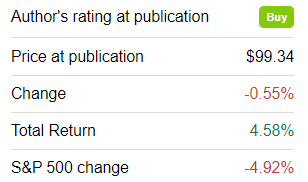
Essentially, this value- and quality-heavy ETF not only managed to benefit from the capital rotation in 2021 (an outstanding 36% total return) but also outmaneuvered the bearish forces raging on the Street last year with ease. For better context, while the iShares Core S&P 500 ETF (IVV) dropped by 18.2%, ONEY was down by only 3.6%, with a much lower max drawdown and only a slightly higher standard deviation. It also beat the iShares Russell 1000 ETF (IWB).
| Portfolio | ONEY | IVV | IWB |
| Initial Balance | $10,000 | $10,000 | $10,000 |
| Final Balance | $9,638 | $8,184 | $8,081 |
| CAGR | -3.62% | -18.16% | -19.19% |
| Stdev | 23.28% | 23.13% | 22.86% |
| Max. Drawdown | -16.41% | -23.93% | -24.57% |
| Sharpe Ratio | -0.13 | -0.83 | -0.9 |
| Sortino Ratio | -0.19 | -1.06 | -1.13 |
| Market Correlation | 0.94 | 1 | 1 |
Created by the author using data from Portfolio Visualizer. The period in focus is 1 January 2022 – 31 December 2022
At this juncture, though the fund is not completely flawless (there is hardly one in the entire ETF universe), I maintain the Buy rating due to the reasons detailed in the article.
Investment strategy recap
The Russell 1000 Yield Focused Factor Index forms the basis of ONEY’s investment strategy. The three core factors assessed are value, quality, and small size, with yield being the focus factor. The Russell 1000 constituents with inadequate characteristics reviewed during a proprietary multi-step process are filtered out.
At the moment, ONEY has a portfolio of 297 holdings vs. 282 as of the previous article. The cohort of the key ten has a modest weight, 14.2%, supporting the point that the fund is nicely diversified.
Since 3 June 2021 when I dissected the ETF for the first time, the portfolio has been recalibrated a few times already; stocks present in the early June 2021 version now account for around 66% of the net assets.
The most notable positions that were deleted are Ford (F), an automotive heavyweight that barely needs a wordy introduction, which accounted for 2.4%, and General Motors (GM), another household name, previously with 1.4% weight. The largest additions worth touching upon are Gilead Sciences (GILD) and T. Rowe Price (TROW), with 1.7% and 1.4%, respectively.
Sectors the fund favors are financials with a weight of almost 17%, consumer discretionary (16.4%), and industrials (13.2%). Exposure to healthcare (5.5%) and utilities (68 bps) is minimal.
Why is it worth considering ONEY at this point?
ONEY is attractively valued
I am of the opinion that mixing value with quality in an equity portfolio could secure meaningful returns and suppress volatility a bit, regardless of how quickly the Fed will return to accommodative monetary policy to buttress the economy and stave off a recession. Did ONEY succeed in building a value-centered portfolio? It obviously did.
Its weighted-average market capitalization is about $21.4 billion, as of my calculations, vs. around $22.6 billion previously. For better context, GILD is the only mega-cap in the mix, while about 29.2% of the holdings are mid- and small-caps. It is intuitively evident that this portfolio should exhibit attractive valuation characteristics, partly as a consequence of the size factor. And in reality, it does. For instance, I found out that the weighted-average earnings yield is 8.3%, which translates into an LTM P/E ratio of only 12x. One of the justifications for such a modest multiple is the WA forward earnings per share growth rate of 12.9%, which is fairly bleak as more than a fifth of holdings is forecast to face profit contraction in the medium term.
Also, amongst the key contributors to such a high EY are principally basic materials and financial players; e.g., amongst stocks with an over 10% EY are 11 basic materials names including refiners and chemicals manufacturers (6.4% weight in the entire portfolio) and 23 banks, asset managers, and the like (5.5% weight). Investors who would opt for an S&P 500-tracking fund would get an EY of just around 5%. It is also of note that ONEY comes with a modest WA Price/Sales of 2.1x; meanwhile, IVV had ~4.5x multiple on January 7, which as of writing this article is most likely higher as we have seen its strong performance since then.
Another fact worth mentioning here is that the weighted-average dividend yield of the portfolio is 3.3%, which is also supportive of the attractive valuation hypothesis.
Next, a solid share of holdings, nearly 42%, is sporting no less than a B- Quant Valuation grade, which means they are priced at a comfortable discount to their respective sector’ medians as well as historical averages; more specifically, most undervalued stocks are from the real estate (6.4% of the net assets) and financial (6.5%) sectors.
ONEY has decent exposure to the quality factor
Another reason to consider ONEY is that its quality is nothing short of robust. A nice surprise is that its profitability profile has grossly improved since my previous note as the share of stocks with a B- Quant Profitability rating or better is now nearly 85% vs. 66% previously.
Next, though companies incapable of returning even a measly net profit are present, mostly financials, they account for less than 6% of the portfolio. In the meantime, only 2% failed to deliver a positive net operating cash flow. So, companies with either temporary working capital issues or those that have more profound weaknesses (stiff competition, business model issues, inadequate capital allocation, etc.) have only a marginal impact on the fund’s distributions and price returns.
Dividend durability and growth are adequate
At the moment, ONEY offers a decent 3% dividend yield. Importantly, its trailing twelve months and 3-year dividend compound annual growth rates are confidently above all other rated ETFs’ median. ONEY’s September 2022 quarterly distribution of $0.798069 had been the highest since inception, with the December one being only marginally lower.
Seeking Alpha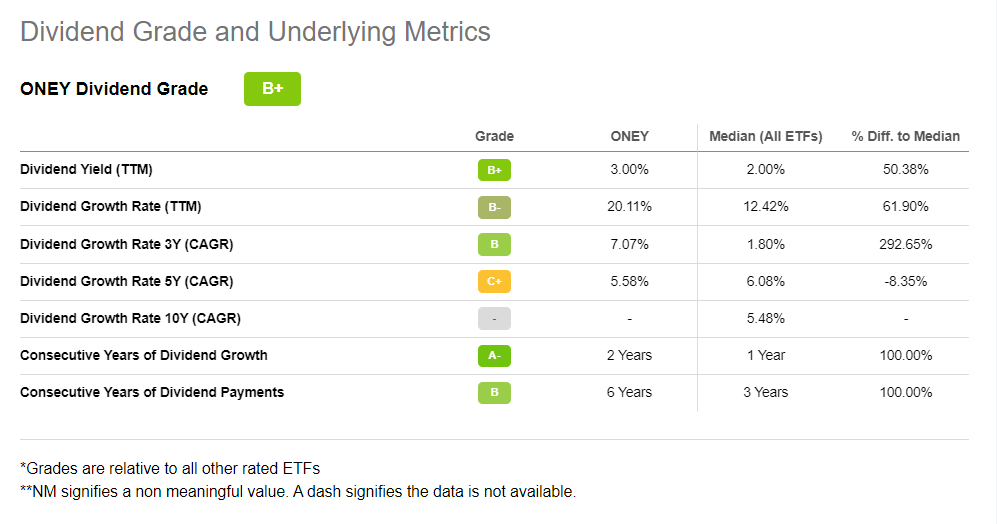
One of the strong indications of dividend durability is that over 80% of the holdings have a dividend yield either equal to or meaningfully below their cash flow yield (net CFFO/market cap; the financial sector is excluded from the analysis).
Another fact worth mentioning is that 65% of stocks in the portfolio have at least a B- Quant Dividend Safety grade, like Hubbell (HUBB); about 62.5% have a B- Consistency and better. So at least until the annual rebalancing in June, I do not anticipate it to change significantly.
The table below containing the key valuation, growth, quality, dividend, and performance characteristics for the key ten holdings is supposed to provide better context on the portfolio’s characteristics.
Created by the author using data from Seeking Alpha and the fund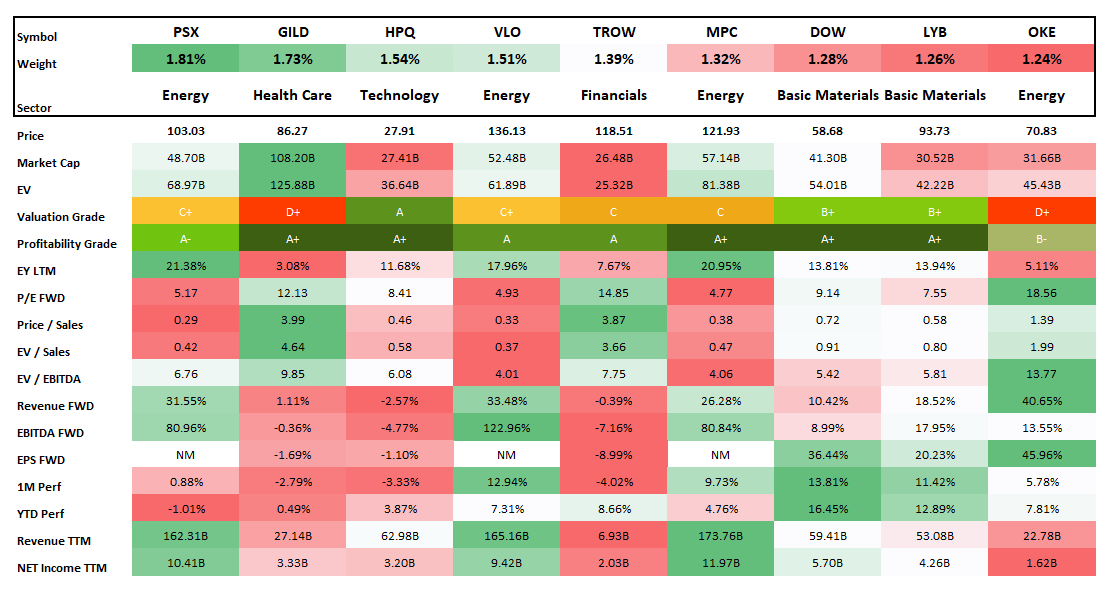
Investor takeaway
ONEY is a comparatively low-cost yield-centered ETF with a noticeable value tilt. Importantly, its liquidity is healthy.
Its performance was not perfect in the past; during the January 2016 – December 2022 period, it underperformed IVV delivering a total return a few bps lower, primarily because in the 2010s, investors favored other factors the fund is not supposed to target, namely growth (mostly regardless of quality), especially during the pandemic. Nevertheless, it did manage to beat the IWB which is much less selective than IVV (i.e., it has no net profit screen).
| Portfolio | ONEY | IVV | IWB |
| Initial Balance | $10,000 | $10,000 | $10,000 |
| Final Balance | $21,233 | $21,364 | $20,926 |
| CAGR | 11.36% | 11.45% | 11.12% |
| Stdev | 20.53% | 16.26% | 16.53% |
| Best Year | 36.08% | 31.25% | 31.06% |
| Worst Year | -8.67% | -18.16% | -19.19% |
| Max. Drawdown | -35.96% | -23.93% | -24.57% |
| Sharpe Ratio | 0.58 | 0.68 | 0.66 |
| Sortino Ratio | 0.86 | 1.03 | 0.98 |
| Market Correlation | 0.89 | 1 | 1 |
Created by the author using data from Portfolio Visualizer
However, despite having a few soft years, it staged a strong recovery in 2021, with momentum lasting into 2022, and, I suppose, with the potential to continue outperforming in 2023.
| Portfolio | ONEY | IVV | IWB |
| Initial Balance | $10,000 | $10,000 | $10,000 |
| Final Balance | $13,115 | $10,538 | $10,208 |
| CAGR | 14.52% | 2.65% | 1.03% |
| Stdev | 19.97% | 18.88% | 18.61% |
| Best Year | 36.08% | 28.76% | 26.32% |
| Worst Year | -3.62% | -18.16% | -19.19% |
| Max. Drawdown | -16.41% | -23.93% | -24.57% |
| Sharpe Ratio | 0.73 | 0.18 | 0.1 |
| Sortino Ratio | 1.22 | 0.26 | 0.13 |
| Market Correlation | 0.87 | 1 | 1 |
Created by the author using data from Portfolio Visualizer. 1 January 2021 – 31 December 2022
A minor disappointment is higher volatility, though it is not outright intolerable, so I believe this is not a sufficient reason for pessimism.
In sum, I maintain the Buy rating.
Be the first to comment