

andresr/E+ via Getty Images
The Fidelity Nasdaq Composite Index ETF (NASDAQ:ONEQ) provides exposure to stocks listed on the Nasdaq stock exchange. While the Nasdaq-100 (QQQ) often gets more attention with its large-cap focus, the Nasdaq Composite is broader and technically includes over 3,700 companies. The attraction of the Fidelity ETF is its more diversified profile while capturing some mid and small-cap trends.
That being said, we note that ONEQ has historically underperformed QQQ which raises questions about its strategy and value as an ETF. While we are long-term stock market bulls and see opportunities within ONEQ holdings, we highlight some weaknesses in the fund structure that help explain its recurring lag relative to the Nasdaq-100. We believe the alternative QQQ may simply be a better option as a long-term investment and it makes sense to just avoid ONEQ.
What is the ONEQ ETF?
ONEQ tracks the Nasdaq Composite index through a statistical-sampling approach. This means that with 1,015 current holdings, ONEQ is intended to be closely correlated to the actual Nasdaq Composite, even if it’s not invested in some of the smallest companies. Nevertheless, the key point here is that compared to the Nasdaq-100, ONEQ has key differences based on the additional +900 stocks that end up driving marginal style and factor tilts.
From the top 10 positions, the market cap weighting methodology naturally keeps the mega-cap leaders from Apple Inc. (AAPL), Microsoft Corp. (MSFT), and Amazon.com, Inc. (AMZN) with the biggest representation in the fund. The exposure to these stocks with the Nasdaq composite is nearly identical to the Nasdaq-100 because their market values are comparatively much larger.
At the same time, subtle spreads are more evident when looking at the entire portfolio. ONEQ’s top 10 holdings represent 47% of the fund while that measure is closer to 51% in the QQQ. Down the line, ONEQ’s portfolio composition includes 10% exposure to small and micro-cap companies, which is in contrast to QQQ that’s effectively 100% large-cap.
Seeking Alpha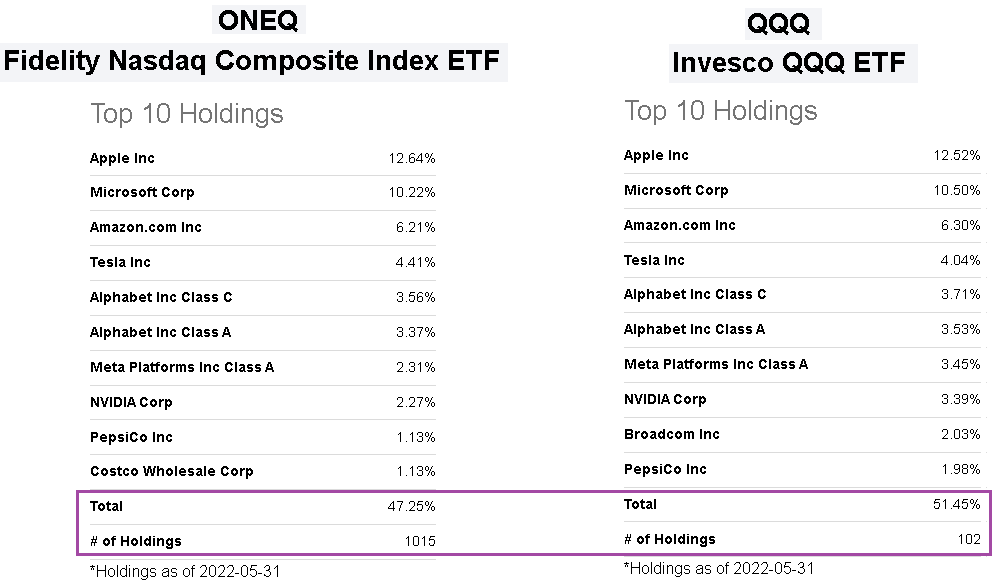
The other dynamic to note is the sector exposure in ONEQ compared to QQQ. Given the larger portfolio and more diverse group of companies, ONEQ through the Nasdaq Composite is slightly underweight the technology sector compared to the Nasdaq-100, while notable overweight other sectors like financials, real estate, and energy. Again, these types of differences have an impact on the fund’s overall performance.
Seeking Alpha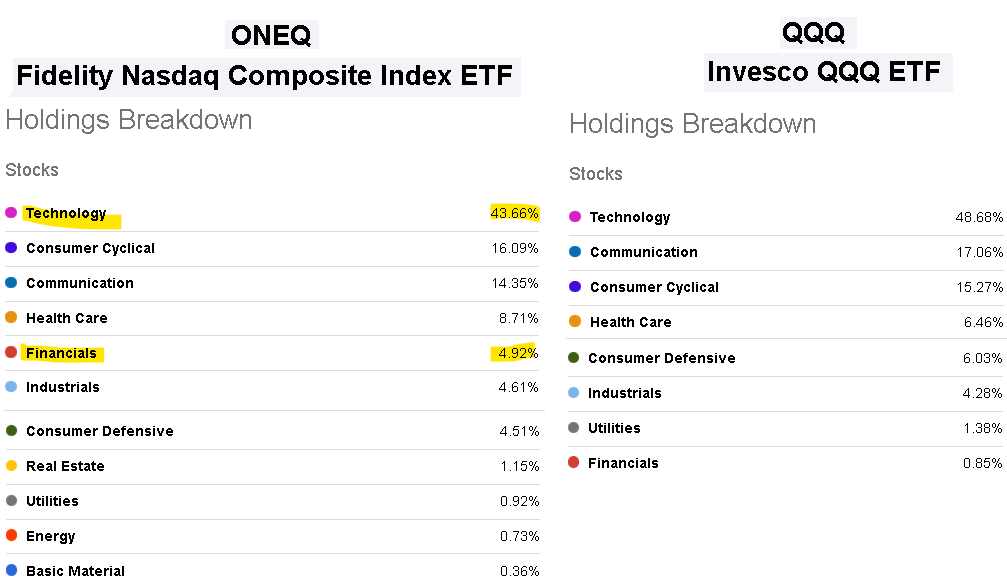
ONEQ Performance
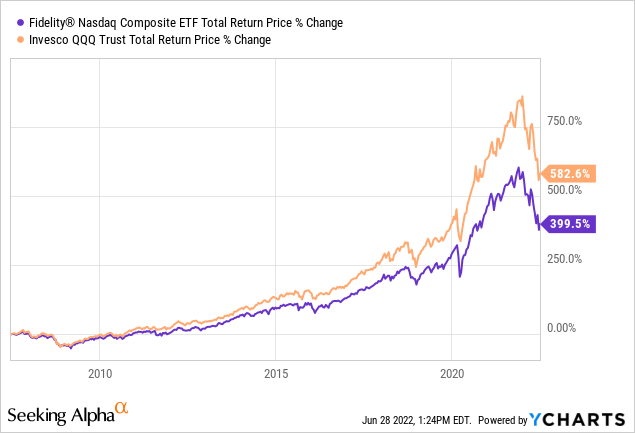
We mentioned ONEQ and the Nasdaq Composite have under-performed the Nasdaq-100 and the QQQ ETF. With data going back 15 years which captures the cycle from the pre-financial crisis crash in 2008 and historic bull market run from the last decade, ONEQ has returned a cumulative 399.5% compared to an even more impressive 582.6% in QQQ over the period.
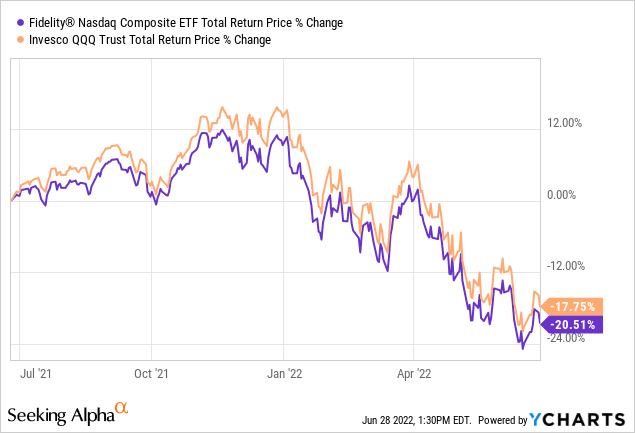
What we find is that this lag has been a recurring pattern over different time frames. In the last five years, ONEQ has returned 92.5%, well below the 114.5% gain in QQQ. Just looking at the past year, ONEQ is currently down 20.5% compared to a 17.8% decline in QQQ. It’s not a coincidence that ONEQ is the only ETF that is meant to track the Nasdaq Composite while there are a handful of funds that provide exposure to the Nasdaq-100.
ONEQ Analysis
There are a couple of reasons to explain the apparent systematic underperformance of ONEQ compared to the Nasdaq-100. First, it’s clear that QQQ as a more “top-heavy” fund benefited from its overweight exposure to tech leaders that delivered massive gains over the past decade. For all intents and purposes, stocks like AMZN and TSLA ended up being transformational during the 2010s, and it paid to have larger positions.
There is also data that shows large-cap growth stocks have outperformed over the last several years. In this regard, the Nasdaq Composite and ONEQ ETF got held back by their attempt at diversification with more small-caps and value names.
What isn’t directly captured in the data is evidence that the Nasdaq-100 is a higher quality index beyond its equity style and composition. Anecdotally, by focusing on the largest 100 companies within the broader composite, the effect is to filter out some of the weakest names while avoiding micro-caps and “penny stocks” that have particularly poor fundamentals. So while diversification is typically a positive when it comes to portfolio construction, the challenge with using the Nasdaq Composite as the benchmark is that the index itself is not efficiently diversified.
To further this point, consider that ONEQ has a 0.7% portfolio exposure to energy. While this has been one of the best performing areas of the market this year, the types of energy companies listed on the Nasdaq are limited as the exchange tends to attract tech and more growth-type names. ONEQ’s exposure to energy wasn’t enough to balance deeper losses in other sectors. Similarly, while ONEQ has a 5% weighting in financials, the leading banks and even insurance companies are mostly on the New York Stock Exchange.
ONEQ Price Forecast
A lot has been written about the headwinds facing stocks. Coming off the pandemic boom between 2020 and 2021, the story this year has been the combination of record inflation hitting economic growth while the Fed’s response with a series of rate hikes has added another layer of macro uncertainty.
Still, we see room for a bullish case emerging going forward. The first step to an improving outlook will be some confirmation of inflation peaking and trending lower. Some confidence that the Fed is capable of gliding the economy into a “soft landing” type of scenario while avoiding a more apocalyptic deep recession can support some new positive momentum in stocks. In this case, we see ONEQ at the current level as an attractive buying opportunity with its exposure to many beaten-down names and mega-cap tech leaders that can re-price higher.
In terms of risks, a deeper deterioration to the economic environment defined by a sharper slowdown in consumer spending or a climbing unemployment rate can open the door for another leg lower. The Russia-Ukraine conflict and geopolitical implications along with the trends in energy prices are key monitoring points for equities as an asset class. It’s hard to say “the bottom” is in, but better-than-expected data going forward can help the narrative evolve.
Seeking Alpha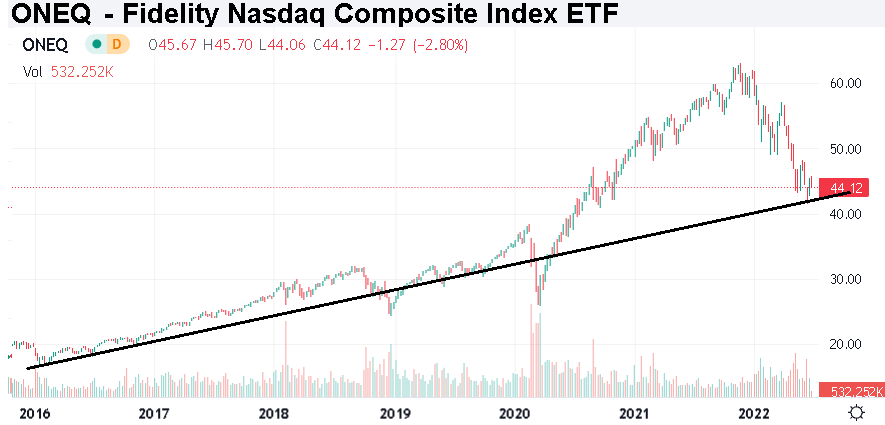
Final Thoughts
While it’s possible ONEQ can rally from here and even outperform over some particular timeframe, what we believe to be a poor composition makes it more volatile on a selloff and sets it up to lag the Nasdaq-100 to the upside. Overall, we’re placing ONEQ in an avoid category as the fund has yet to demonstrate a real purpose to exist beyond being the only one of its kind. Stick with QQQ, it’s just a better ETF.
Be the first to comment