

CreativeNature_nl
ONEOK’s (NYSE:OKE) financial results in the second quarter of 2022 were not attractive. However, due to increasing NGL and natural gas consumption in the second half of 2022 and 1Q 2023, I expect OKE’s adjusted EBITDA to improve significantly. The stock price increased by 17% in the past month and has a good potential to grow further. I am bullish on OKE.
Financial and operational highlights
In its 2Q 2022 financial results, OKE reported total revenues of $5997 million, compared with 2Q 2021 total revenues of $3389 million. The company’s cost of sales and fuel increased from $2,367 million in 2Q 2021 to $4,878 million in 2Q 2022. OKE’s net income attributable to common shareholders increased from $342 million, or $0.77 per diluted share in 2Q 2021 to $414 million, or $0.92 per diluted share in 2Q 2022. OKE reported cash provided by operating activities of $1,250 million in 1H 2022, compared with $1,078 million in 1H 2021. Also, the company’s cash used in investing activities increased from $325 million in 1H 2021 to $543 million in 1H 2022. OKE reported cash used in financing activities of $717 million in 1H 2022, compared with $904 million in 1H 2021. OKE’s cash and cash equivalents of $347 million on 30 June 2021, decreased to $136 million on 30 June 2022.
OKE natural gas liquids segment’s adjusted EBITDA increased from $480 million in 2Q 2021 to $517 million in 2Q 2022, as its raw feed throughput increased from 1,209 MBbl/d to 1,266 MBbl/d. The company’s capital expenditure in its NGL segment increased from $60 million in 2Q 2021 to $150 million in 2Q 2022. OKE natural gas gathering and processing segment’s adjusted EBITDA increased from $229 million in 2Q 2021 to $252 million in 2Q 2022. The company’s natural gas gathered volume decreased by 0.2% YoY; however, its natural gas processed volumes increased by 1% YoY in2Q 2022. OKE natural gas pipelines segment’s adjusted EBITDA increased from $94 million in 2Q 2021 to $116 million in 2Q 2022. Its natural gas G&P segment’s capital expenditure increased from $57 million in 2Q 2021 to $123 million in 2Q 2022. Its natural gas pipeline segment’s capital expenditure decreased from $28 million in 2Q 2021 to $19 million in 2Q 2022. “Expected strong natural gas and NGL volumes, commodity prices, and demand for natural gas transportation and storage services through the remainder of the year support our 2022 financial guidance,” the CEO commented.
The market outlook
Because of higher expected fuel costs and higher energy consumption due to colder temperatures, EIA expects that compared with last winter season, expenditures for homes that heat with natural gas will rise by 28.5% this winter (October 2022 through March 2023). U.S. average consumer consumption is expected to increase from 55.6 Mcf/d in the winter of 2021-22 to 58.4 Mcf/d this winter. U.S. average consumer price for natural gas is expected to increase by 22.5% YoY to $15.95/Mcf (see Figure 1). EIA expects the Henry Hub natural gas spot price to average about $7.40/MMBtu in 4Q 2022 and then fall below $6.00/MMBtu in 2023 as U.S. natural gas production rises. U.S. consumption of natural gas will average 87.9 billion cubic feet per day in 2022, up 3.9 Bcf/d from 2021. In the third quarter of 2022, U.S. dry natural gas production was 98.5 Bcf/d, compared with 95.1 Bcf/d in 1Q 2022. EIA projects that U.S. dry natural gas production to increase to 99.1 Bcf/d in 4Q 2022 and 99.2 Bcf/d in 1Q 2023. U.S. dry natural gas production will increase to 100 Bcf/d in the fourth quarter of 2023 (see Figure 2).
Figure 1 – U.S. average consumer price and expenditures for housing natural gas
eia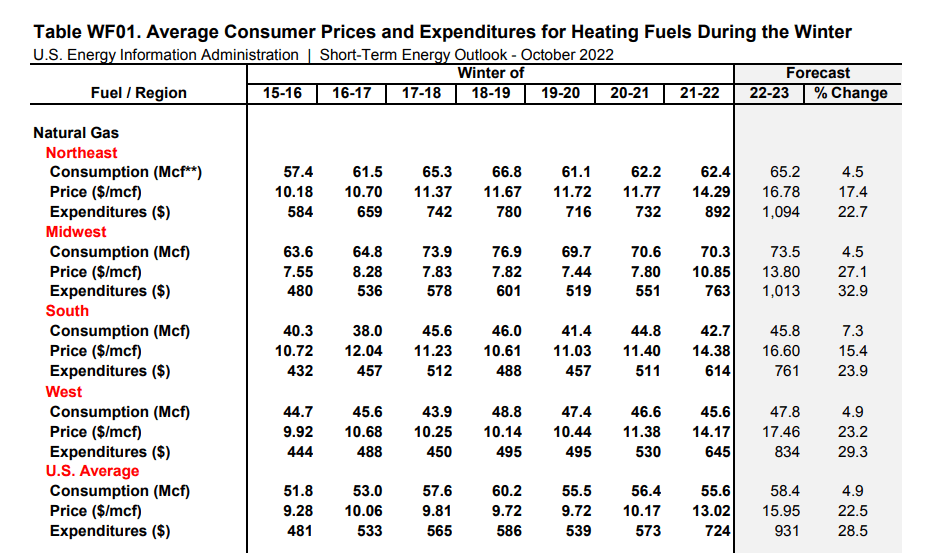
Figure 2 – U.S. energy markets summary
eia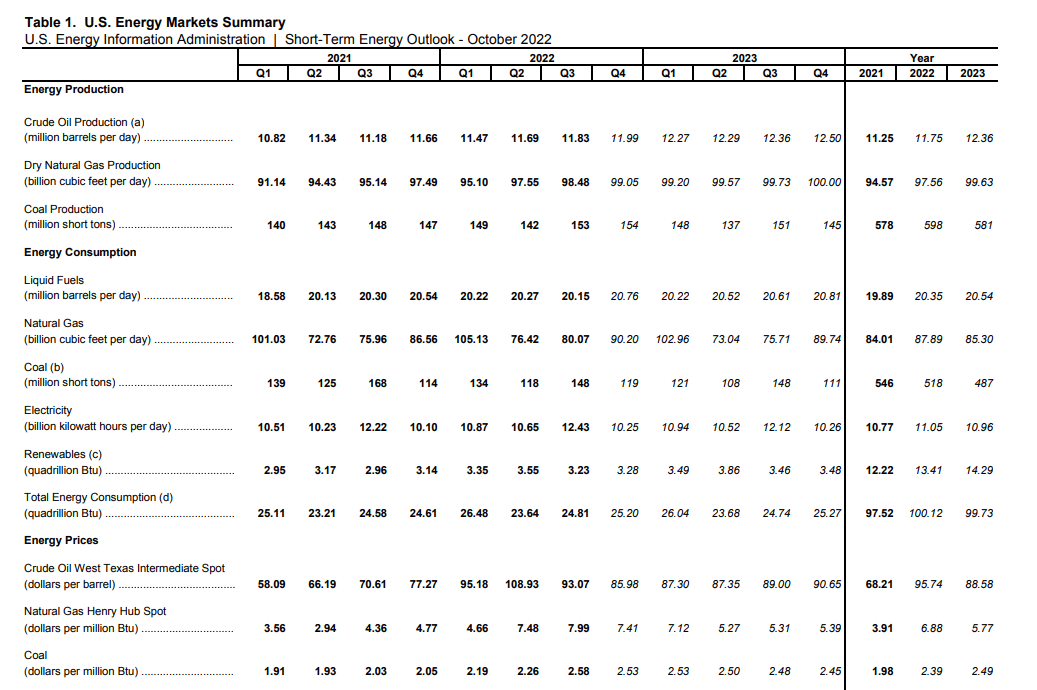
Figure 3 shows that OKE’s average NGL raw feed throughput volume increased from 1,212 MBbl/d in 1Q 2022 to 1,266 MBbl/d in 2Q 2022. In the second quarter of 2022, OKE’s Rocky Mountain region NGL raw feed throughput volumes increased by 10% YoY. Also, its Gulf Coast/Permian region NGL raw feed throughput volumes increased by 10% YoY. The company expected its full-year 2022 NGL raw feed throughput to reach 1,230-1,350 MBbl/d, compared to 1,198 MBbl/d in 2021. It is worth noting that the construction of the 125,000 bpd MB-5 fractionator in Mont Belvieu, Texas, is expected to be completed early in the second quarter of 2023. According to Figure 4, natural gas processing plants in the United States produced more HGL in 3Q 2022 than in 2Q 2022. Ethane, propane, and butane productions in 4Q 2022 and 1Q 2023 are expected to be higher than in 3Q 2022. However, natural gasoline production will decrease. Thus, due to higher NGL raw feed throughput volumes in the second half of 2022, OKE’s adjusted NGL segment adjusted EBITDA in 3Q 2022 and 4Q 2022 will be higher than in 2Q 2022.
Figure 3 – OKE’s NLG raw feed throughput volumes
2Q 2022 presentation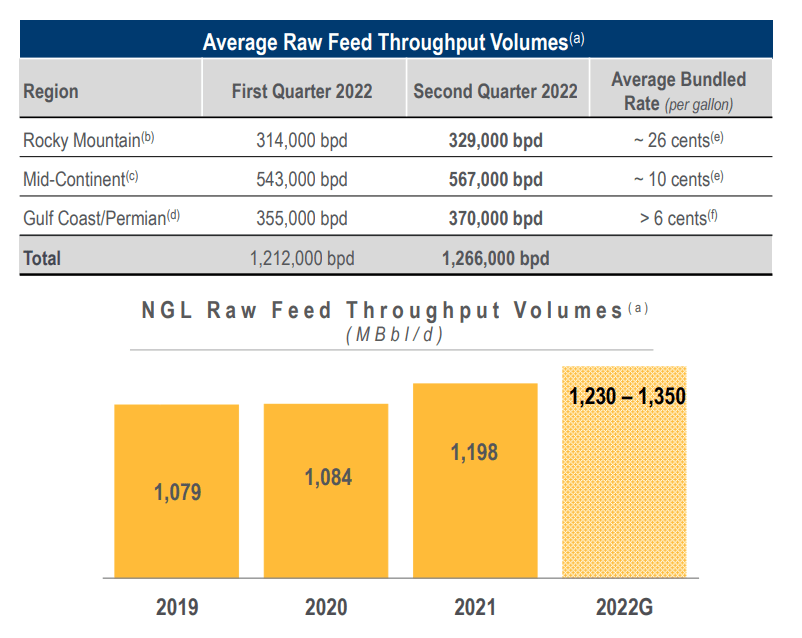
Figure 4 – U.S. HGL production
eia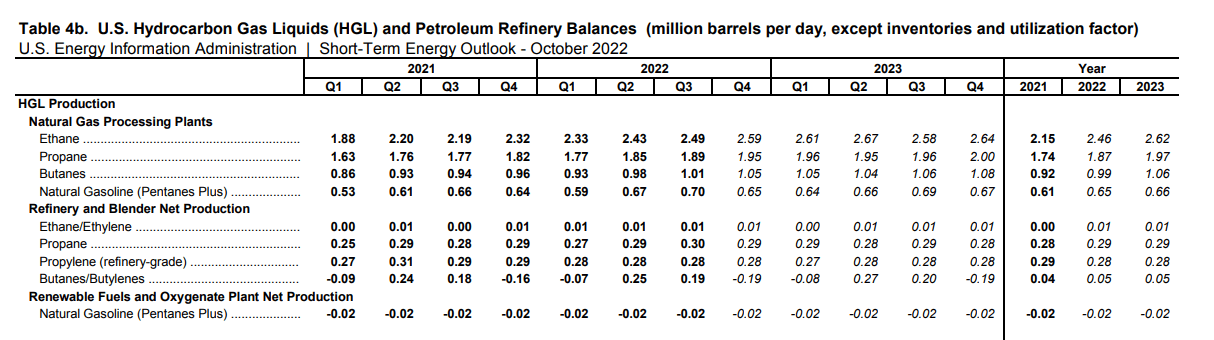
Figure 5 shows that OKE’s natural gas average gathered and processed volumes decreased slightly in 2Q 2022 (compared with 1Q 2022). The company expects its gathered volume to reach 2,090-2,370 MMcf/d in 2022, compared with 2,030 MMcf/d in 2021. Also, OKE expects its processed volume to reach 1,980-2,240 MMcf/d in 2022, compared with 1,903 MMcf/d in 2021. Construction of the 200 million cubic feet per day Demicks Lake III natural gas processing plant in the Williston Basin is expected to be completed in the first quarter of 2023. Due to increasing natural gas consumption in the following months and increasing production of dry natural gas, OKE natural gas G&P segment’s adjusted EBITDA in 2H 2022 and 1H 2023 will be higher than in 1H 2022.
Figure 5 – OKE’s natural gas G&P
2Q 2022 presentation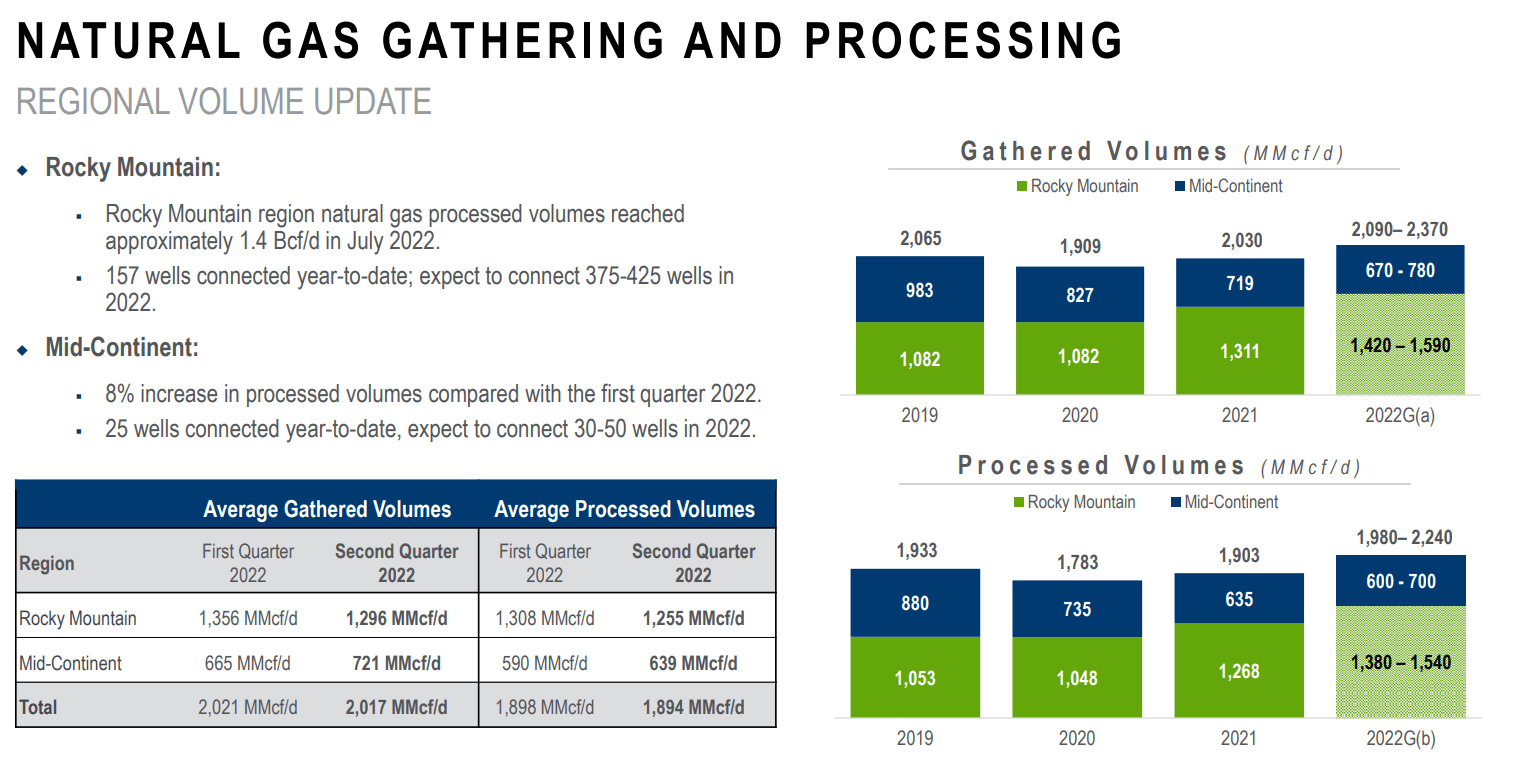
OKE completed a 1.1 billion cubic feet expansion of Texas storage facilities in April 2022. The company’s Oklahoma storage capabilities expansion by 4 Bcf is expected to be completed in the second quarter of 2023. According to Figure 6, OKE’s intrastate pipeline system interconnects Mid-Continents and Permian Basin, Mexico markets, and Gulf Coast market. Also, OKE’s interstate pipeline system makes bi-directional connectivity between key markets. In the second quarter of 2022, U.S. natural gas consumption was 76.42 Bcf/d and increased to 80.07 Bcf/d in 3Q 2022. U.S. natural consumption is expected to increase to 90.20 Bcf/d in 4Q 2022 and 102.96 Bcd/d in 1Q 2023. However, as the winter season ends, U.S. natural gas consumption will decrease 73.04 Bcf/d in 2Q 2023. I expect OKE natural gas G&P segment’s adjusted EBITDA in 3Q 2022 to be higher than in 2Q 2022. Also, I expect its natural gas G&P segment’s adjusted EBITDA in 4Q 2022 and 1Q 2023 to be stronger than in the previous quarters.
Figure 6 – OKE’s natural gas pipelines
2Q 2022 presentation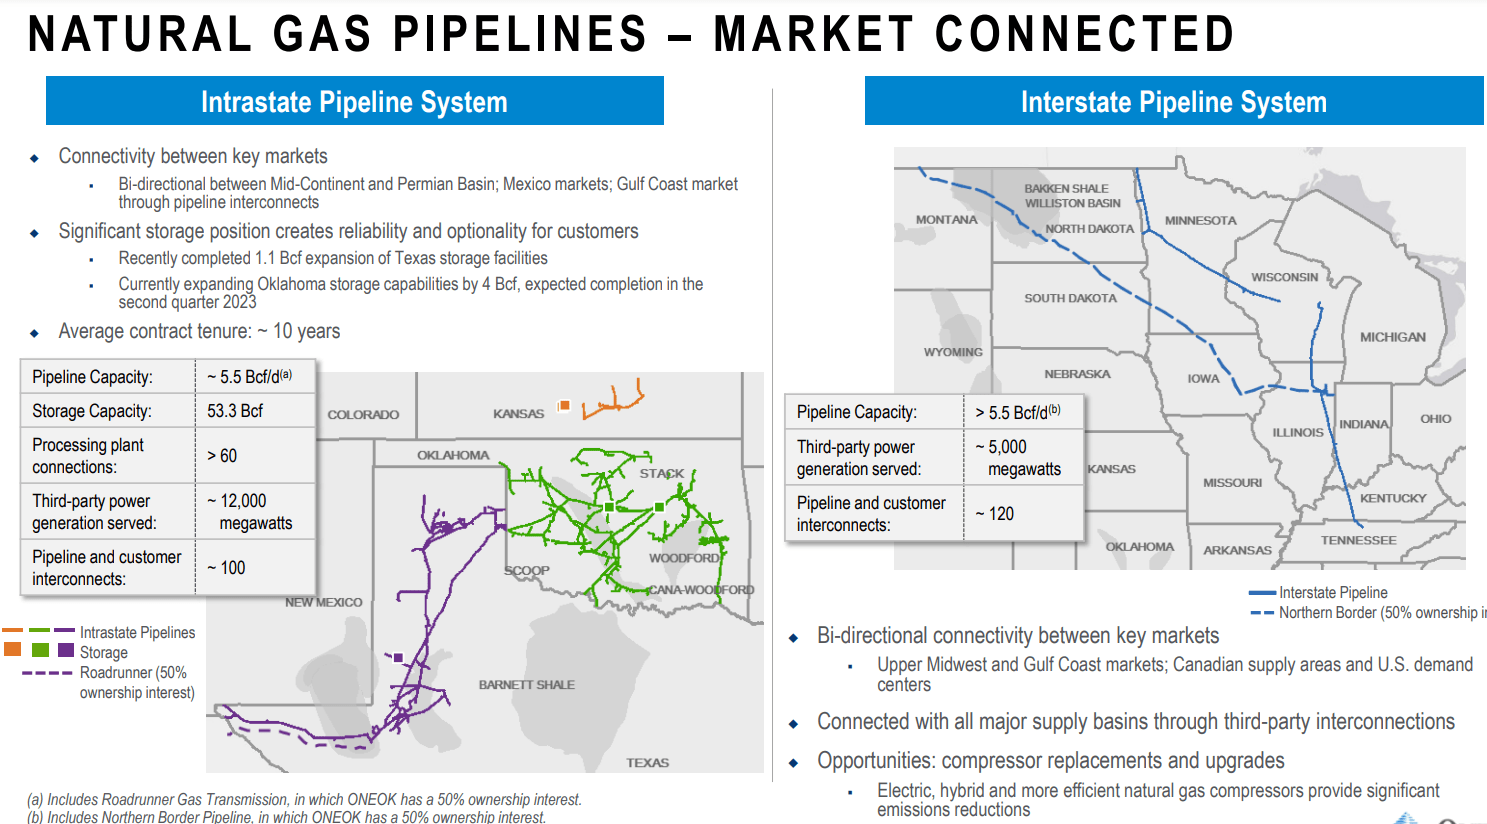
ONEOK performance outlook
In this analysis, I did some investigations on OKE’s profitability condition across the board of margin ratios. Generally, margin ratios capture the capability of the company to convert sales into profits in different measurements. In this regard, I would investigate ONEOK Inc.’s gross profit, EBITDA, and cash flow margin conditions and compare them with previous years. After increasing to 0.4 at the end of 2020, its gross profit margin waned to 0.26 and 0.20 in 2021 and 2Q 2022 (TTM), respectively. Due to the company’s strong financial results in 2Q 2022, I expect the company’s gross profit margin to improve.
Additionally, the cash flow margin indicates the relation between operating cash flow and the company’s total revenue. It is obvious that OKE has been weakened to convert its revenue to cash since the last year. Its cash flow margin decreased by 46% to 0.15 at the end of 2021 versus its amount of 0.22 at the end of 2020. Also, its cash flow margin declined slightly by 13% and sat at 0.13 in 2Q 2022 (TTM). Furthermore, after some years of continuous incline to reach 0.30, OKE’s EBITDA margin declined and sat at 0.19 and 0.15 in 2021 and 2Q 2022 (TTM), respectively. However, as I expect the company’s adjusted EBITDA to increase in the second half of the year, OKE’s cash flow margin and EBITDA margin will improve (see Figure 7).
Figure 7 – OKE’s margin ratios
Author (based on SA data)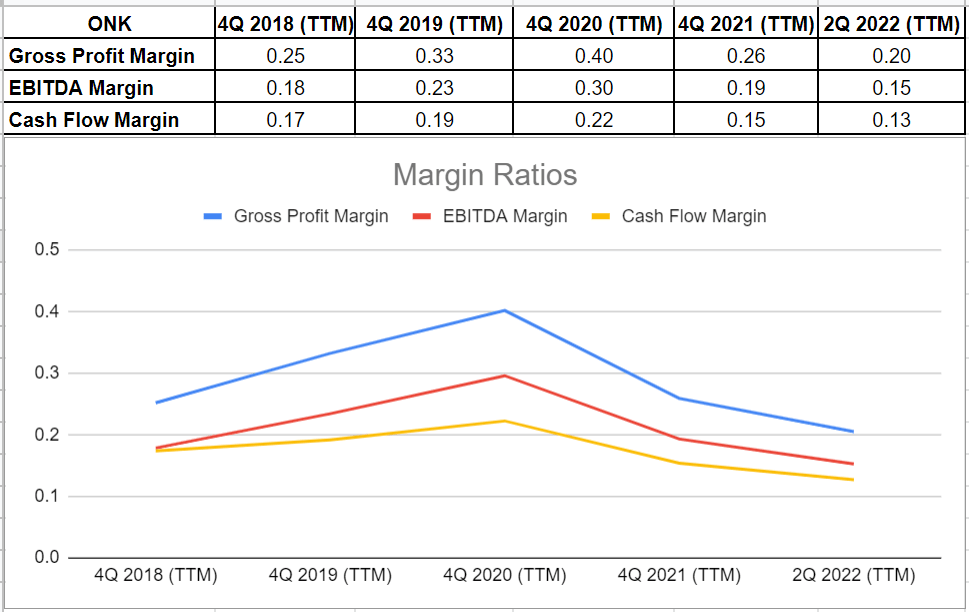
Summary
Due to increased fee rates, hiked commodity prices, and increasing NGL and natural gas consumption, OKE can make a significant profit in the winter season. Also, the company’s results in 3Q 2022 will be better than in 2Q 2022, implying that its margin ratios will improve. The stock is a buy.
Be the first to comment