

grandriver/E+ via Getty Images
Investment Thesis
Omega Healthcare Investors, Inc. (NYSE:OHI) is the largest Skilled Nursing Facility focused REIT, with 700+ SNF properties leased to 60+ tenants who actually operate the Skilled Nursing Facility (SNF).
Many investors view SNFs as an attractive segment of the health care real estate markets, perhaps associating skilled care with higher revenue, and aware of the $28 billion Medicare paid for SNF services in 2021.
However, an analysis of the SNF business in general, and OHI specifically, indicate that the tenants primarily provide long term care to indigent Medicaid patients, with very low revenue per patient-day, less than half that paid by Medicare.
This appears to be the root cause of recurrent problems with tenants inability to pay rent; the tenants are in a fundamentally low margin business, leaving the tenant’s business viability at risk from even minor management mistakes, unforeseen events, or regulatory changes.
Investors should be careful to understand the actual business mix of OHI’s tenants. I view this business mix as intrinsically unattractive, and choose to avoid it.
Introduction
In this article, we will discuss the general SNF business, what constitutes “skilled” care, the role of Medicare vs. Medicaid, the REIT footprint in the business, OHI specifics, and finally how an investor might think about all this. There is some detail required, so bear with me.
Be aware that terminology in this area is often imprecise.
There is often minor inconsistency in the numbers, among and even within sources, and not all data is from the same reporting period, but I believe it is generally inconsequential to this analysis. Note also that some numbers for 2020 and 2021 are impacted by COVID, and significant but temporary COIVD related payments.
The Medicare Payment Advisory Commission (MedPAC) is a permanent U.S. government commission which provides analysis and recommendations to Congress; it is a public domain data and analysis resource. They issue reports twice a year.
Chapter 7, Skilled Nursing Facility Services, from MedPAC’s March 2022 Report to the Congress: Medicare Payment Policy contains a great deal of information and analysis on the SNF business. For anyone considering investments in the SNF area, this chapter is worth reading.
The National Investment Center for Seniors Housing & Care (NIC), collects and analyzes a great amount of data. This data and analysis is available to corporate partners like OHI, is sometimes reported to the public, but is not generally freely available for use. Occasionally elements of this data become available in news stories.
Professional service vendors may also provide useful information. The CLA annual report on SNF costs for example, provides a quantitative view of the 25-50-75 percentile variance for many SNF operational and financial metrics.
The Skilled Nursing Facility Business
The data in this section is from the MedPAC’s March 2022 report, unless otherwise noted.
Some Basic Numbers
There are about 15,000 certified SNFs; more than 94% are dual certified as nursing homes in order to accept Medicaid. Almost all (> 90%) nursing homes are Medicaid certified.
In 2020, 96 percent of SNFs were freestanding (not hospital affiliated). For-profit facilities accounted for 71 percent of providers. The median size is 100 beds.
Skilled Care
The U.S. government Center for Medicare and Medicaid Services (CMS) defines skilled care as “nursing and therapy care that can only be safely and effectively performed by, or under the supervision of, professionals or technical personnel.”
CareTrust (CTRE) provides a definition for SNFs in its recent Investor Presentation:
Licensed healthcare facility the provides restorative, rehabilitative and nursing care for people not requiring the more extensive and sophisticated treatment available at an acute care hospital or long-term acute care hospital. Treatment programs include physical, occupational, speech, respiratory, ventilator, and would therapy.
Operationally, one could say this involves at least daily attention from a licensed nurse, possibly almost daily from a licensed therapist, and some involvement from higher level medical personnel. Tasks might include medical monitoring, wound care, catheter management, delivery of antibiotics or other medications via IV, and management of prescription narcotics for pain management. The intensity of care may vary significantly.
One can contrast this with the level of care provided in an Assisted Living Facility (ALF), which provides help with the six Activities of Daily Living (e.g. eating, moving, dressing, personal hygiene, continence, toileting). ALFs may also include help with medication management.
Any parent will immediately recognize that the six ADLs are a fair description of what’s involved in taking care of 18 month old. I’ve described this as “Mom care”. While it’s critical to the recipient, this level of care is not prescribed by or delivered by medical personnel, and is not considered “skilled” in that sense.
However, a combination of multiple ADL functional disabilities, health issues, cognitive impairment, and behavior issues may tip the scale for a doctor to prescribe long term “nursing home level of care” in a nursing home as medically necessary.
This difference in intensity of care is reflected in cost. Genworth reports that the national median cost in 2021 for a private room in an ALF is $4500 per month, or $148 per day. This is 50% of the cost for a private room in a nursing home.
This comparison can be extended to SNF care. As we will see below: $148 per day for ALF, $225 for Medicaid long term care, $539 for traditional Medicare rehabilitation care. These are different products; this conclusion doesn’t rely on extreme precision in the numbers; these are large differences.
Medicare vs. Medicaid
It’s worth briefly summarizing the difference between Medicare and Medicaid.
Medicare is funded entirely by the U.S. Federal government, and is generally limited to persons 65 years and older. Medicare is not means tested.
If you qualify for Medicare Part A, and require skilled care, Medicare will pay 100% of the costs for days 1-20, all but a copay of $194.50 per day for days 21-100, and nothing after that. The average length of stay in a SNF in the US is, remarkably, about 28 days.
Traditional Medicare is also referred to as FFS Medicare (i.e. fee-for-service), to distinguish it from Medicare Advantage (sometimes called managed Medicare), an alternative insurance program available to Medicare beneficiaries.
Medicare does not generally pay for long term care or Assisted Living care.
Medicaid is a joint state-federal program, targeted toward low-income patients, with funding split about 30/70 state/federal. Excluding federal passthrough funds, Medicaid gets about 18% of state spending, second only to education; it is thus in direct competition with all other state budget items.
Each state manages Medicaid in their state, and has some discretion to define eligibility, covered services, and reimbursement levels.
Medicaid provides Nursing Facility Services if medically necessary, including long term care. In general, one has to be indigent (minimal assets and income) to qualify for Medicaid long term care; see for example the Florida requirements here.
Medicaid may pay some of the cost for Assisted Living care.
Certification and Licensing
To receive payment under the Medicare or Medicaid programs, a skilled nursing facility (SNF) or nursing facilities (NF) must be certified, demonstrating compliance with U.S. regulations as defined under Title 42 CFR Part 483, Subpart B. These regulation covers issues such as staffing, quality of care, medical services, liability, etc. for both SNFs and NFs.
State inspectors perform the actual on the ground inspections and certify compliance, with Center for Medicare and Medicaid (CMS) approval required for SNFs. SNF and NF are actually licensed by the states.
The REIT Footprint in the SNF Business
A SNF includes both the physical real estate and the operator certified and licensed to provide medical services. In some cases the real estate owner and the operator are the same entity (i.e. an owner/operator), in some cases company A owns the real estate and leases it to company B, the operator.
According to a May 2022 report in the Journal of the American Medical Association, in 2021 REITs own 1870 (12%) of SNF properties. These properties are leased under triple-net terms to operators (in some instances the REIT holds a mortgage instead).
CareTrust CEO David Sedgwick recently pointed out that the triple net leases typically used in this area by REITs create an “impenetrable wall” between the REIT and the operator, leaving the REIT with zero control over SNF operations.
It’s notable that in spite of the high cap rates available, none of the largest healthcare REITs – Welltower (WELL), Ventas (VTR), or Healthpeak Properties (PEAK) – now choose to own material SNF real estate, although Welltower and Ventas have very large investments in senior housing. Nor do the large and widely diversified triple net REITs chose to own SNF real estate.
Acquisition volume indicates public companies such as REITs have backed away from SNF acquisitions in recent years.
Skilled Nursing News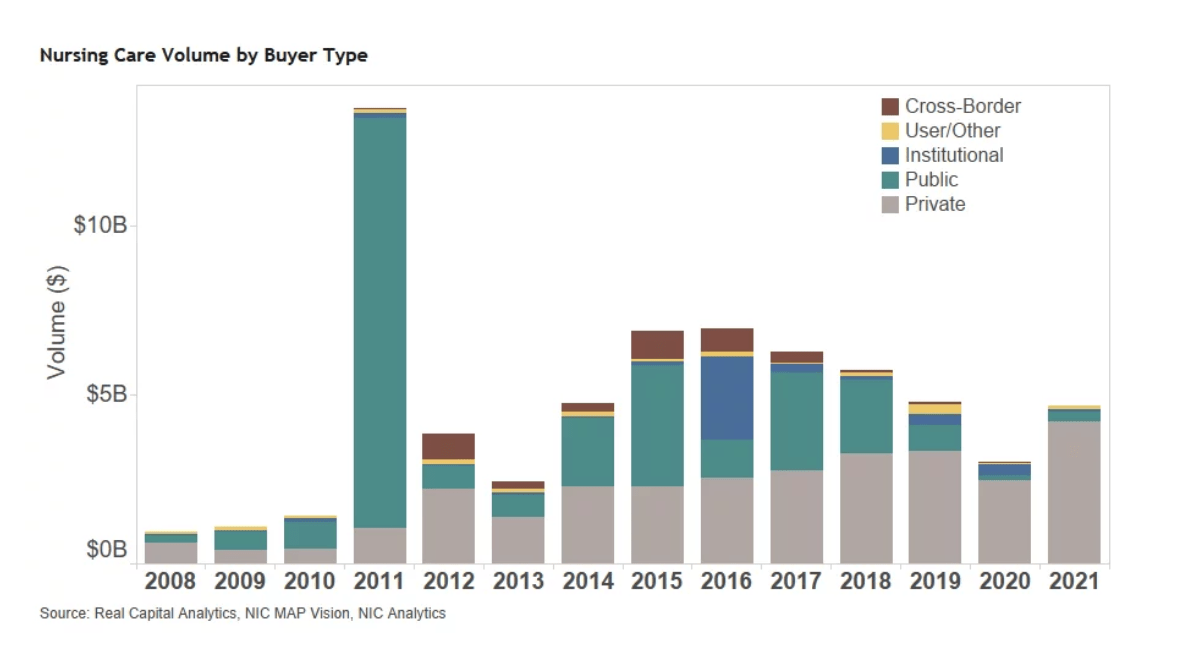
Among the public REITs active in the SNF market, Sabra Health Care (SBRA) identified a peer group of four with >50% NOI from SNF properties – including OHI, SBRA, CareTrust, and LTC Properties (LTC).
Sabra Health Investors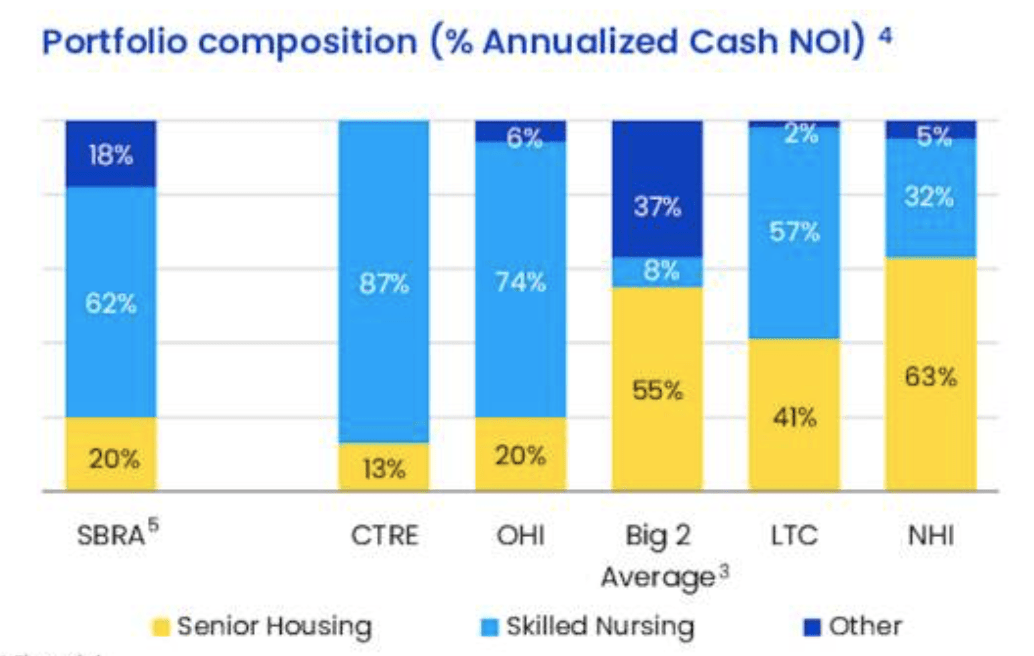
There is some variance in the industry among both properties and operators. Two examples from the CLA report; average age of the physical plant:
CLA report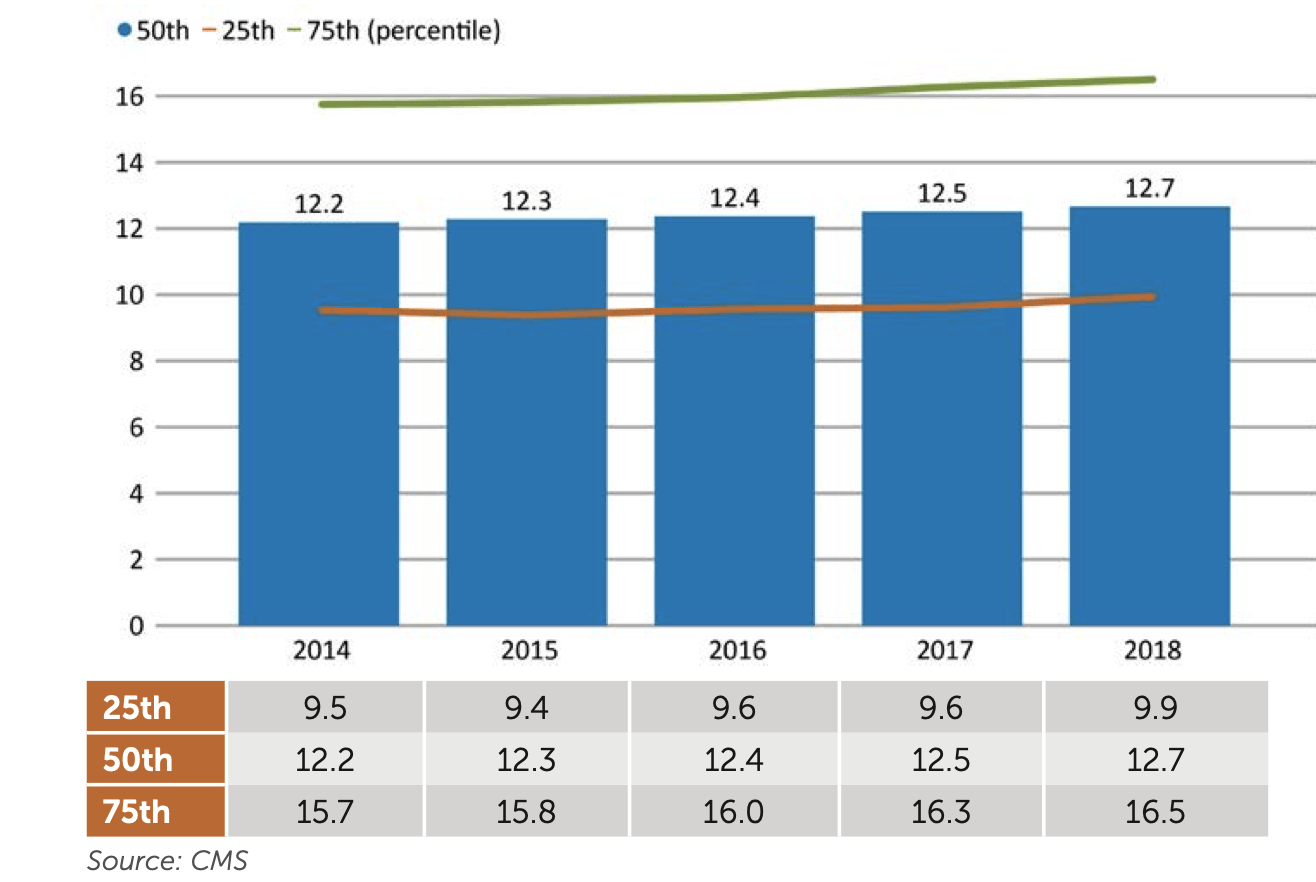
And operating margin:
CLA Report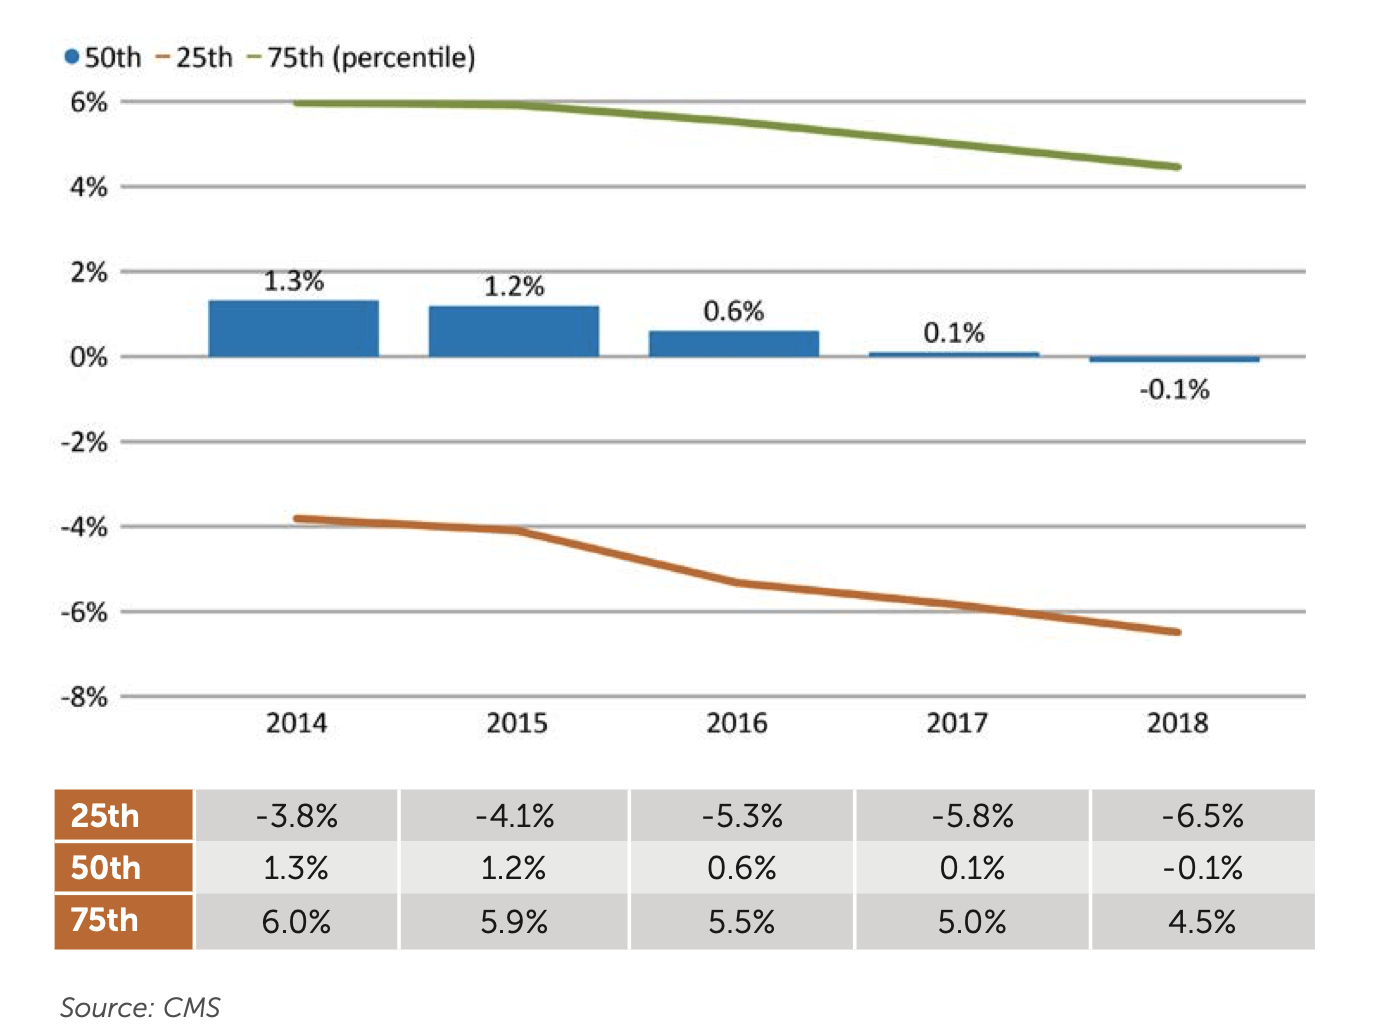
REITs seldom disclose information at this level of detail for their properties or operators, individually or at the REIT level. However, it seems reasonable to assume that REIT properties and operators are median or better.
It’s A Low Margin Business
Operating a SNF today is, on average, a low margin business. The all payer, all business line profit margin for 2019 was 0.6% and 3.0% in 2020. This is a long standing problem.
Here’s a Long Term Care News 2020 comment on the general SNF business, pre-COVID:
SNF operators are on average in a break-even business. The median net profit margin for 2018 was just a quarter of 1%. That largely reflects the fact that low-paying Medicaid patients still account for over 50% of SNFs payer mix. While Medicare had an average net margin of 20%, its patients only account for 15% of SNF utilization.
Who Pays
There are four sources of payment to SNFs – FFS Medicare, Medicare Advantage, private pay, and state Medicaid.
One 2019 snapshot reported by Skilled Nursing News (data from 2016, 2017) shows the distribution of patient days by payor, illustrating the dominant role of Medicaid. This is still the case today.
Skilled Nursing News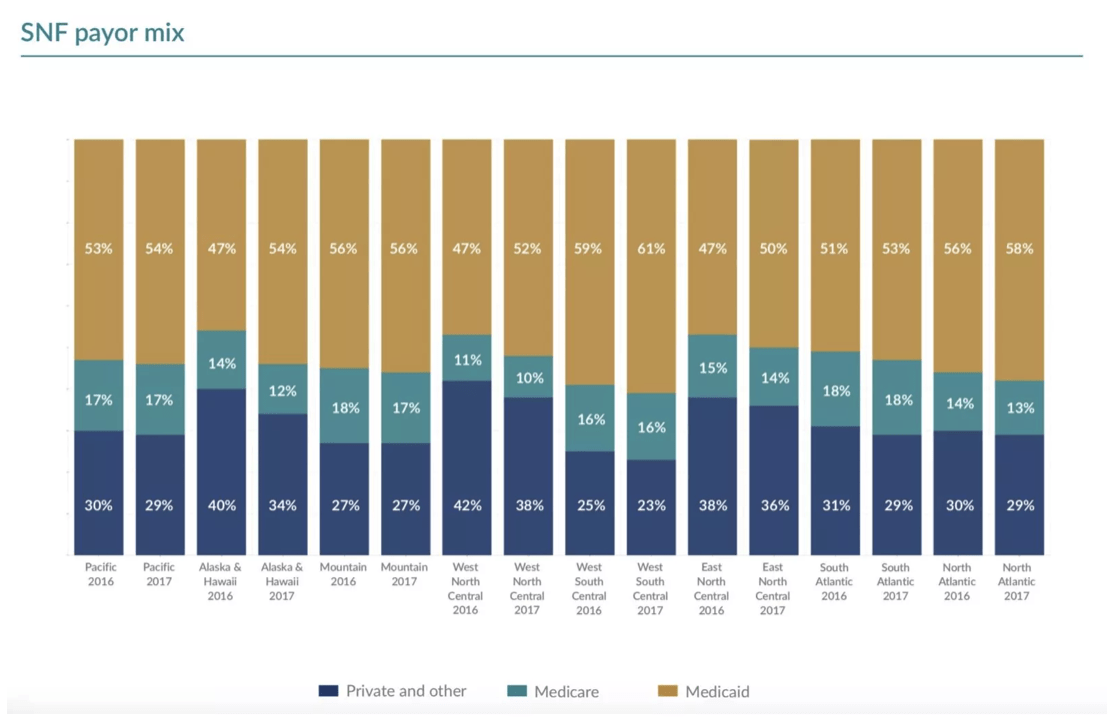
What They Pay For
Medicare (both FFS and Advantage) pay for short-term skilled nursing and rehabilitation services for Medicare beneficiaries.
The MedPAC report says:
Skilled services are defined as ordered by a physician, requiring the skills of technical or professional personnel, and furnished directly by or under supervision of such personnel.
To qualify for Medicare coverage, a beneficiary must require daily skilled nursing or rehabilitation services and have had a preceding hospital stay of at least three days. (This hospital stay requirement was temporarily suspended between March 2021 and April 2022 due to COVID.)
The five most common conditions leading to SNF admission for post-acute care from hospital — septicemia, heart failure and shock, joint replacement, respiratory infections, and hip and femur procedures – account for a quarter of admissions.
Medicare does not generally pay for care after 100 days.
Medicaid does pay for long term care; eligibility is means tested. MedPAC notes:
… a facility that provides skilled care often also provides long-term care services that Medicare does not cover. The less intensive long-term care services typically make up the bulk of a facility’s business, and Medicaid pays for the majority of this care.
Patient Days by Payer
Medicaid paid for 63% of SNF patient days in 2020. FFS Medicare paid for 10%. The remaining 27% of patient days were split between Medicare Advantage and private pay.
The Kaiser Family Foundation (KFF) reports that the fraction of Medicare eligible people who choose Medicare Advantage rather than traditional FFS Medicare has been growing for many years, and reached 42% in 2021. It is projected to reach 50% by 2030.
FFS Medicare Payments and Profits
In 2021 the median FFS Medicare payment for SNF services was $539 per day. FFS Medicare accounted for 17% of SNF revenue in 2020.
The MedPAC table below gives some data on median payments, costs, margins, and of the impact of efficiency on performance measures for 2020. About 9% of the 4,256 SNFs in this sample were rated “relatively efficient”, with a median Medicare margin of $133 per patient-day, or 23%; the other 91% of SNFs had a margin of $78 or 16%.
MedPAC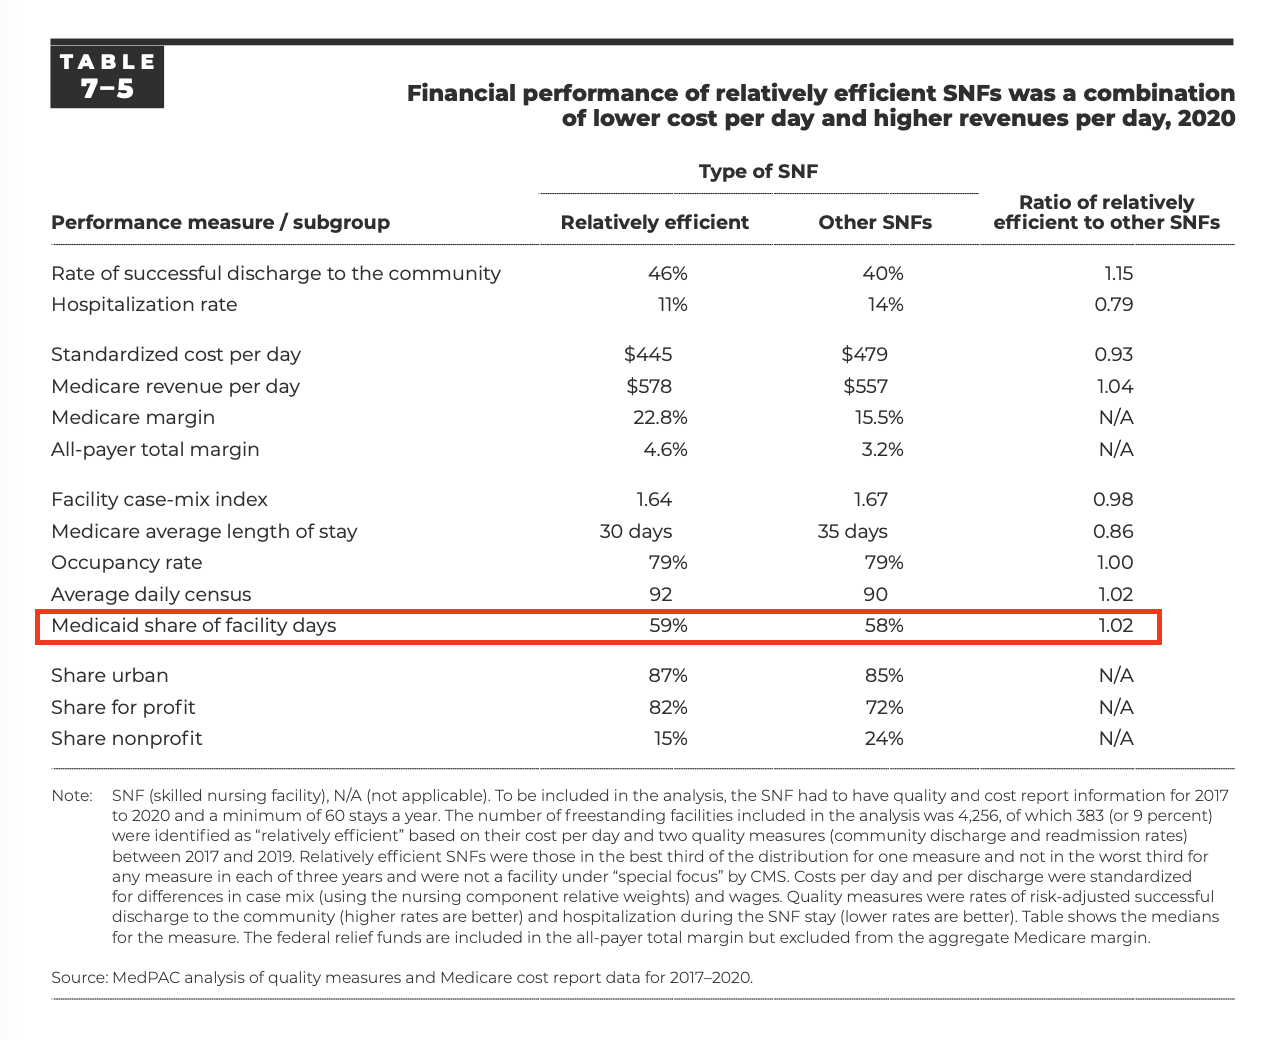
FFS Medicare stays are usually short term, according to the Kaiser Foundation, the average stay for an FFS Medicare patient in a SNF is about 25 days.
The actual operator cost to provide care for Medicare patients was estimated to be in the $450-480 range in 2020, with $480 typical.
The Medicare profit margin was 11.9% in 2019 and 16.5% in 2020. MedPAC reports that for the 21st consecutive year, the aggregate Medicare margin was above 10 percent.
MedPAC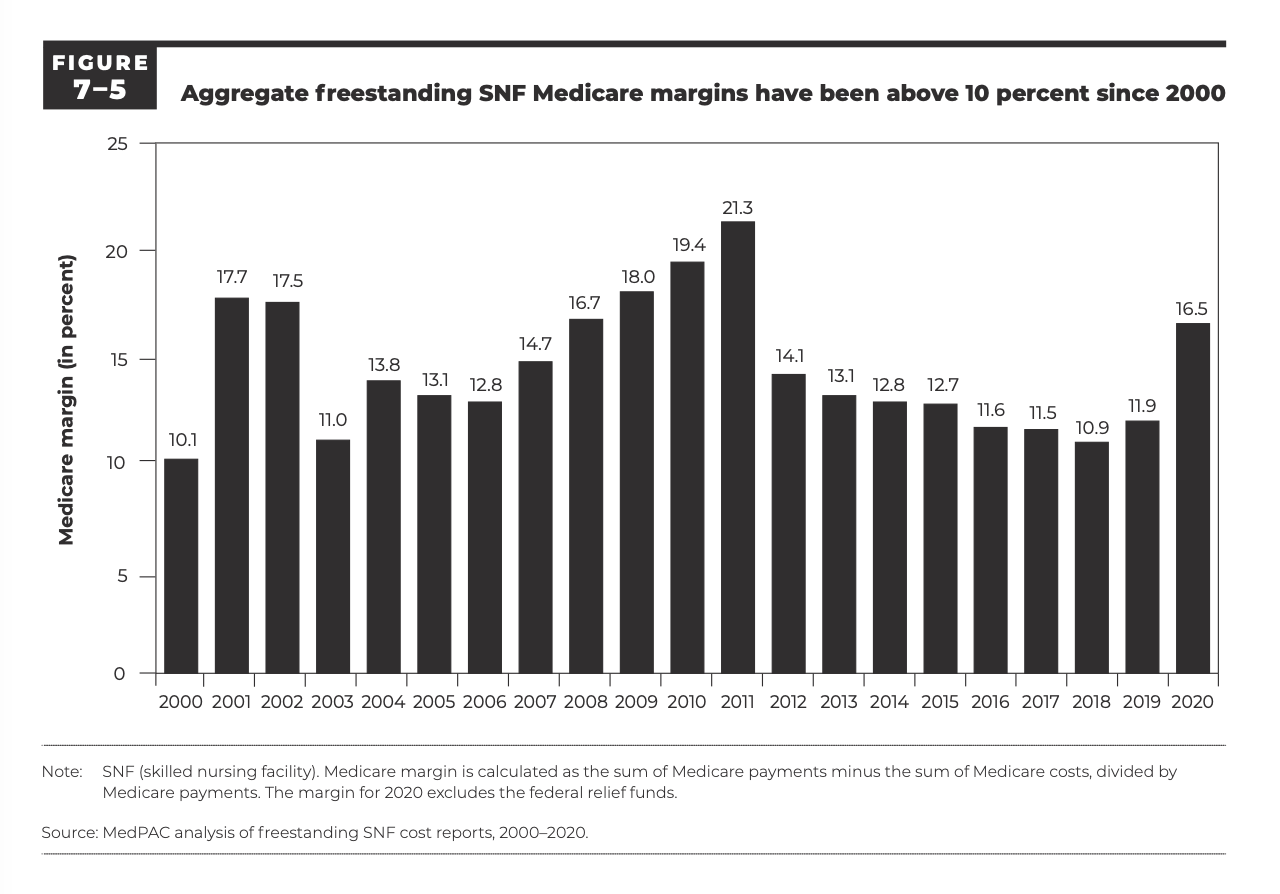
FFS Medicare payments are considered adequate to motivate providers to accept Medicare patients; in 2020 the marginal profit for the incremental Medicare patient was 25%.
Medicare Advantage Payments and Profits
In 2021 the Medicare Advantage (managed Medicare) rate was about 80% of the FFS Medicare rate (see the last row in report Table 7.6 below). The lower payments “are unlikely to be explained by the differences in patient characteristics.”
MedPAC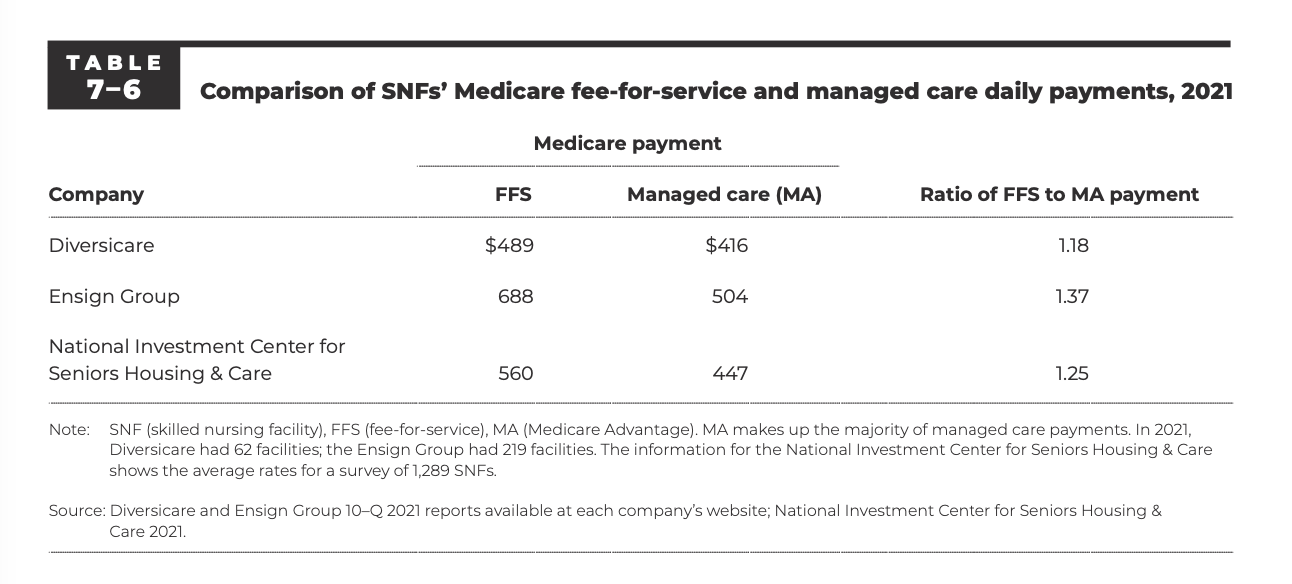
MedPAC does not quantify Medicare Advantage profitability for SNFs, but notes “Some publicly traded post-acute care firms with SNF holdings report seeking managed care patients as a business strategy, indicating that the MA rates are attractive.”
However, if Medicare Advantage patients are paying 20% less than FFS Medicare patients, it seems reasonable to think the profit margin for Medicare Advantage patients is low to very low.
Both SNF usage and length of stay are also lower for Medicare Advantage than FFS Medicare, and provide an obvious benchmark for FFS Medicare.
Private Pay and Medicaid Payments and Profits
Medicaid pays for the vast majority of long-term care patient days provided in nursing homes, but some are private pay.
Genworth reports that the national median cost in 2021 for a semi-private room in a nursing home is $260 per day, and for a private room, $297 per day.
The American Council on Aging reports that “private pay residents pay approximately 25% more for nursing home care than Medicaid pays. In 2022, the nationwide average private payer pays approximately $255 per day for nursing home care while Medicaid pays approximately $206 per day”. Note that Medicaid rates vary by state.
The Medicaid.gov website explains one scenario:
For example, commonly an individual will enter a Medicare SNF following a hospitalization that qualifies him or her for a limited period of SNF services. If nursing home services are still required after the period of SNF coverage, the individual may pay privately, and use any long-term care insurance they may have. If the individual exhausts assets and is eligible for Medicaid, and the nursing home is also a Medicaid certified nursing facility, the individual may continue to reside in the nursing home under the Medicaid NF benefit.
Medicaid long term care is very low margin. The non-Medicare (i.e. Medicaid and private payer) SNF margins in 2020 were -0.3%, an improvement from the -2.4% ,-2.4%, -3.2%, and -2.2% margins in 2015-2019.
A 2020 Skilled Nursing News report on SNF finances noted that
The financial viability of long-term care services is directly correlated to Medicaid funding, and negative operating margins in many regions of the United States suggest more facilities may be forced to close.
The OHI 2021 Annual Report notes that:
Since our operators’ profit margins on Medicaid patients are generally relatively low, more than modest reductions in Medicaid reimbursement and an increase in the number of Medicaid patients could place some operators in financial distress, which in turn could adversely affect us.
About OHI
OHI’s April 2022 Investor Presentation provides a convenient summary of OHI. Their 2021 Annual Report provides additional details. The numbers in this section come from these two sources.
Two key slides tell much of the story for their SNF tenants:
OHI Investor Presentation OHI Investor Presentation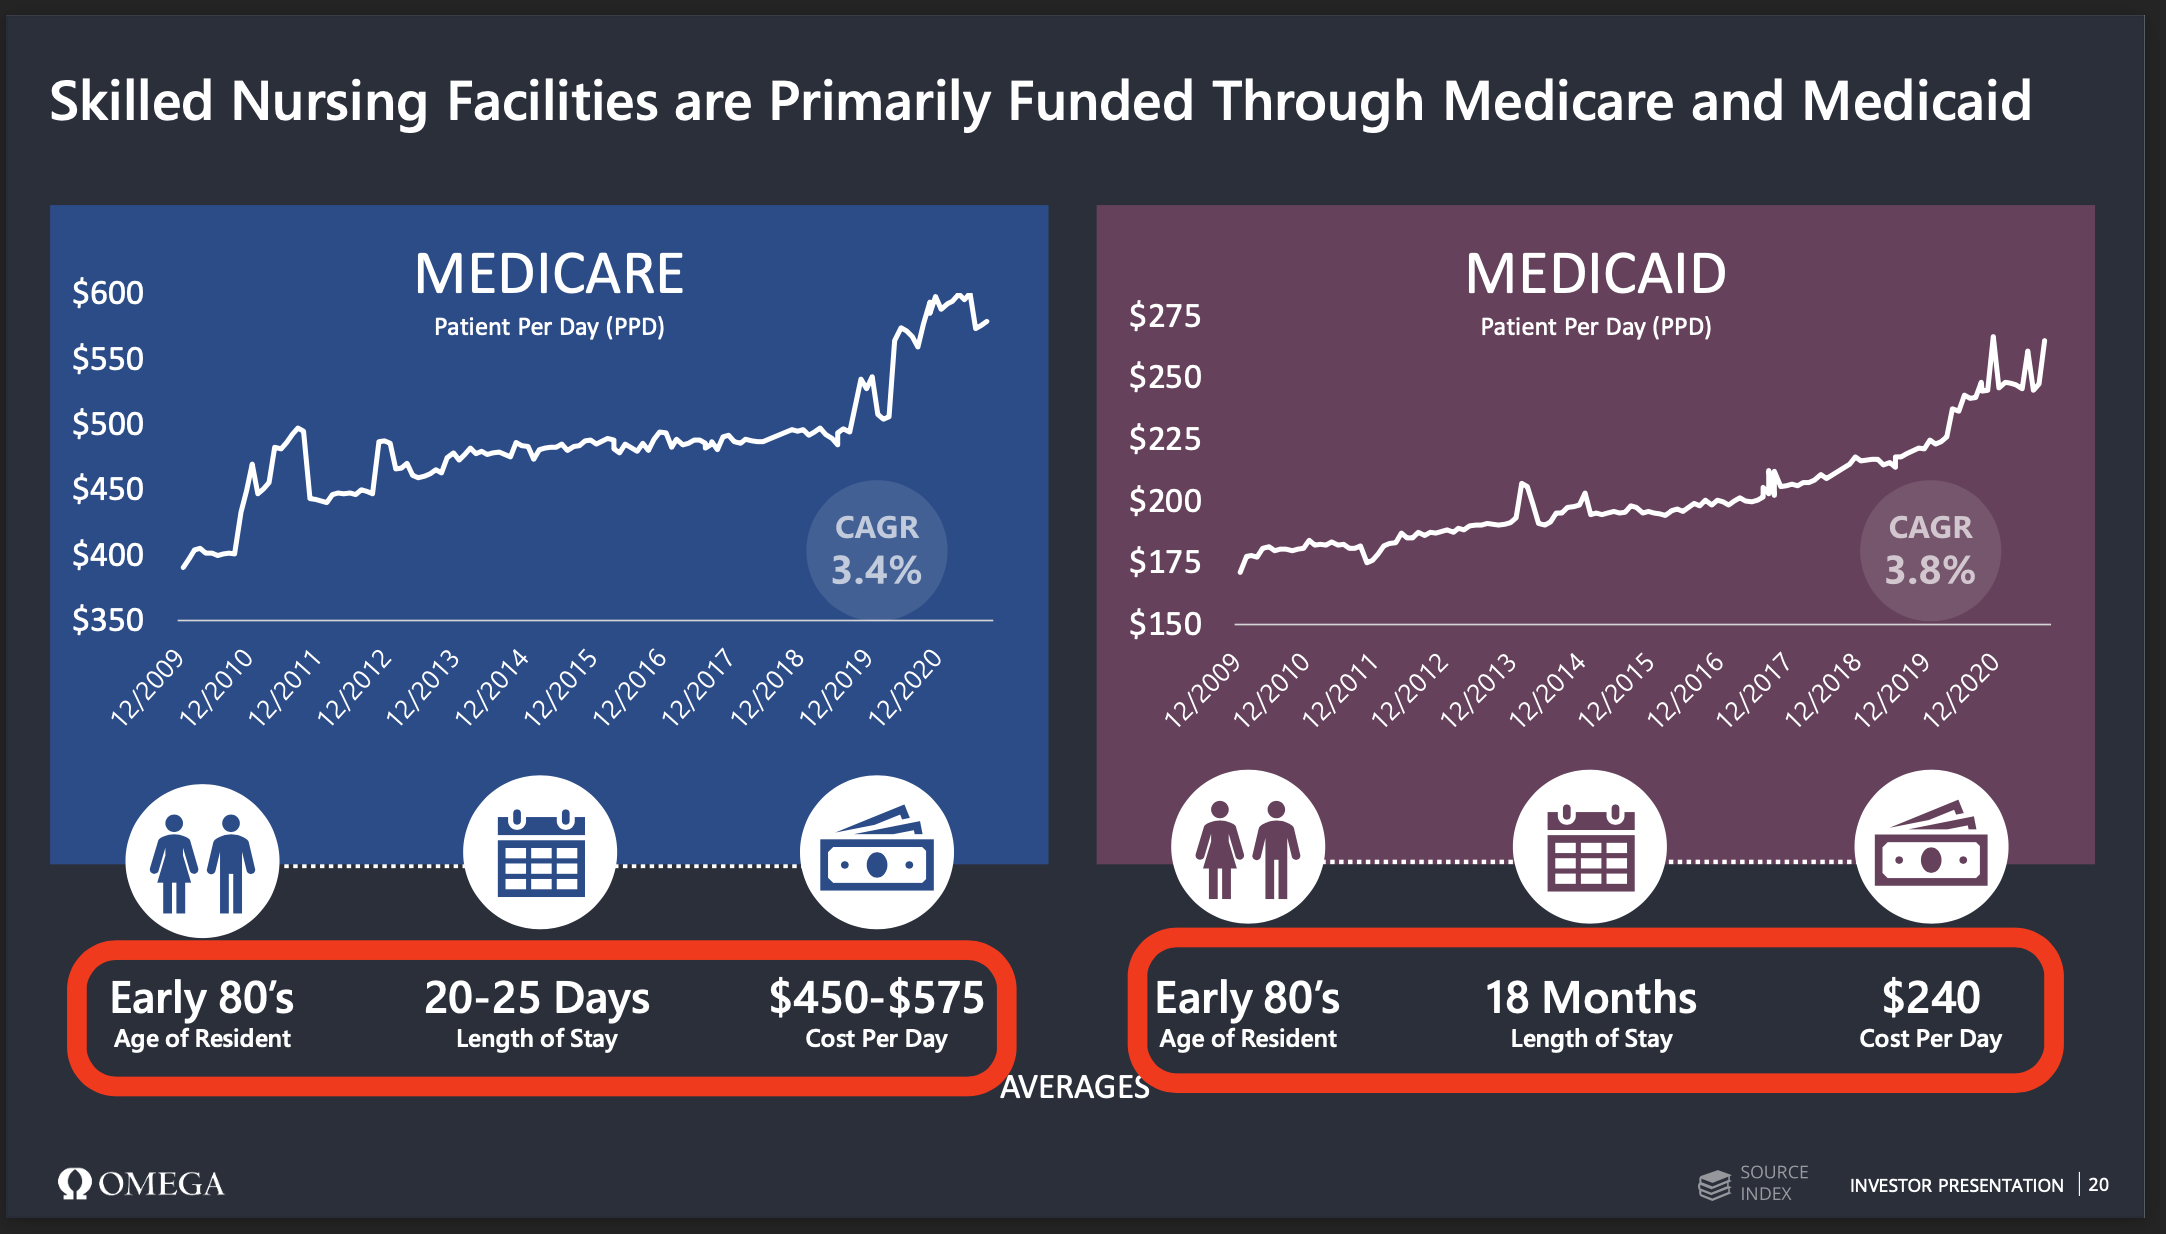

OHI emphasizes that they are the “largest Skilled Nursing Facility focused REIT”.
They own about 940 properties (685 SNFs, 133 Assisted Living Facilities (ALF), 20 Independent Living Facilities, 16 rehabilitation and acute care facilities and two medical office buildings, and hold mortgages on an additional 59 SNFs, 2 ALFs, and 2 specialty facilities) with 96 thousand beds.
These are leased to 63 third-party operators under long term triple-net lease terms. Average occupancy is 74%.
These operators serve over 150,000 Medicare and 80,000 Medicaid patients annually, with 53% of revenue from Medicaid, 14% from Private Pay, and 33% from Medicare. Their average length of stay for Medicare patients is 20-25 days, and for Medicaid patients 18 months. Their revenue per patient-day is $450-575 for Medicare, and $240 for Medicaid.
Seeking Alpha indicates OHI has a current market cap of $6.7 billion (5th largest among Health Care REITs) and a dividend yield of 9.2%. OHI debt is S&P rated BBB-, the lowest investment grade.
Problems with Operators
There have been recurrent problems with operators paying rent. This is neither new, rare, or confined to a few small operators. For example, compare the table of OHI’s largest operators from the 2019 Annual Report, highlighted to note those that appear on the problem operators list detailed below from the 2021 Annual Report:
Chart by Author, Data from OHI Annual Report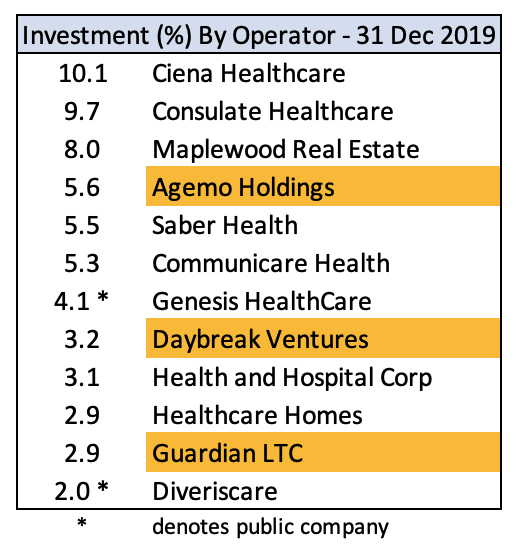
From the 2021 Annual Report:
- In 2021, we terminated the Daybreak Ventures, LLC (“Daybreak”) master lease and fully exited our relationship after transitioning 14 Daybreak facilities to existing operators and selling the four remaining Daybreak facilities.
- In the second quarter of 2021, Gulf Coast stopped paying contractual rent under its master lease agreement for 24 facilities because of on-going liquidity issues.
-
From August 2021 through October 2021 and December 2021, Agemo Holdings, LLC (“Agemo”) failed to pay contractual rent and interest due under their lease and loan agreements
-
From October 2021 through December 2021, Guardian Healthcare (“Guardian”) failed to make contractual rent and interest payments under its lease agreement for 26 operating facilities and on its $112.5 million mortgage loan agreement, bearing interest at 10.81%, for nine facilities, due to ongoing liquidity issues.
- We wrote off straight-line rent receivable balances of $5.9 million… from… four other operators. We determined that collection of substantially all contractual lease payments with these operators was no longer probable.
- In January and February 2022, an operator, representing 3.4% of total revenue (excluded the impact of write-offs) for the year ended December 31, 2021, did not pay its contractual amounts due under its lease agreement.
Problems with operators was a major topic on the Q1 2022 Earnings Call, with several questions about operators with EBTIDAR ratios below 1, who account for 30% of rent, as disclosed in the Supplemental;
OHI Q1 Supplemental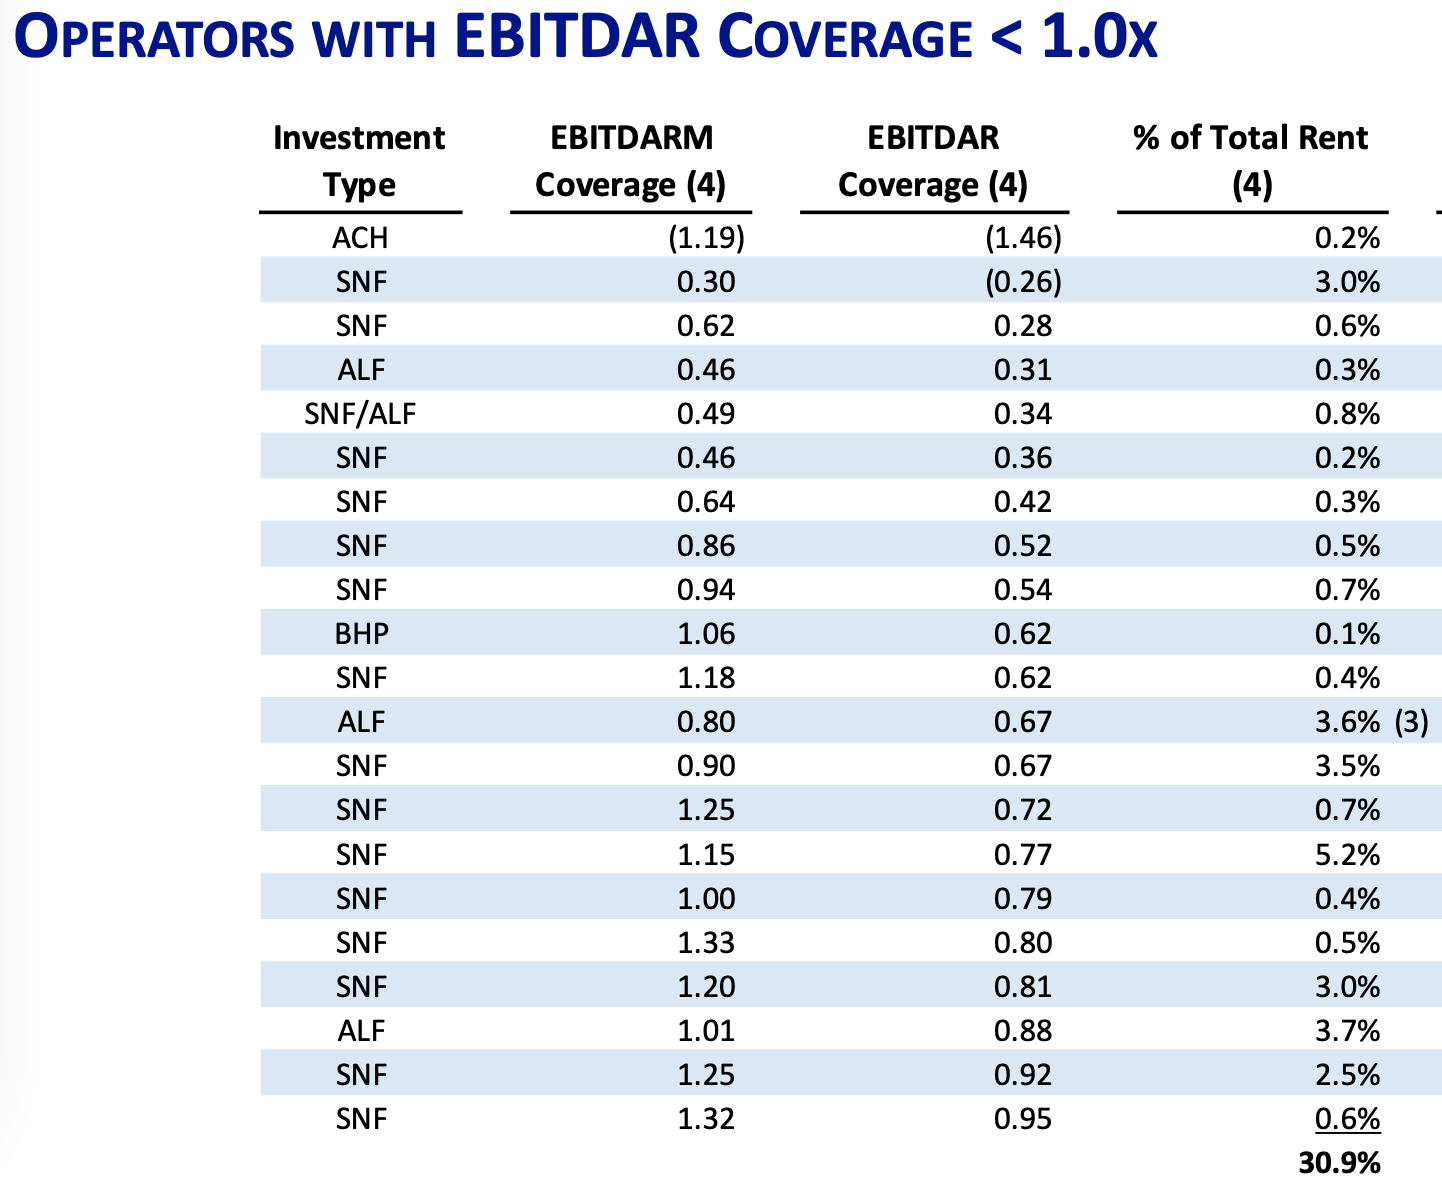
This extended exchange from the Q1 Earnings call goes directly to the point of operator robustness (edited for brevity):
Analyst:
… somebody asked earlier about your optimism on some of these low coverage ratios, … with almost a third of the portfolio below one-time. Again, do you see a path for a lot of these guys to get back to where the rents are? Do you think this is a portfolio that really just about everybody here needs to be restructured …?
OHI
It’s — all — it’s predominantly driven by occupancy recovery. And so if you assume occupancies will recover to pre-pandemic levels at 84%, then the vast majority of those operators climb back out of that under one coverage scenario and we should be in decent shape.
But that’s why there’s so much focus on the velocity of occupancy recovery, and ultimately, who knows what that will be. We feel highly confident that the demographics will eventually drive us there. But is it eight months or 24 months, we don’t know the answer to that yet.
Analyst
… when I look at the coverages and occupancy, do you think this is indicative of the industry overall or do you think your portfolios either outperforming or maybe this experience causing you to kind of re-examine the portfolio in a specific way, like geography [or] other things?
OHI
… it’s hard to compare to the world as a whole. But I would say our portfolio is doing as well, if not better than other portfolios that we see and other operators outside of our world.
Analysis
Let’s recap the situation, and then summarize the bull case and the bear case, and consider what might change.
The SNF business has two market segments, long term care and short term post-acute rehabilitative care. There are four payers – Medicaid, private pay, FFS Medicare, and Medicare Advantage.
SNFs are actually a long term care Medicaid business, measured by either patient-days (~ 65%) or revenue (>50%). The private pay long term care business adds about another 10% to patient-days, at better rates than Medicaid.
Short term rehabilitative care includes FFS Medicare patients, accounting for ~ 11% of patient-days and ~ 20% of revenue, and Medicare Advantage, ~ 8% of patient-days but less profitable.
FFS Medicare patients are the only clearly profitable patients. Overall, the SNF operator business is ~ break-even; this has been the case for years.
OHI’s tenants appear fairly similar to the general SNF business, with 53% of revenue from Medicaid, ~8% from private pay, and 33% from Medicare (FFS and Advantage).
The REITs who own these physical properties are dependent on the success of the operators. However, low margins leave little profit on the table for the operators, sometimes not enough to pay the rent. Leasing to these SNF operators does not look like a very robust or attractive business.
We can summarize the main points of the bull and bear cases.
The Bull Case For OHI
- Demographics – a tsunami of elderly patients will eventually flood SNFs, increasing occupancy and profitability, and particularly the profitable FFS Medicare patient-days.
- It offers a high yield, currently over 9%.
The Bear Case for OHI
- The larger health care REITs have chosen to avoid the SNF business.
- Above average yield, and property cap rates, implies above average risk.
- SNF is, and has been for years, a low margin business for operators.
- A history of significant operator problems, i.e. inability to pay rent.
- While the 80+ population will increase, there are factors at work (e.g. home health care) to divert many of these patients from SNFs.
- THE SNF patient and revenue mix is predominantly long term Medicaid; this will be hard to change.
- SNF operator efficiency will be hard to improve.
- The public REITs with large SNF exposure have only limited ability to further high-grade their current portfolio.
What Might Change The Bear Case
What could change this situation? Some of the possibilities include:
- more patients leading to higher occupancy
- improved payor mix
- improved operator efficiency
- increased reimbursement rates from Medicare and Medicaid
- for a specific REIT, a better portfolio of properties and operators
More Patients
The 80+ population, which reflects the SNF patient age, is increasing by about 4% per year, with some variation by state.
However, as OHI notes, only 20% of FFS Medicare patients are currently discharged from acute care hospitals to SNF. Further, the growing percentage of patients with Medicare Advantage are less likely to be discharged to SNF and to have fewer days per stay than FFS Medicare patients.
Robert Hartman, founder of Symphony Post Acute Network, speaking in 2020 about future baby boomer clients, said:
They will do everything humanly possible not to come into a nursing home
Improved Payor Mix
The operator’s margin is a function of patient and payor mix. A SNF that served only FFS Medicare patients, and maintained 85% occupancy, should certainly be profitable.
However, FFS Medicare patients today fill only about 10% of SNF beds, with Medicare Advantage filling perhaps another 8%. Just to reach 50% combined Medicare beds would require 2-3 times today’s number of short term care patients.
It’s not easy to shift the existing patient mix from long term Medicaid to short term FFS Medicare. It takes 22 FFS Medicare patients, each with average stay of 25 days, to fill the bed occupied by one long term care Medicaid patient with an average stay of 18 months.
Improved Operator Efficiency
Because personnel account for about 65% of costs, it seems unlikely that operators will achieve material efficiency improvements. This is likely to be particularly true for operators already at or above median efficiency; the low hanging fruit has already been harvested.
There are also forces acting to decrease efficiency, e.g. a push for private rather than shared rooms. This 2021 article reports that “two multi-facility licensed skilled care organizations saw an average increase in operating costs ranging from $16 to $25 per patient day and capital costs increased from $20 to $40 per patient day after transitioning to single-resident rooms.”
Increased Reimbursement Rate from Medicare and Medicaid
Medicare and Medicaid fund 85-90% of SNF revenue. It’s admittedly a judgement call, but I expect Federal and State budgetary constraints on Medicare and Medicaid funding are likely to continue, and in fact may increase.
The August 2021 Medicare Trustees Annual Report states that the Medicare trust fund that pays for SNF care is projected to be depleted in 2026, and that under current law the trust fund is not adequately financed.
The only recommendation that MedPAC made in regard to SNFs in their March 2022 report is that for fiscal year 2023, the Congress should reduce the 2022 FFS Medicare base payment rates for skilled nursing facilities by 5 percent.
Indeed, on June 8, 2022, the Medicare Payment Advisory Commission (MedPAC) wrote to Congress noting:
the Commission recommended in its March 2022 report that the Congress reduce the 2022 Medicare base payment rates by 5 percent for FY 2023. The aggregate Medicare margin for freestanding SNFs in 2020 was 16.5 percent, the 21st consecutive year that this margin has exceeded 10 percent.
The high level of Medicare’s payments indicates that a reduction is needed to more closely align aggregate payments to aggregate costs.
Medicaid funding from the States is in direct competition for state budget dollars with education, public employee pension obligations, and all other state expenditures.
My expectation is that the equilibrium point is for funding to be set at the lowest level possible that avoids widespread operator failures, and that while Congress and the States may sustain operations, they will feel no need to set payments at a level that will leave the operators, or their landlords, with any profit.
All in all, it’s hard to see a path that leaves much more on the table for either operators or their landlords.
A Better Portfolio
One might imagine a public REIT creating a boutique portfolio of extraordinary properties and operators drawn solely from the top 20% of their current portfolio, but this reduction in scale seems unlikely.
For the public REITs, their current operators and properties already reflect a decade or more of active portfolio management by highly skilled and experienced management teams.
I think it’s fair to assume that given the REIT’s demand to grow and maintain a large portfolio – hundreds of properties and dozens of operators – they have done as well as is practical. However, that also suggests it will be difficult to do materially better in the future.
Investor Takeaway
OHI has delivered commendable results over the last 10 years, comparable to WELL, the largest health care REIT, and Realty Income (O), the largest triple-net REIT. Per OHI, 84% of OHI’s 10-year return is from dividends.
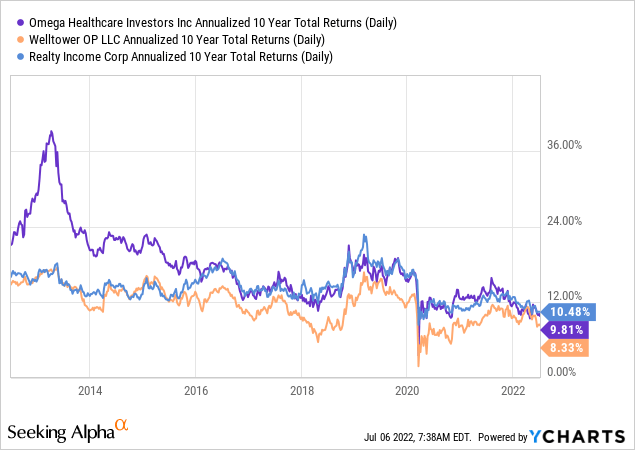
Dividend growth has slowed in recent years, predating COVID effects (there is a glitch in the YCharts data, so the data below is from the OHI website):
Table by Author, Data from OHI website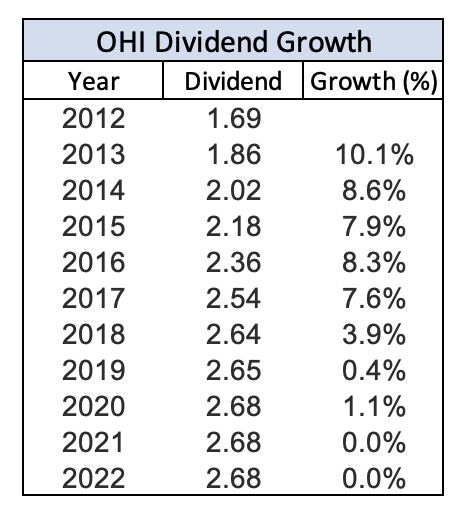
I bought OHI at $33.85 in July 2015, and sold at $32.00 in August 2018, an exception to my usual buy and hold preference. I bought based on an initial enthusiasm for the SNF business, and sold after learning more about the business and concluding my enthusiasm was misplaced. It was, for me, a good lesson in the value of understanding the fundamentals of the business one is buying.
Looking forward, my assessment of the current bull and bear cases have been detailed above. Overall, I find the bear case more compelling, largely reflecting the actual business mix of OHI’s tenants, I view the reward vs. risk as unattractive.
I have no opinion as to whether OHI’s stock price will be higher or lower a year from now. However as a long-term investor with no current position, I choose to avoid the stock. As Seeking Alpha does not offer an Avoid rating, I have rated it Hold.
Be the first to comment