

Gold price started a fresh increase above the $1,950 resistance. Crude oil price could regain traction if it stays above the $105 support zone.
Important Takeaways for Gold and Oil
· Gold price started a fresh increase above $1,930 and $1,950 against the US Dollar.
· There was a break above a key bearish trend line with resistance near $1,932 on the hourly chart of gold.
· Crude oil price also started a fresh increase from the $95 support zone.
· Recently, there was a break below a major bullish trend line with support near $113.30 on the hourly chart of XTI/USD.
Gold Price Technical Analysis
Gold price formed a support base near $1,910 and started a fresh increase against the US Dollar. The price gained pace for a move above the $1,930 level to move into a positive zone.
There was a clear move above the $1,950 level and the 50 hourly simple moving average. The price even climbed above the $1,960 resistance level. Besides, there was a break above a key bearish trend line with resistance near $1,932 on the hourly chart of gold.
A high was formed near $1,965 on FXOpen and the price is now consolidating gains. On the downside, an initial support is near the $1,958 level. The first major support is near the $1,952 level. It is near the 23.6% Fib retracement level of the upward move from the $1,910 swing low to $1,965 high.
The next major support is near the $1,950 level. The main support sits near the $1,938 level. It is near the 50% Fib retracement level of the upward move from the $1,910 swing low to $1,965 high.
On the upside, the price is facing resistance near the $1,965 level. The main resistance is now forming near the $1,980 level. A close above the $1,980 level could open the doors for a steady increase towards $2,000. The next major resistance sits near the $2,030 level.
Oil Price Technical Analysis
Crude oil price started a steady increase from the $93.50 support zone against the US Dollar. The price broke the $105.00 resistance zone to move into a positive zone.
The price even cleared the $112.00 level and settled above the 50 hourly simple moving average. A high was formed near $115.81 and the price started a downside correction. It traded below the $114.00 and $113.50 support levels.
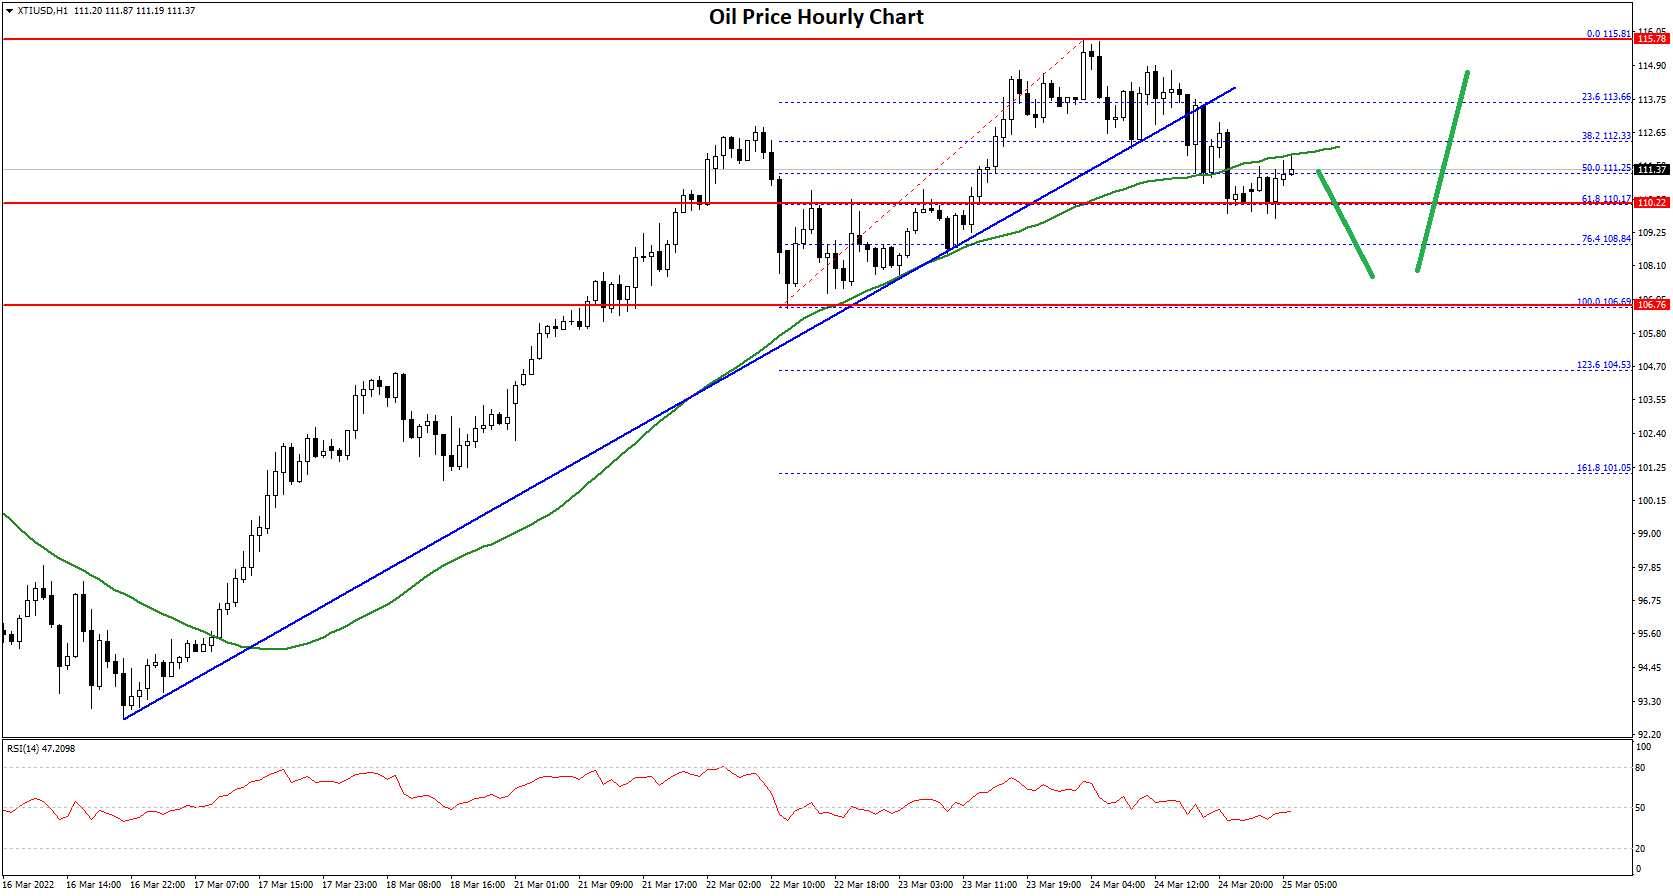
Besides, there was a break below a major bullish trend line with support near $113.30 on the hourly chart of XTI/USD. There was a move below the 50% Fib retracement level of the upward move from the $106.69 swing low to $115.81 high.
The price is now trading below $112.00 and the 50 hourly simple moving average. An immediate support is near the $110.15 level.
The 61.8% Fib retracement level of the upward move from the $106.69 swing low to $115.81 high is also near the $110.20 level. The next major support is near the $108.80 level, below which there is a risk of a larger decline.
In the stated case, the price might slide towards the $105.50 support zone. On the upside, the price is facing resistance near the $112.00 level and the 50 hourly simple moving average.
The next key resistance is near the $113.50 level, above which the price might accelerate higher towards $115.00.

Be the first to comment