

Pgiam/iStock via Getty Images
Investment Thesis
We watch the market-making community of investment professionals applies their large staff of well-educated and business-cycle-experienced worldwide employees to the job of urging share-price evaluations on the wide array of types of competing corporations.
The process is one of continual (24×7) global information-gathering and observing investing participants developing and modifying enthusiasms for prospective gains from creating and satisfying human needs.
The end products are forecasts of likely coming share prices conditioned by judgments of how big, how likely, and how soon profits are to be generated in the limited time spans which may be foreseen.
Substantial progress in technologies, communications, and competitive behaviors in the past few decades has substantially transformed how those forecasts can be made now in this 21st century over what worked in the 20th.
The biggest change is in shortening the time horizons of what can be foreseen reliably enough to warrant risk-bearing valuation estimates. The best effect of that change is that rates of price-change gain are escalated.
But so are rates of loss, so loss controls become more important in portfolio management disciplines. Frequency of evaluation and forecasts should be increased for both advances and defenses.
Again, the MM community fills the needs well because they are updating their forecasts every market day. And as the investing world includes more than US markets, the updates become more continual.
As has become usual, frequency of updates makes VanEck Oil Services ETF (NYSEARCA:OIH) now of interest.
Description of Primary Investment Subject
“The VanEck Oil Services ETF is up a whopping 42% so far this year. That stellar return places it among the best-performing funds in 2022. Obviously, skyrocketing oil prices are a boon to oil service stocks, but what does the balance of this year hold for the cyclical stocks held in OIH? Let’s drill down.
We must first understand what OIH is. According to VanEck, the ETF “tracks as closely as possible, before fees and expenses, the price and yield performance of the MVIS® US Listed Oil Services 25 Index (MVOIHTR), which is intended to track the overall performance of U.S.-listed companies involved in oil services to the upstream oil sector, which include oil equipment, oil services, or oil drilling.”
OIH rebalances quarterly and sports a reasonable expense ratio of 35 basis points. Some of this year’s hottest stocks are found here. Schlumberger (SLB), Halliburton (HAL), and Baker Hughes (BKR) make up about 40% of the fund.”
Source: M. Ziccardi, CFA, Seeking Alpha
Our usual stock analysis at this point tells what the “public investor” (brokerage) segment of the investing information industry thinks is probable as either or both of a one-year share price change or a forecast “trend-line” rate of multi-year value change.
Yahoo Finance, our usual source of such information does this well for single-entity stocks, but quite inadequately for Exchange Traded Funds, ETFs like OIH.. Few, if any, general investment information sources offer future-value forecasts for ETFs.
What some [MOST] do is an inadequate do-it-yourself kit of historical data presumed to represent what has occurred which (in the absence of real forecasts) could be of usefulness out of a sense of inertia.
Figure 1
Yahoo Finance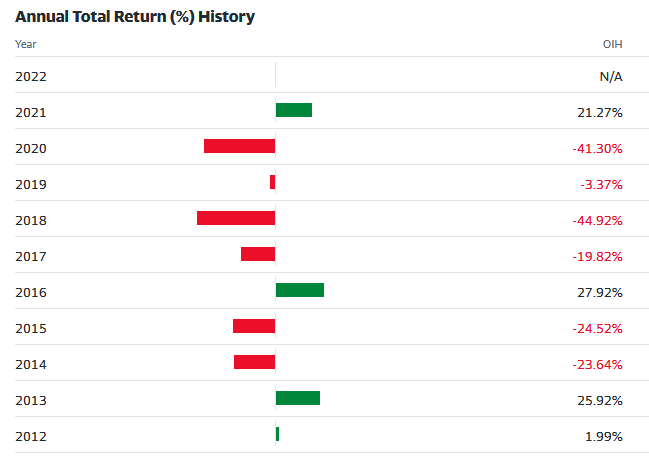
If this seems of little help, then consider the following Figure 2 offer of risk to go along with its above Siamese-twin reward picture.
Figure 2
Yahoo Finance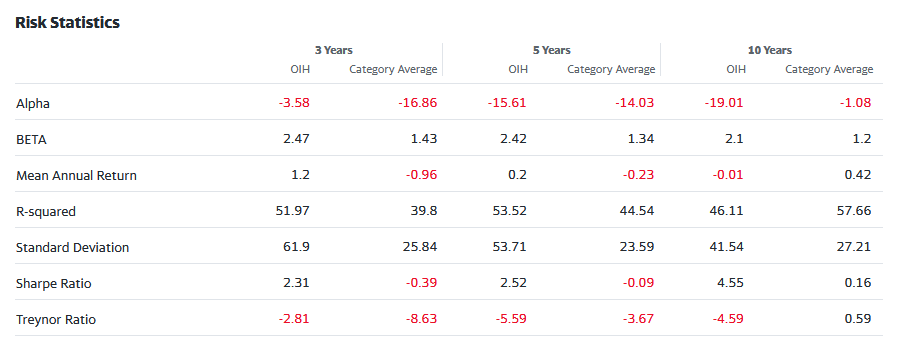
The problem with Figure 2 is its misleading title, because risk is being confused with volatility of return.
What would help in making forecasts of investment positions taken would be a sense of what will appear for each position is the coming likelihood of BOTH risk and reward. Since certainty of either is highly unusual and unlikely, a sense of their balance with one another should be helpful in guiding the portfolio’s growth in value.
The confusion of volatility lies mainly in the acceptance of the statistical term “Standard Deviation” and its use in elegant “risk” measures like those taking the names of Sharpe and Treynor, both of whom I have been associated with.
For a full appreciation of why Volatility confuses Risk, check Investopedia on the internet. The simple statement of the problem is that volatility measures (in one number) both positive and negative differences from an average data point or trend.
For most investors whether positive variances dominate expectations over negative ones should tend to make a difference in selection of positions for an investment portfolio. Variance, standard deviation, and all the data in Figure 2 provide no separation or quantification of either historical or expectations separately of risk and reward.
Figure 1 shows that an ability to emphasize green-years on the right and avoid red-years for investments in FAS would certainly make a difference in that decade’s performance. But little in Figures 1 and 2 offers any realistic hope, despite what academics have hoped to prove for over half a century.
A better approach than trying clumsily to forecast the future from the past is to start with clear, specific price-change forecasts within a set expectation time horizon. Then examine how well those forecasts have done in terms of actual market outcomes within subsequent time-limited periods.
Such score-keeping has the potential to choose at what forecast balance levels between upside and downside expectations there may be a clear advantage to investing or avoiding a specific portfolio candidate. And with similar measures on a wide variety of candidates portfolio performances may be advantaged.
This article illustrates how that can be done among several ETFs constructed to be leveraged-long performers by enclosures of related derivative securities. Their balances between upside and downside current forecast price changes are mapped as trade-off x-y plot locations in Figure 3.
Risk-Reward Tradeoff Balances in Industry-Oriented ETFs
Figure 3
blockdesk.com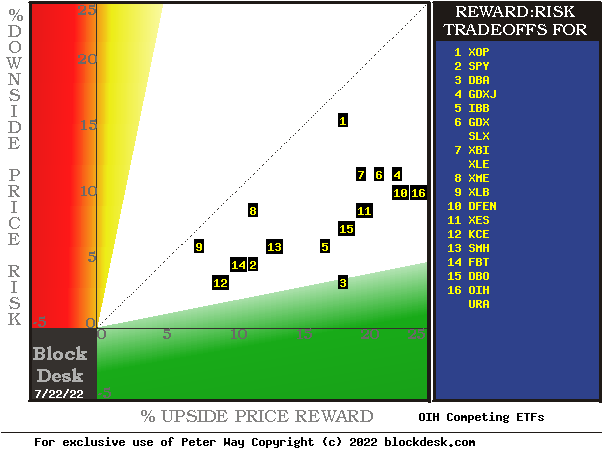
(used with permission)
The risk dimension is of actual price draw-downs at their most extreme point while being held in previous pursuit of upside rewards similar to the ones currently being seen. They are measured on the red vertical scale. Reward expectations are measured on the green horizontal scale.
Both scales are of percent change from zero to 25%. Any stock or ETF whose present risk exposure exceeds its reward prospect will be above the dotted diagonal line. Capital-gain-attractive to-buy issues are in the directions down and to the right.
Our principal interest is in OIH at location [16], up against the right-hand border of this Figure. A “market index” norm of reward~risk tradeoffs is offered by SPY at [2], just to the right of location [14]. Most appealing by this Figure 3 view for wealth-building investors is DBA [3], and Figure 4 should explain why it may not be.
Comparing Competitive Features of Industry-Oriented ETFs
The Figure 3 map provides a good visual comparison of the two most important aspects of every equity investment in the short term. There are other aspects of comparison which this map sometimes does not communicate well, particularly when general market perspectives like those of SPY are involved. Where questions of “how likely’ are present other comparative tables, like Figure 4, may be useful.
Yellow highlighting of the table’s cells emphasizes factors important to securities valuations and the security OIH of most promising of near capital gain as ranked in column [R].
Figure 4
blockdesk.com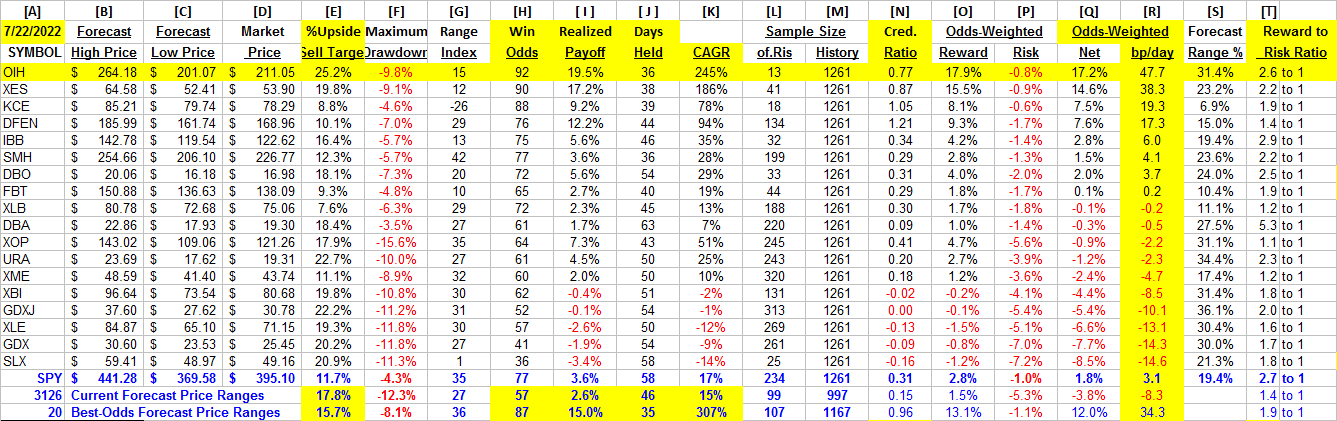
(used with permission)
Why Do All This Math?
Figure 2’s purpose is to attempt universally comparable answers, stock by stock, of a) How big the prospective price gain payoff may be, b) how likely the payoff will be a profitable experience, c) how soon it may happen, and d) what price draw-down risk may be encountered during its active holding period.
Readers familiar with our analysis methods after quick examination of Figure 4 may wish to skip to the next section viewing price range forecast trends for OIH.
Column headers for Figure 2 define investment-choice preference elements for each row stock whose symbol appears at the left in column [A]. The elements are derived or calculated separately for each stock, based on the specifics of its situation and current-day MM price-range forecasts. Data in red numerals are negative, usually undesirable to “long” holding positions. Table cells with yellow fills are of data for the stocks of principal interest and of all issues at the ranking column, [R]. Fills of pink warn of conditions nor constructive to buys.
The price-range forecast limits of columns [B] and [C] get defined by MM hedging actions to protect firm capital required to be put at risk of price changes from volume trade orders placed by big-$ “institutional” clients.
[E] measures potential upside risks for MM short positions created to fill such orders, and reward potentials for the buy-side positions so created. Prior forecasts like the present provide a history of relevant price draw-down risks for buyers. The most severe ones actually encountered are in [F], during holding periods in an effort to reach [E] gains. Those are where buyers are emotionally most likely to accept losses.
The Range Index [G] tells where today’s price lies relative to the MM community’s forecast of upper and lower limits of coming prices. Its numeric is the percentage proportion of the full low to high forecast seen below the current market price.
[H] tells what proportion of the [L] sample of prior like-balance forecasts have earned gains by either having price reach its [B] target or be above its [D] entry cost at the end of a 3-month max-patience holding period limit. [ I ] gives the net gains-losses of those [L] experiences.
What makes OIH most attractive in the group at this point in time is its ability to produce capital gains most consistently at its present operating balance between share price risk and reward at the Range Index [G]. At a RI of 1, today’s price is at the bottom of its forecast range, with all price expectations only to the upside. Not our expectations, but those of Market-Makers acting in support of Institutional Investment organizations build the values of their typical multi-billion-$ portfolios. Credibility of the [E] upside prospect as evidenced in the [I] payoff at +18% is shown in [N].
Further Reward~Risk tradeoffs involve using the [H] odds for gains with the 100 – H loss odds as weights for N-conditioned [E] and for [F], for a combined-return score [Q]. The typical position holding period [J] on [Q] provides a figure of merit [fom] ranking measure [R] useful in portfolio position preferencing. Figure 2 is row-ranked on [R] among alternative candidate securities, with OIH in top rank.
Along with the candidate-specific stocks these selection considerations are provided for the averages of some 3,000 stocks for which MM price-range forecasts are available today, and 20 of the best-ranked (by fom) of those forecasts, as well as the forecast for S&P 500 Index ETF (SPY) as an equity-market proxy.
Current-market index SPY is marginally competitive as an investment alternative. Its Range Index of 35 indicates 2/3rds of its forecast range is to the upside, but little more than three-quarters of previous SPY forecasts at this range index produced profitable outcomes.
As shown in column [T] of figure 2, those levels vary significantly between stocks. What matters is the net gain between investment gains and losses actually achieved following the forecasts, shown in column [I]. The Win Odds of [H] tells what proportion of the Sample RIs of each stock were profitable. Odds below 80% often have proven to lack reliability.
Recent Forecast Trends of the Primary Subject
Figure 5
blockdesk.com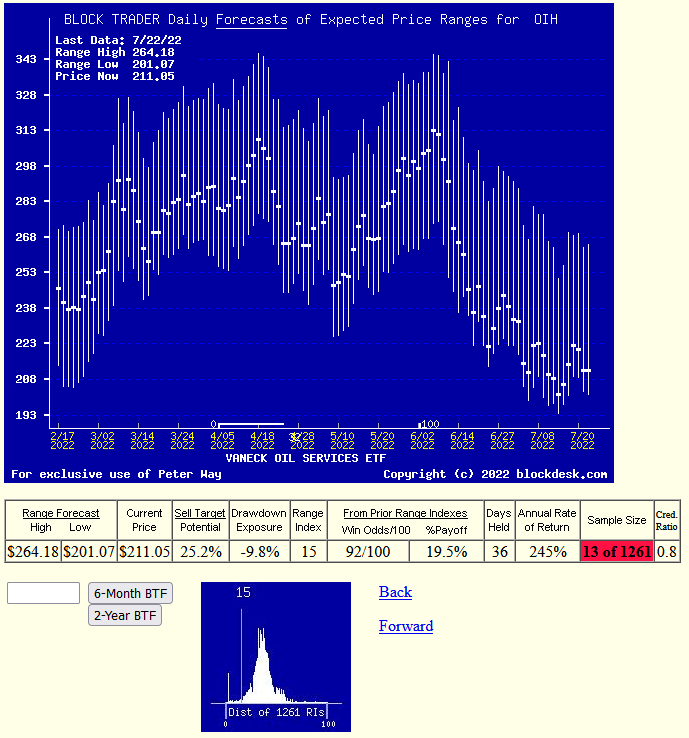
(used with permission)
OIH has fallen in price to where hedging actions show that coming-price expectations may resist further declines, with a Range Index value of 15.
Past experiences at this level have produced profitable position outcomes in 10 out of every 11 opportunities, winners 92% of the time. The small image showing the frequency of RIs makes it clear that far more of the past 5 years of daily forecasts have been at higher price and price expectation levels.
Current comparison with other ETFs ranks OIH at the top of the list of such alternative investment prospect candidates.
Conclusion
VanEck Oil Services ETF currently appears to be the best ETF competitor choice of investors desiring near-term capital gain wealth-builders.
Be the first to comment