


Leon Neal/Getty Images News
If everybody indexed, the only word you could use is chaos, catastrophe… the markets would fail.
– John Bogle, May 2017
Try to buy assets at a discount rather than earnings. Earnings can change dramatically in a short time. Usually, assets change slowly. One has to know much more about a company if one buys earnings.
– Walter Schloss
Introduction
Watching the after hours price action of Amazon (AMZN) shares last night, when the stock fell over 20% due to lowered guidance, my mind drifted to the ongoing historical capital rotation from growth to value, from loved to unloved, with the latest move in this ratio occurring from the most ballyhooed stocks getting pummeled.
On that note, earlier this week, we saw Meta Platforms (META) fall 25% post their third quarter earnings, and both Alphabet (GOOGL), (GOOG), and Microsoft (MSFT) shares fell sharply too after their respective third quarter earnings results.
As a contrarian, value-oriented investor, the sheer magnitude of the drop in Meta Platform shares, which are down a staggering 70.9% year-to-date in 2022 alone, certainly gets my research interest flowing.
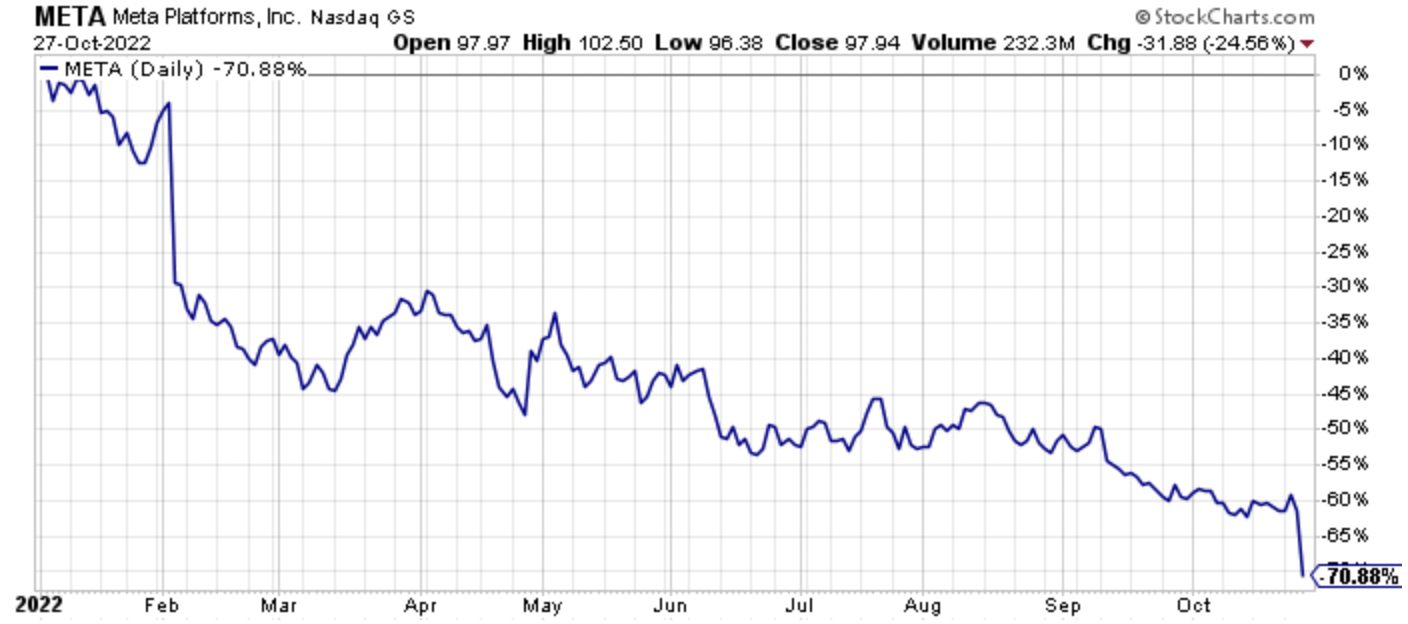
META YTD Stock Price Performance (Author, StockCharts)
Looking back, this may be the start of a buying opportunity, specifically in META, which I will go into more detail later in a future, different article. Having said that, technology stocks are far from cheap on a relative basis as the following Bank of America (BAC) graphic illustrates, comparing technology stocks to the broader S&P 500 Index (SP500).
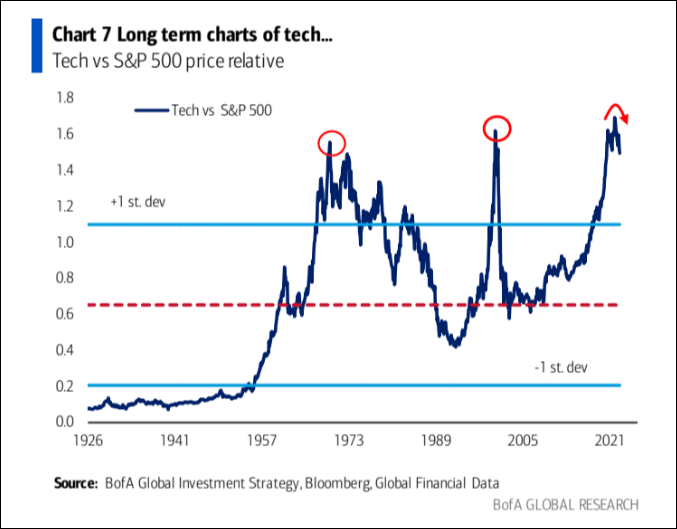
Technology Stocks Still Historically Overvalued (Bank of America)
Investors looking to buy the dip in technology stocks have to look at the chart above, and at least take a pause, at a minimum. Speaking from the experience of someone who has been too early buying a value trap previously, secular bear markets can be drawn out affairs, with Microsoft’s price action from 2000-2009 being a prime example, where the largest market capitalization company went through an extended bear market despite generally robust growth.
Conversely, energy equities remain remarkably cheap, with price to earnings ratios well below the broader market.
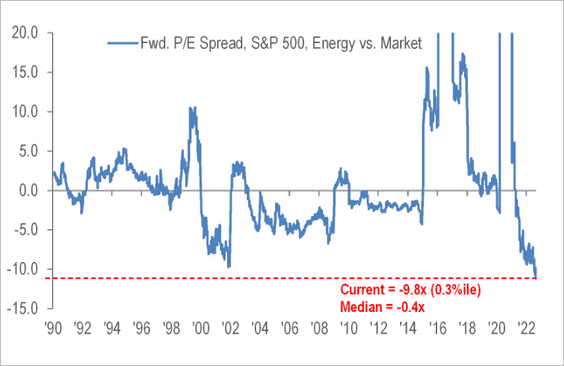
Energy Equities Selling For Discounted Price-To-Earnings Ratios (Daily Shot)
Thus, remarkably, after almost three years of significant cumulative outperformance, the more prominent contrarian opportunity may still be in energy equities, and not in the newly discounted technology leaders, which still have further room to see their relative valuation multiples compress. Said another way, buy the dip, just not in the sectors that investors usually apply that approach.
Energy Equities Have Outperformed Significantly In 2022
Energy equities have outperformed significantly year-to-date in 2022, with the Energy Select Sector SPDR Fund (XLE) up 65.4% year-to-date in 2022, which is a significant percentage gain from their 45.3% gain for XLE through April 15th, 2022, which was the last entry in this article series. The last update was actually published on April 15th, 2022, but the percentage gains were through the close of April 14th, 2022.
The very strong absolute performance of XLE YTD compares very favorably to a 19.1% YTD decline in the SPDR S&P 500 ETF (SPY), which was down 7.5% as of April 14th, a 31.1% YTD decline in the Invesco QQQ Trust (QQQ), which was down 14.8% through April 14th, a 33.2% YTD decline in the iShares 20+Year Treasury ETF (TLT), which was down 18.2% through April 14th, and a 60.0% YTD decline in the ARK Innovation ETF (ARKK), which was down 37.6% through April 14th, 2022.
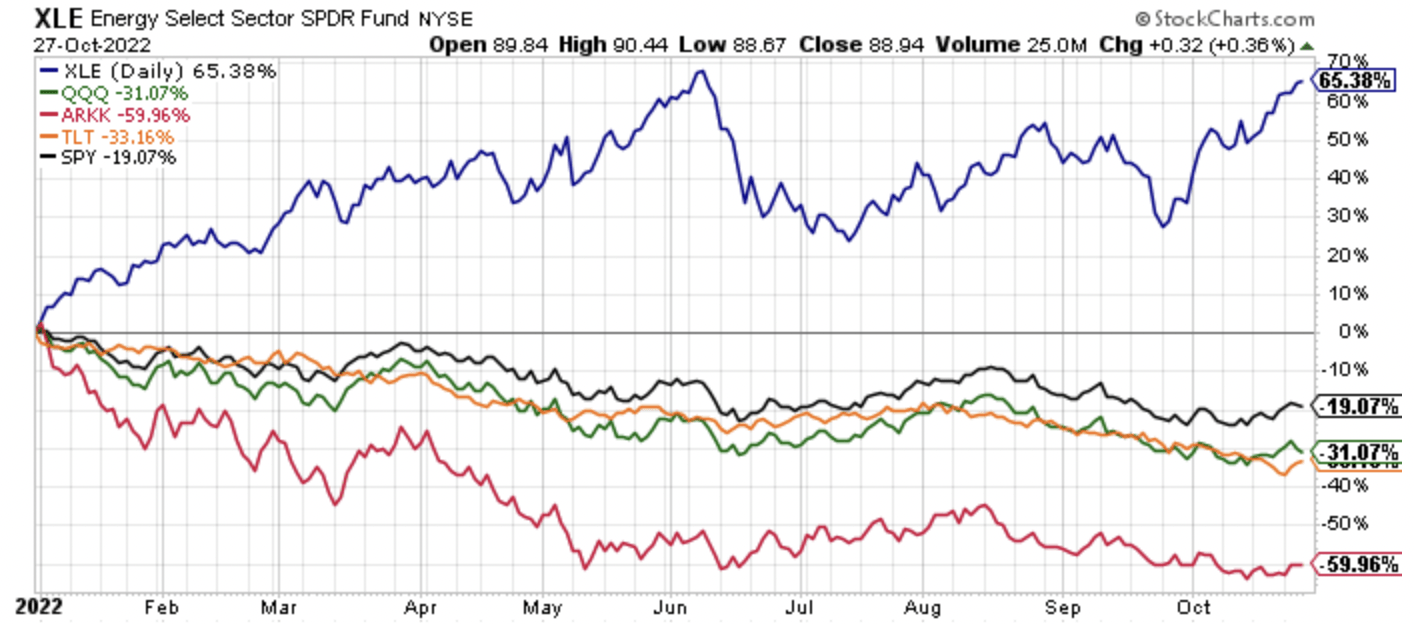
XLE SPY QQQ ARKK TLT 2022 YTD Performance (Author, StockCharts)
Growth stocks, led by the momentum growth favorites that dominate ARKK, have been severely impaired, held back by their poor starting valuations, something I wrote about in detail on August 10th, 2021, with the article titled, “ARKK Implosion Is On The Horizon.” Since that article was published, ARKK shares are down an eye opening 68.8%, which is a further loss from the 51.2% decline in the April 2022 update. For a comparative basis, the S&P 500 Index is down 14.2% (it was down 1% on April 14th, 2022 from the original article’s publication for perspective), as illustrated in the image below.
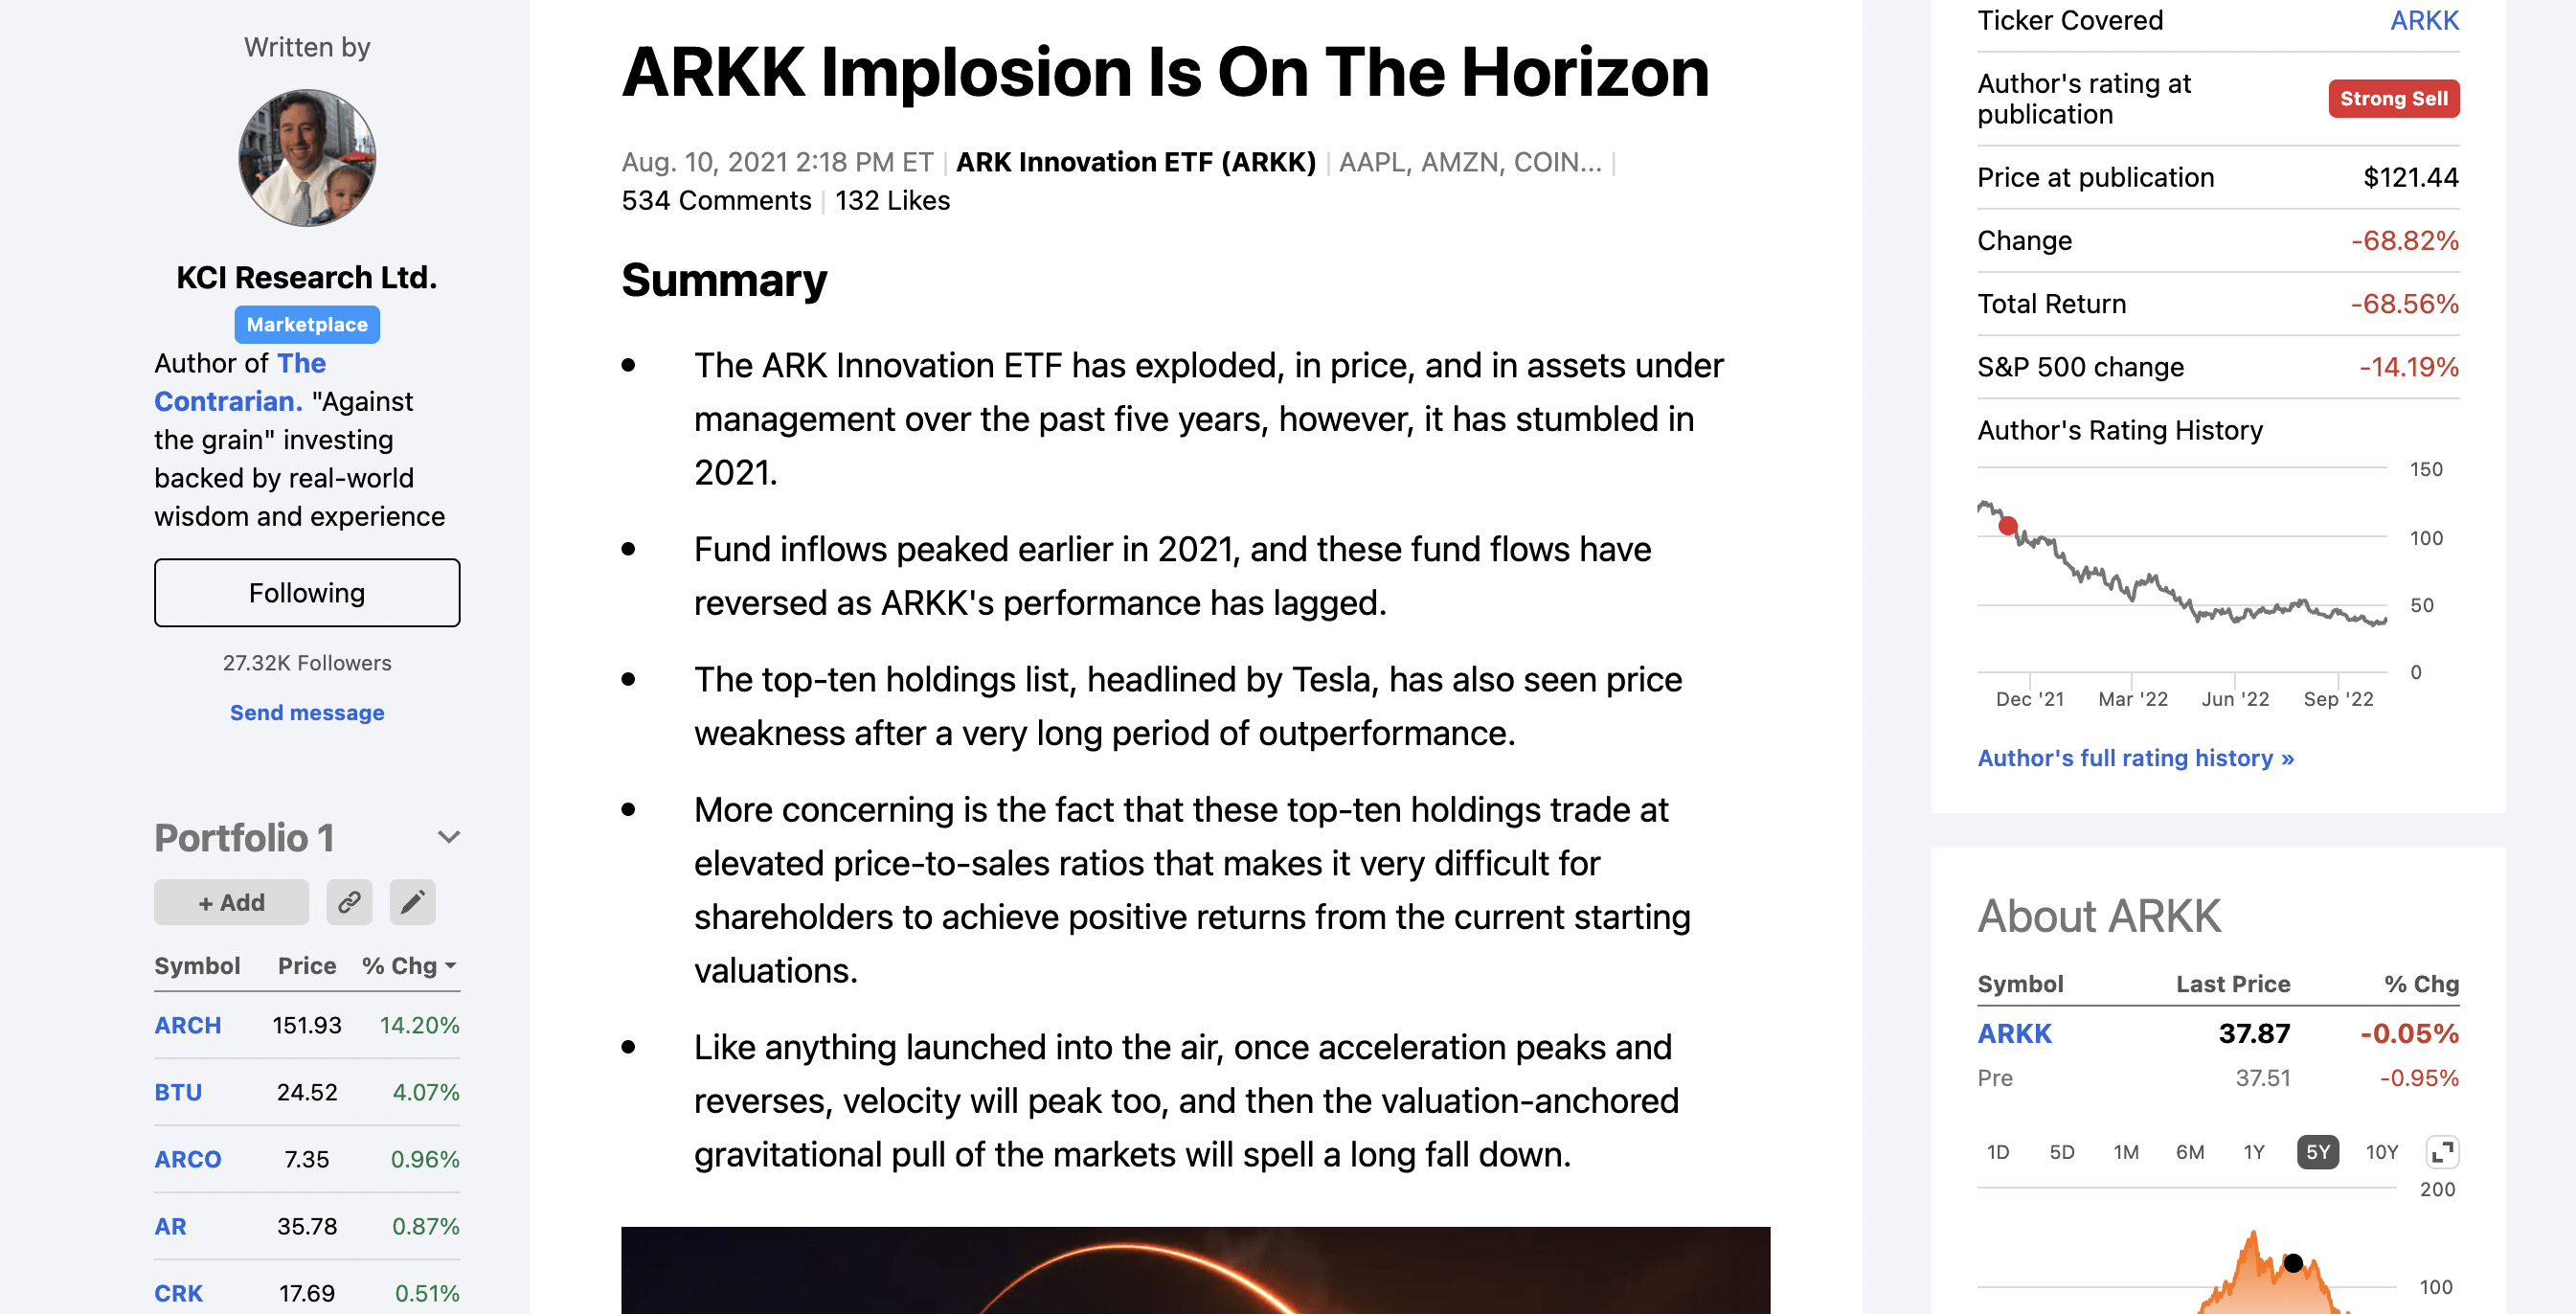
Snapshot Of Author’s August 10th, 2021 Article On ARKK (Author, Seeking Alpha)
With the benefit of hindsight, obviously, growth stocks have really struggled in 2022, and really since ARKK peaked in February of 2021. This has occurred as rising interest rates across the yield curve, but particularly at the longer end of the yield curve, reduce the appeal of the longest duration assets.
A Historical Capital Rotation Is In Progress, Exemplified By Exxon Mobil Versus Salesforce.com
On the opposite side of the ledger, high free cash flow yielding companies are being rewarded, and many of these free cash flow standouts reside in the commodity equity sector, particularly in the energy sector. Taken together, meaning the downturn in technology stocks, and the surge in out-of-favor commodity equities, a historical capital rotation is underway.
This historic capital rotation is something I have chronicled on a regular basis, documenting the flow of money from the “Haves” to the “Have Nots.” These public articles below reference this historical capital rotation.
Pounding in this narrative of a historic capital rotation playing out in front of our eyes as investors hidden in plain sight, with this public article, I outlined how removing Exxon Mobil (XOM) from the Dow Jones Industrial Average (DIA) and replacing the venerable, longest listed Dow Jones component with Salesforce.com (CRM) in August of 2020 would turn out to be a high water marker for the current state of the financial markets.
The share price performance of Exxon and Salesforce.com shares since that removal date says everything that you need to know about the financial markets since August 2020, with the SPDR S&P 500 ETF (SPY) performance, shown in black below, as the reference point. More specifically, XOM shares are up 196.4%, before today’s anticipated gains after Exxon’s strong third quarter 2022 earnings results, and CRM shares are down 41.1%.
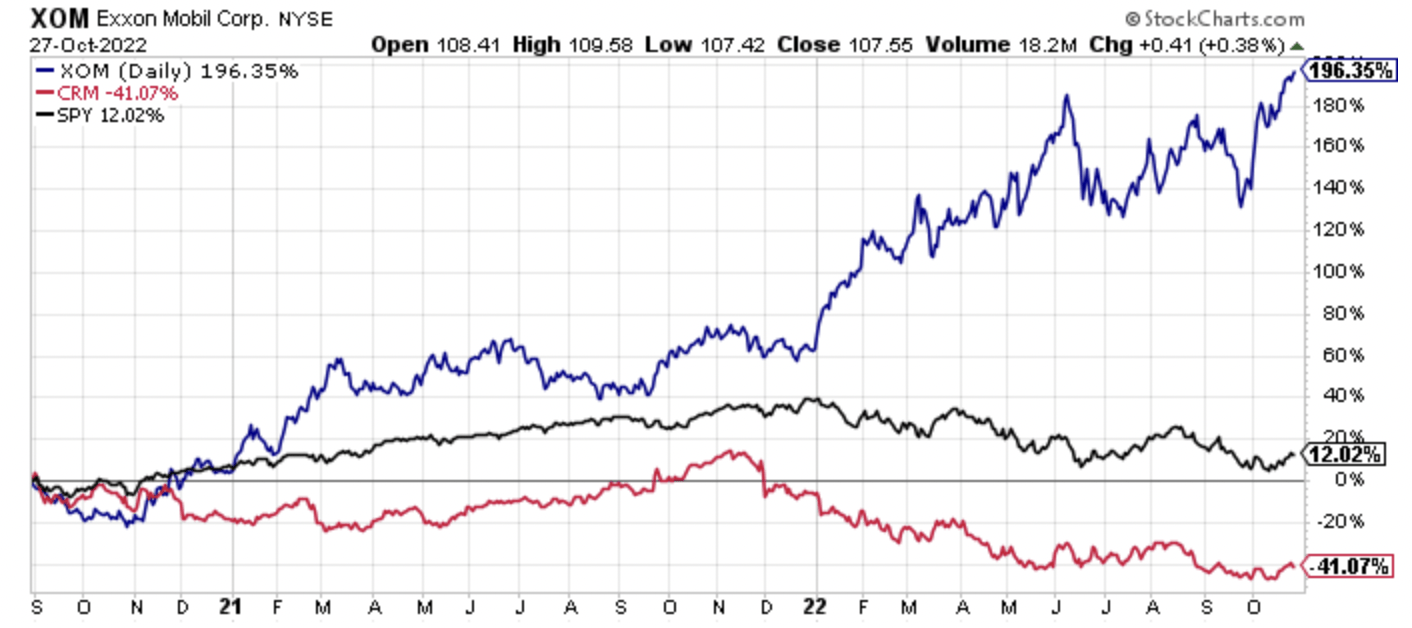
XOM Performance Through October 27th Versus CRM Since Exxon Was Replaced By Salesforce.com In The DJIA (Author, StockCharts)
Going further, to show the steady progression of the historical capital rotation, here is the same chart from the April 15th article in this series.
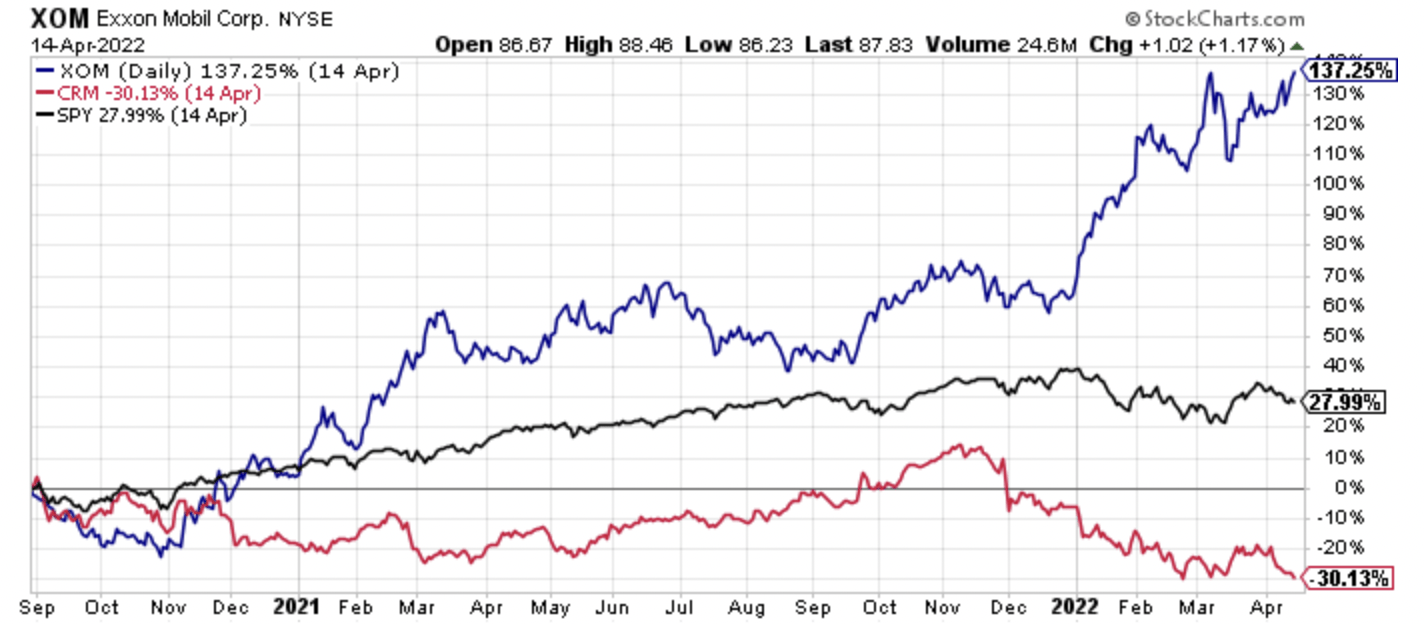
XOM Performance Through April 14th Versus CRM Since Exxon Was Replaced By Salesforce.com In The DJIA (Author, StockCharts)
Let’s not forget that the active decision makers at S&P Global (SPGI) removed Exxon and added Salesforce.com because they thought that Salesforce.com was more representative of the future of the market. This happened even though the economic impact of Exxon Mobil was far greater at the time of the switch, and that gap has increased today as Exxon’s revenues, net income, and free cash flows have surged with higher energy prices.
With the benefit of hindsight, almost all market participants were crowded on one side of the boat in 2020 and early 2021, overweighting technology shares, and underweighting the left behind value stocks, particularly the downtrodden commodity equities, and more specifically the energy equities.
RACES Stocks Lead The Way
The best example of this seismic shift in the investment landscape has been in the performance of natural gas equities, which I affectionately coined with the term RACES, which is the first letter of each of the equities highlighted in more detail below. More specifically, these equities are Range Resources (RRC), Antero Resources (AR), CNX Resources (CNX), EQT Corp. (EQT) and Southwestern Energy (SWN). The “C” in RACES by the way, could be Coterra Energy (CTRA), which was formerly Cabot Oil & Gas before their merger with Cimarex, Chesapeake Energy (CHK), or Comstock Resources (CRK), so chose your “C” as you see fit.
Collectively, as you will see further down in this article, these natural gas equities which have trounced their vaunted FAANG peers in performance terms, across a range of time frames dating to January 1st, 2020, as I will illustrate below, which is an updated fifth edition to my February 3rd, 2021 article, “Off To The RACES: Natural Gas Equities Lapping FAANG Stocks, the May 26th, 2021 follow-up, the September 10th, 2021 third edition, and the April 15ht, 2022 fourth edition.
Off To The RACES Stocks Are Significantly Outperforming
The following performance chart shows the total return of Range Resources, Antero Resources, CNX Resources, EQT Corp., Southwestern Energy, and the SPDR S&P 500 ETF from January 1st, 2020 through Thursday, April 14th, 2022.
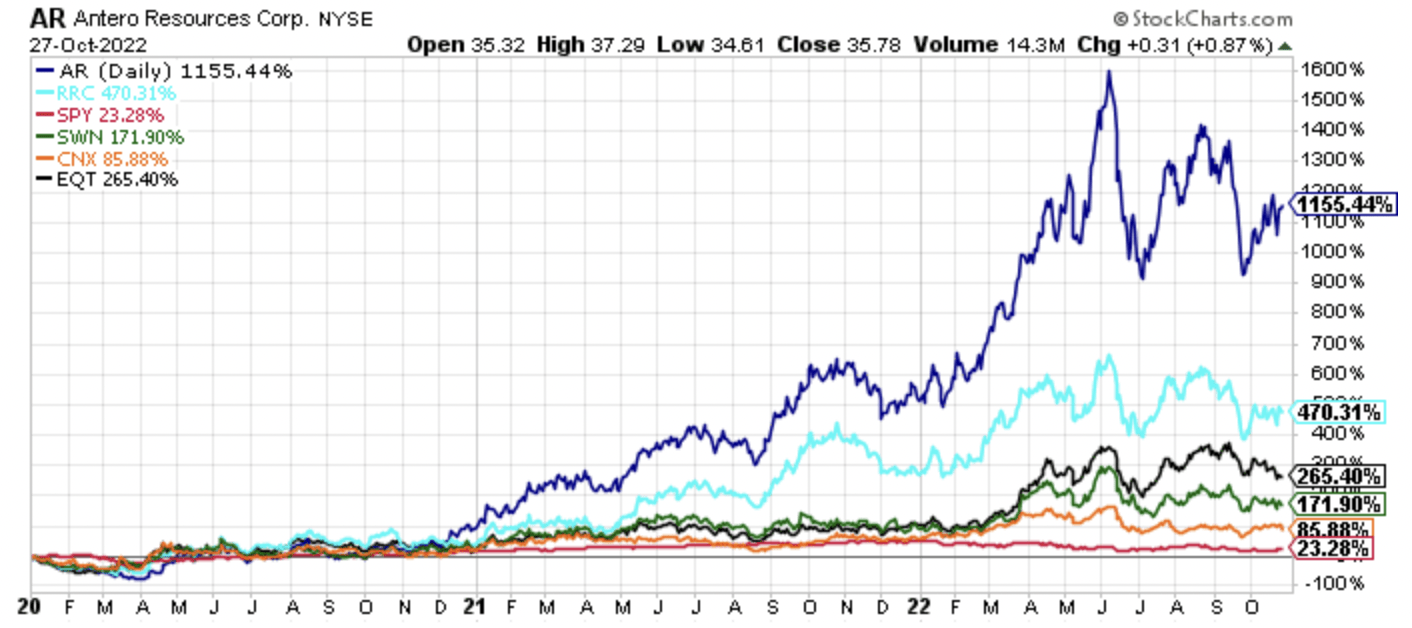
AR RRC EQT SWN CNX SPY Performance Chart Through October 27th Since January 1st, 2020 (Author, StockCharts)
Looking at the same performance chart below from the April 15th prior update in this series, with performance through April 14th, 2022, offers some clues. More specifically, Antero has appreciated slightly, while Range Resources, EQT Corp, Southwestern Energy, and CNX Resources have pulled back.
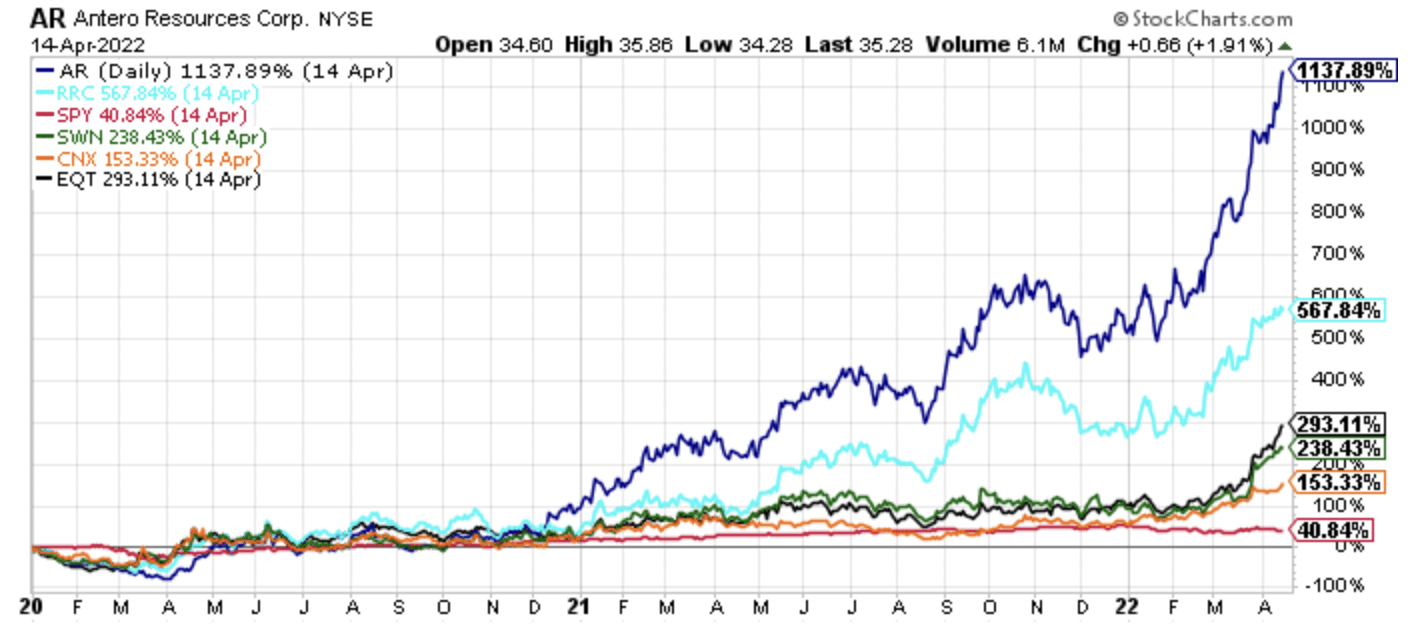
AR RRC EQT SWN CNX SPY Performance Chart Through October 27th Since January 1st, 2020. (Author, StockCharts)
Circling back to the first chart, Antero Resources shares continue to lead the pack, delivering on what I correctly thought was a generational buying opportunity in the spring of 2020, higher by 1155.4% since the start of 2020.
For perspective, in the last article in this series published on April 15th, 2022, AR shares were higher by 1137.9%, as shown in the chart above. Prior to that, in the article published on September 10th, 2021, AR shares were higher by 462.2% from January 1st, 2020 through Thursday, September 9th, 2021.
Range Resources is next in line, with a total return of 470.3% since January 1st, 2020, down from the 567.8% returns in the last update, followed by EQT Corp., whose shares have gained 265.4%, also down from their 293.1% gain in the prior update. Southwestern Energy shares have gained a cumulative 171.9%, down from their 238.4% in the April 2022 update, and CNX Resources shares have gained 85.9% since the start of January of 2020, down from their 153.3% gain in the prior update in April.
Even with the recent pullback outside of Antero Resources, all of these natural gas equities have significantly outperformed the SPDR S&P 500 Index ETF, which has now gained 23.3% year-to-date, which is down from the 40.8% gain SPY posted since January 1st of 2020 in the prior update as the broader equity market has trended lower.
Collectively, through October 27th, 2022, the “Off To The RACES” stocks have an average return of 429.8% since January 1st of 2020. This is down moderately from the 478.1% average return posted in the April 2022 update, and this simple average return is up significantly from the 190.4% average return from the September 2021 update, and the 152.6% average return since January 1st of 2020 published in the May 26th, 2021 article.
Looking back to the first article in the series, the average return of 429.8% is up significantly from the average return of 80.4% from January 1st, 2020 through February 2nd, 2021. This might surprise many investors who have cast aside energy equities to the dustbin of history, yet these cast aside energy equities are significantly outperforming.
FAANG Is Crushed
What are the returns of the FAANG stocks over this time frame since January 1st, of 2020? By the way, I know Meta Platforms is no longer Facebook, however, when I started this series it was still Facebook, so we will stick with the FAANG acronym.
The chart below illustrates this succinctly.
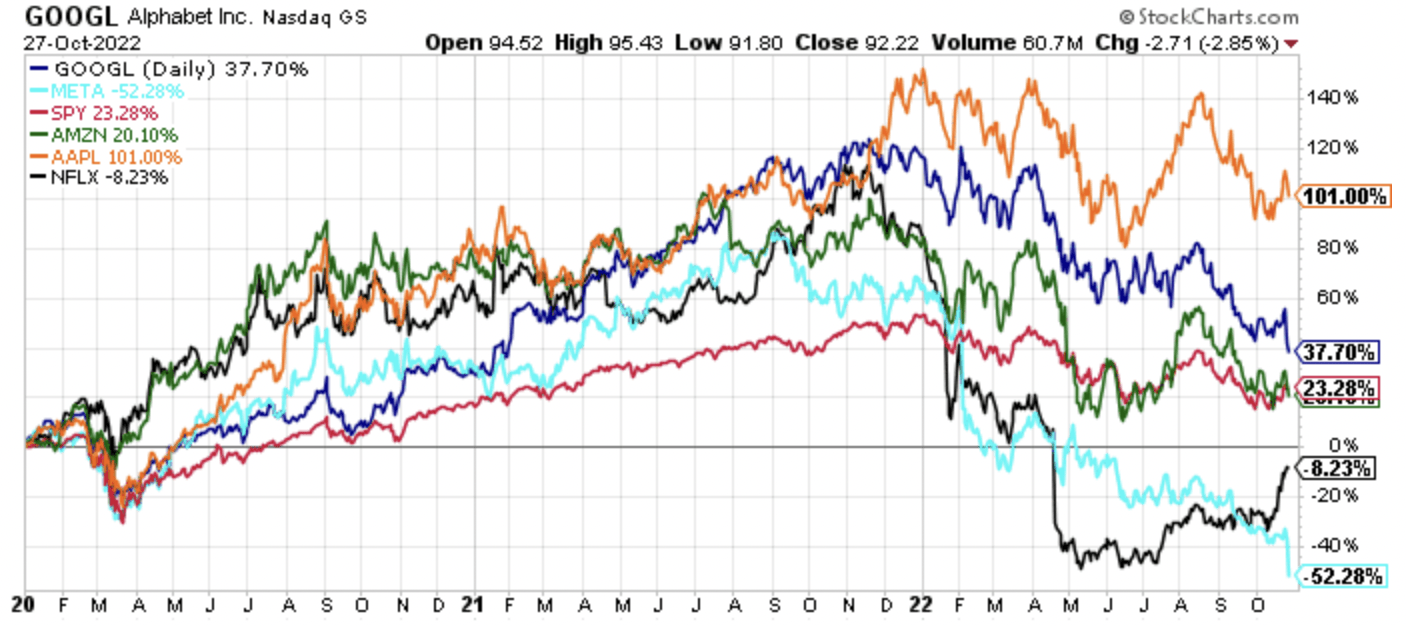
GOOG META SPY AMZN AAPL NFLX January 1st, 2020 Through October 27th, 2022 (Author, StockCharts)
Standing out like a sore thumb among its peers, or what I like to call the last shoe to drop, Apple (AAPL) shares are higher by 101.00 year-to-date. For perspective, looking at the chart in the last April 2022 update, even Apple shares are lower, down from their 128.8% gain shown below, however, the drops have been more severe elsewhere in this technology leading quintet.
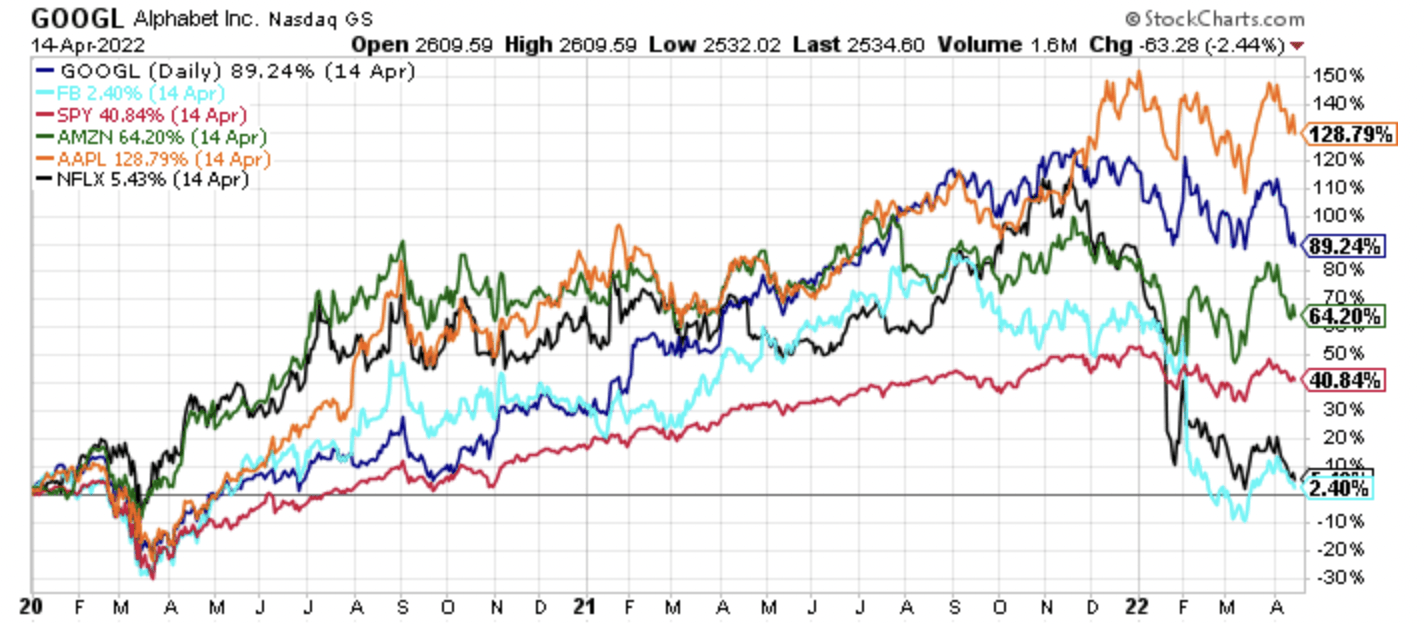
GOOG META SPY AMZN AAPL NFLX January 1st, 2020 Through April 14th, 2022 (Author, StockCharts)
Alphabet shares have declined sharply from the April 2022 update in this series, now up only 37.7% since January 1st of 2020, a large deterioration from their 89.2% gain in the last update. Similarly, before today’s large earnings induced price drop, Amazon shares are now up 20.1% year-to-date since January 1st, 2020 versus a prior 64.2% gain in the last update.
Netflix (NFLX) shares had already cratered prior to the April 2022 update, and they declined further, now registering a 8.2% loss since January 1st, 2020, after previously posting a 5.4% gain in the last update.
The real albatross on the FAANG quintet, which really has become an outdated acronym since Facebook changed their name to Meta Platforms, is Meta Platforms. As touched upon in the introduction, shares of META are off 70.9% year-to-date in 2022, with a sharp decline this past week. This has dragged the performance of META shares to a negative 52.3% since January 1st, 2020, which was down from a gain of 2.4% in the April 2022 update, and down from a gain of 84.2% in the September update in this series.
Taken all together, the new average return of the FAANG stocks since January 1st, 2020 is now a paltry 19.7% on average, even with the outlier of Apple shares, thus far. This 19.7% average return is less that the 23.3% return in the SPDR S&P 500 ETF over this timeframe. Additionally, this is a sharp decline from the April 2022 average return of 58.0%, which itself was a decline from 96.9% in the September 10th, 2021 update in this series.
Bottom line, the “Off To The RACES” stocks have delivered an 429.8% average gain since the start of 2020 through October 27th, 2022, down moderately from the 478.1% average gain posted in the April 15th, 2022 update, yet significantly ahead of the FAANG average return of 19.7%. FAANG stocks have been crushed, with the 19.7% average return from January 1st, 2020 down significantly from the 58.0% average return that FAANG stocks delivered in the prior update through April 14th, 2022. That return was down from the 96.9% average gain from the September 10th, 2021 update for the FAANG equities. The return gap did not widen with this update, like it has in the past, however, it did not shrink much as FAANG declines offset some weakness in natural gas, and natural gas equities.
A Long Time In Development and The Start Of A Longer-Term Opportunity
Researching, chronicling, and tracking the opportunity in one of the most out-of-favor corners of the market has been a time-consuming initiative over the last couple of years, though it has proved worthwhile in terms of relative and absolute opportunity.
The following partial list of public articles chronicles my thought process on the targeted natural gas equities, including Antero Midstream (AM), and the broader developing opportunity in commodity equities over the past year.
- “Southwestern Energy: A Misunderstood Natural Gas Producer” – Published December 13th, 2019
- “Range Resources Continues Capex Cuts, Validates Appalachia Advantage” – Published January 8th, 2020
- “Antero Resources Is A Generational Buy: Dispelling The Myth Of Antero As High-Cost Producer” – Published February 19th, 2020
- “Antero Midstream Shares Are Significantly Undervalued Too” – Published February, 20th, 2020
- “The Long Oil, Short Natural Gas Trade Is Officially Dead” – Published March 9th, 2020
- “The United States Natural Gas Fund Was Up On A Historic Down Day For Energy” – Published March 10th, 2020
- “EQT Corp. Surges As The Bearish Natural Gas Thesis Is Dead” – Published March 17th, 2020
- “EQT Leading The Forthcoming Move Higher In Natural Gas Prices” – Published July 24th, 2020
- “Antero Resources Is A Generational Buy: Working Through The Near-Term Debt Maturities” – Published July 19th, 2020
- “Antero Midstream Has Outperformed All Other Midstream Firms Year-To-Date” – Published July 29th, 2020
- “Antero Resources Is A Generational Buy: Mapping Out The Free Cash Flow” – Published October 28th, 2020
- “Antero Resources Leading The Way In A Historic Energy Equity Rally” – Published December 11th, 2020
- “Not All Energy Stocks Are Created Equal” – Published December 24th, 2020
- “Antero Resources: Buy The Forgivable Dip” – Published August 2nd, 2021
- “EQT Corp.: Buy The Forgivable Dip At A 20% Free Cash Flow Yield” – Published August 4th, 2021
- “U.S. Steel: A Breakout Stock For 2022” – Published January 26th, 2022
- “Peabody Energy: A Breakout Stock For 2022” – Published January 28th, 2022
If you read through the articles above that chronicle this journey, there was pessimism and skepticism in the commentary sections, especially in the beginning.
This skepticism and pessimism was evident publicly, and privately, where many struggled to embrace such a poor performing group of stocks. In my contrarian mindset, the continued pessimism and skepticism, which still exists today to an extent, think Cathie Wood of ARK Innovation ETF fame calling for a commodity crash in the second half of 2021, and subsequently doubling and tripling down on this call. This is a call I have vehemently disagreed with, and the boldness of investors that have gotten it completely wrong confirms that we’re still in the early innings of this opportunity in natural gas equities, commodities, and commodity equities.
On that note, if you look at the relative performance chart of a broad based index of commodities vs. the SPDR S&P 500 ETF, the size and scale of the relative opportunity quickly become apparent.
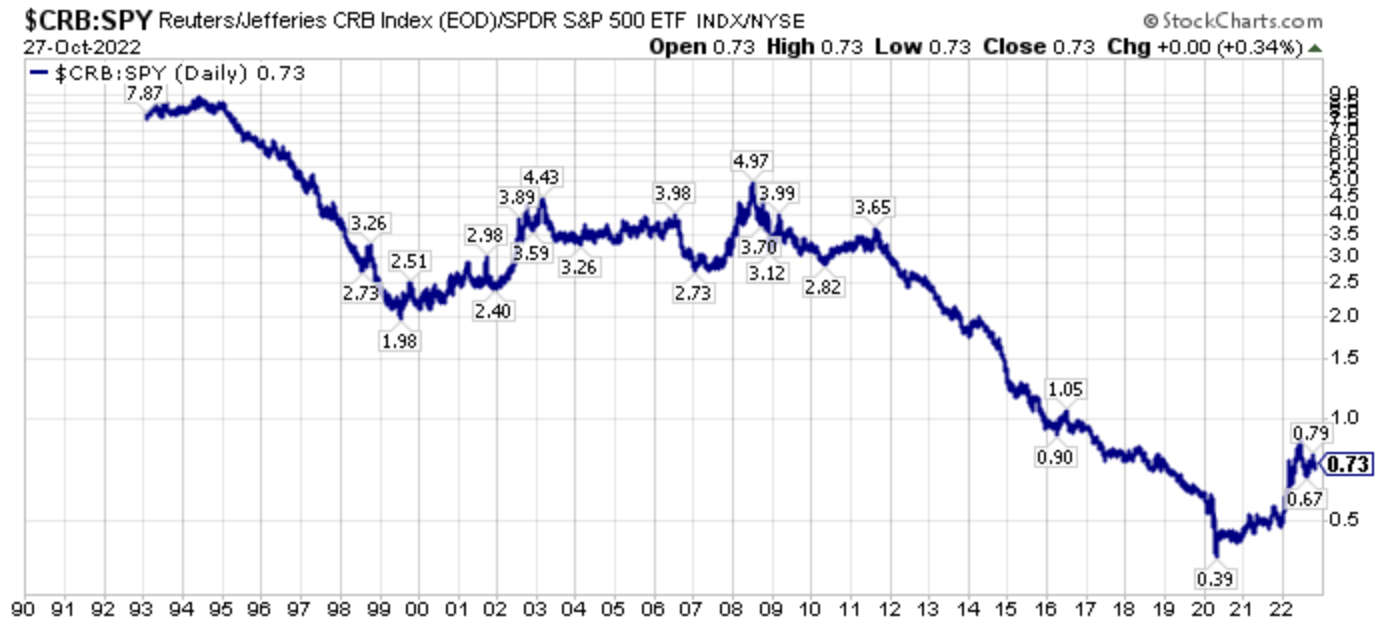
$CRB Versus SPY As Of October 27th, 2022 (Author, StockCharts)
For perspective here was the last chart posted in the April 15th, 2022 article.
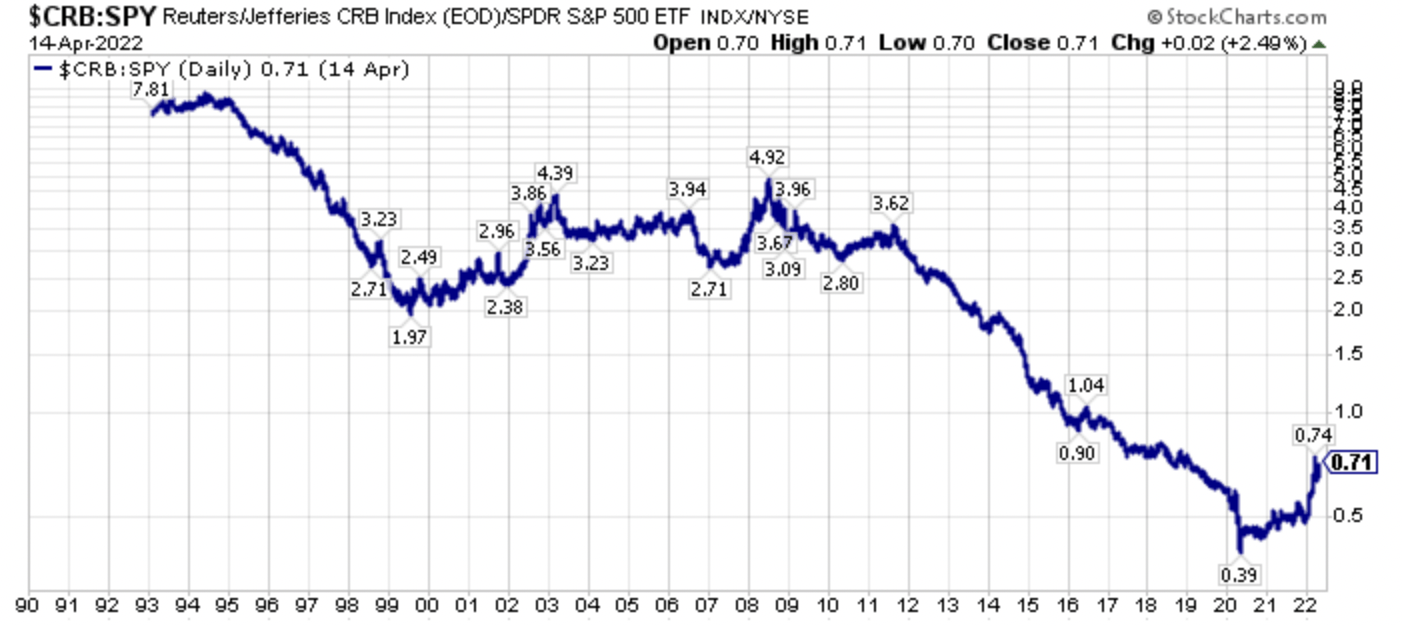
$CRB Versus SPY As Of April 14th, 2022 (Author, StockCharts)
For reference, here was the same chart posted in the September 10th, 2021 update in this series.
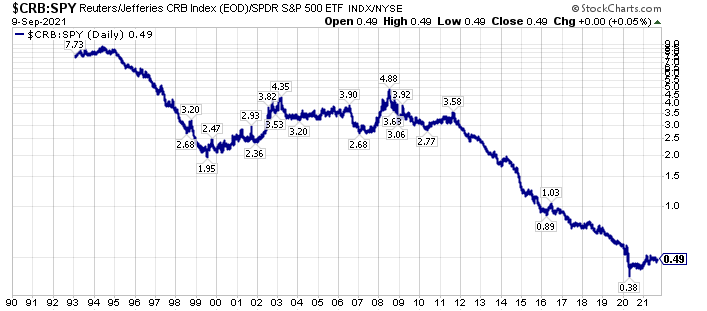
$CRB Versus SPY As Of September 9th, 2021 (Author, StockCharts)
For further reference, here was the same chart I published in the May 26th, 2021 update. Look closely, as even with the relative outperformance of commodities, there has been only moderate movement in this reversion to the mean ratio. This should tell the market generalist that we are still in the midst of a reversion-to-the-mean higher.
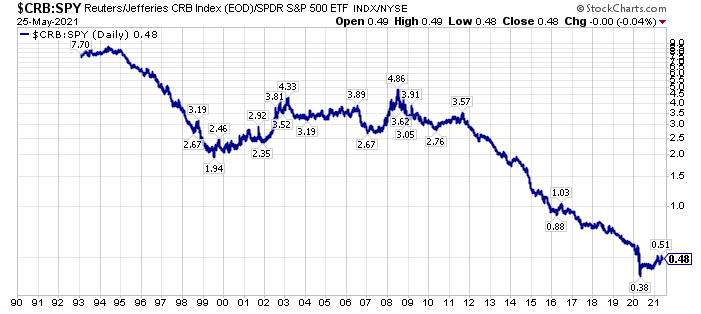
$CRB Versus SPY As Of May 25th, 2021 (Author, StockCharts)
Going all the way back, to the first article in this series, here was the same chart from my aforementioned February 3rd, 2021 article. The point is this ratio basically stood still for the first three updates in this article series, and it has moved upwards moderately over the past two updates, with significant commodity and commodity equity outperformance.

$CRB Versus SPY As Of February 2nd, 2021 (Author, StockCharts)
From a bigger picture perspective, commodities and commodity equities have certainly had an explosive move from their 2020 depths. However, in the bigger picture, that may have been the final relative washout, and the reversion-to-the-mean trade has the potential for a lot more room to run.
Closing Thoughts: More And More Investors Are Starting To Recognize The Potential Of A Secular Commodity Bull Market
With Buffett piling into Chevron (CVX), and Occidental Petroleum (OXY), another stock that was a battleground stock where we were early on, many investors are starting to open their eyes to the developing potential in commodities, and commodity equities. For the moment, the energy sector remains a relatively paltry roughly 5% of the S&P 500 Index, however, as relative outperformance continues, the passive fund flow headwinds will become tailwinds.
The untold story with the rise in energy equities is that this is a supply side story. Going further, the capital cycle is playing out in real time as energy equities collectively emphasize shareholder returns, specifically buybacks and dividends, diverting operating cash flows that used to almost entirely be reinvested back into operations. This, along with still low valuations, has interrupted the normal capital and created a backdrop for a secular bull market.
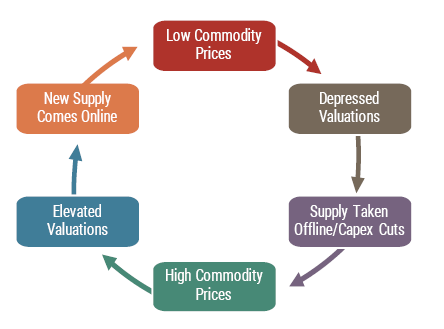
Capital Cycle (GMO)
This outperformance of the most out-of-favor energy equities, a sector I have been known to previously call the red-headed stepchild of the already out-of-favor energy sector, at least before the recent price run-up, has really accelerated in 2022.
With the broader equity market still exposed to the potential of a further drawdown, or perhaps seven years of running in place, because of historically poor starting valuations, there’s a need for investors to consider alternative asset classes. Importantly, a further drawdown in the broader markets, which could be fueled by rising long-term interest rates rising because of supply side commodity inflationary pressures combined with building wage pressures, could accelerate fund flows into commodity equities.
Why?
Simply put, investors will be looking for non-correlated sectors and non-correlated stocks, especially if the drawdown in both stocks and bonds continues. Notably, this dual decline in stocks and bonds year-to-date in 2022 is impairing the traditionally popular 60/40 portfolio as well as the previous very in-favor risk parity strategies. On this note, commodity stocks, specifically the once loathed, and still generally unloved energy equity sector, certainly fits the bill as a portfolio diversifier, and enhancer, which we have seen play out in spades in 2022.
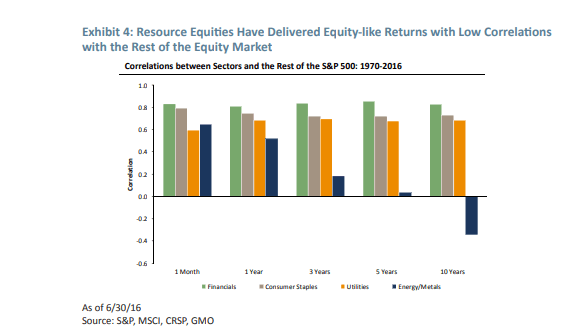
Resource Equities Offer Diversified Returns (GMO)
Wrapping up, quietly at first, and now more rapidly as the capital rotation has broadened in scope, we have seen a passing of the baton of market leadership. Once the last safe-haven equities succumb to the broader bear market selling pressures, perhaps this passing of the baton will be clearer, however market phase changes like this take a long time, meaning years in the process. Will there be ebbs and flows to this process? Unequivocally yes, meaning expect relative pullbacks as investors reposition, and investors of all stripes try to re-orientate around the inflection point that is occurring real time.
At this juncture, most investors are simply just becoming aware of the ongoing bear market and the leadership transition that has been taking place since the broader equity markets bottomed in March of 2020, though relative and absolute price action this year in 2022 has certainly opened more eyes.
Recognizing this changing backdrop after years of study, including being too early, I have been pounding the table on the extremely out-of-favor commodity equities for several years now, and I still think we’re in the early innings of what will be a longer-term secular bull market, albeit with significant volatility. Personally, I think we will supersede the capital rotation that took place from growth-to-value during 2000-2007, which also coincided with the last secular commodity bull market which ran from 2000-2008.
Investors skittish of commodity equities should research cast aside financials as they also will benefit from a renewed steepening of the yield curve, which is probably forthcoming following the eventual Fed pause and pivot, whenever it occurs, which could even be a year out at this juncture.
Understanding the bigger picture, then having an understanding of the bottoms-up fundamentals has been the key to outperformance, and this is a path that has not been easy with those participating confirming this reality. However, the road less taken is sometimes the better one, and I firmly believe that today, as traditional stocks, bonds, and real estate continue to offer very poor starting valuations, though they’re better than at the start of this year where I opined it was better to be in cash for the next seven years, and very poor projected future real returns from today’s price levels. More specifically, the out-of-favor assets and asset classes, including commodities and commodity equities and out-of-favor specific securities, are where the historic opportunity has been, and that’s where it still stands, from my perspective.
Be the first to comment