

cemagraphics
This article was first released to Systematic Income subscribers and free trials on Aug 5.
In this article, we discuss Q2 results from the Business Development Company Oaktree Specialty Lending Corp (NASDAQ:OCSL). OCSL is a relatively large BDC with $2.6bn in investments. Its focus lies at the higher-end of the middle-market segment with a $128m median company EBITDA. It is also relatively underweight equity, with an above-sector average allocation to secured debt.
Its sector profile, as shown below, is focused on Technology and Healthcare sectors. The company features a high-quality underwriting track record and strong total NAV returns in the sector. OCSL has been in our High Income Portfolio since the end of last year and we recently added to the stock in mid-June. Given its recent run-up and valuation we have just downgraded it to a Hold from Buy.
Oaktree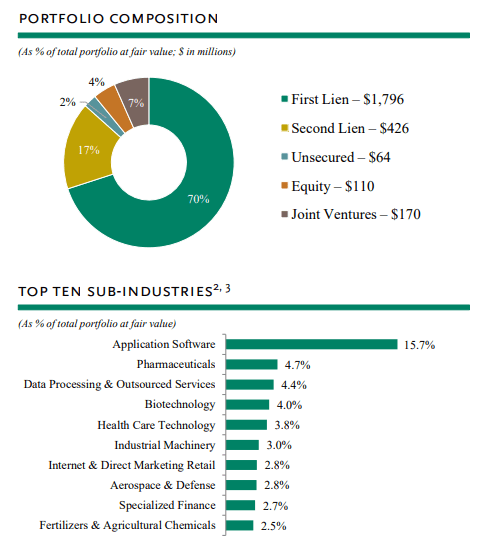
Quarter Update
GAAP net income (blue bars) was flat in Q2 while adjusted (red bars) net income (i.e. adjusted for merger-related adjustments and a portion of incentive fees) was lower by a penny to $0.17 from Q1 and flat to Q4.
Systematic Income BDC Tool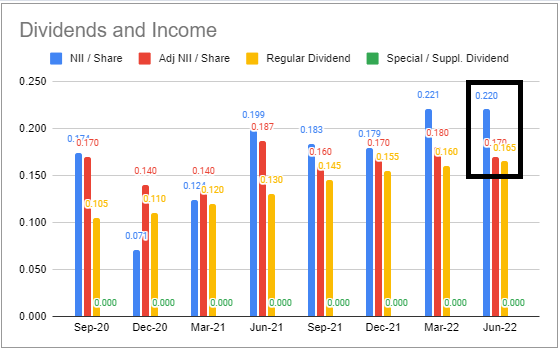
Dividend was increased once again by half a penny to $0.17. OCSL has been increasing dividends for a couple of years now. These increases have not been overly surprising as net income has tended to run well above the dividend level. Current dividend coverage from adjusted net income is exactly 100% however we expect net income to move higher on the back of rising short-term rates so we expect further dividend hikes over the coming quarters.
Systematic Income BDC Tool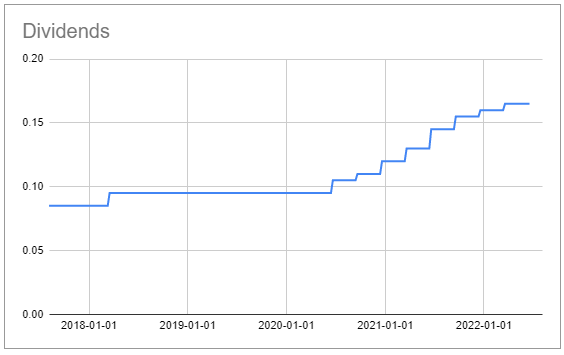
As we discussed several times, we expected OCSL to underperform in Q2 and this is indeed what happened as its NAV had the second largest drop so far over Q2 in the sector.
Systematic Income BDC Tool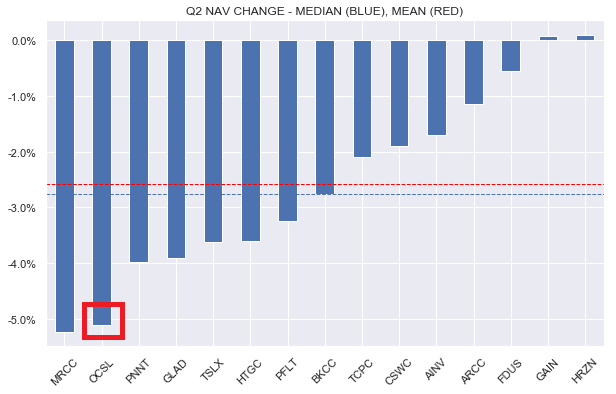
The 5% drop in the NAV is the second largest of the reporting season so far, however, in our view, it’s overstated for three reasons. First, as we discuss below, OCSL tends to be fairly conservative in their NAV marks. Second, credit spreads have reversed about half of their widening over Q2. And third, the company has been adding to publicly traded loans as prices have fallen this year, some 15-20% below par, which they expect to generate significant capital gains. Loans have continued to recover since the end of the quarter which would result in a marginal increase in the NAV on a marked-to-market basis as of today, all else equal.
Systematic Income BDC Tool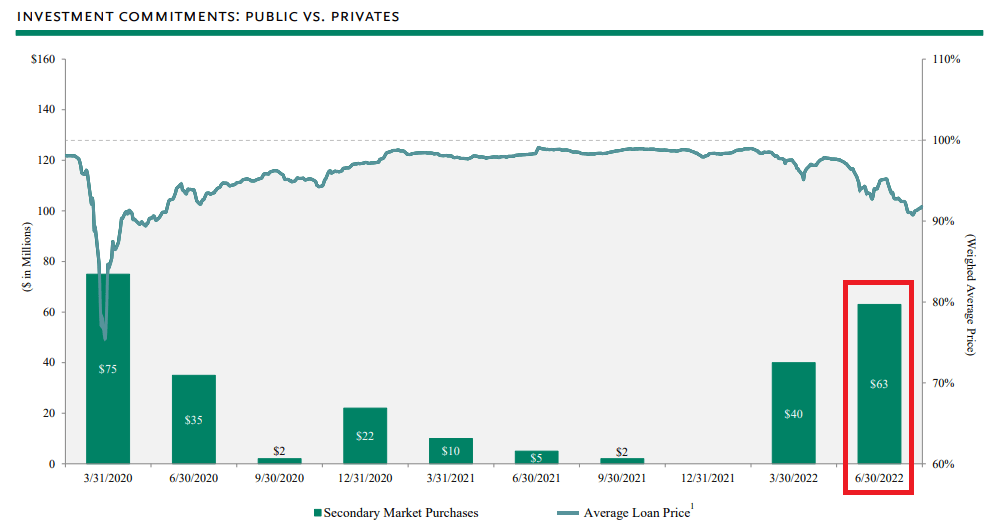
Therefore, on an apples-to-apples and marked-to-market basis, we would expect the company’s valuation to be a touch below 100% which makes it fairly-valued in our view.
OCSL has a relatively conservative NAV marking process (or, more correctly phrased, in our view, the rest of the sector has a relatively aggressive NAV marking process). A common pattern for OCSL is to mark down their assets during wider credit spreads periods and then to write them back up as credit spreads tighten back. We saw this pattern in Q1-2020 when the company’s NAV fell much more than the sector average. This time around we see the same pattern as the NAV sharply underperformed the broader sector over Q2. In our view, given the company’s strong track record of net realized gains and a continued zero/low level of non-accruals, investors should look past the high NAV volatility to some extent. In other words, OCSL will tend to feature a higher level of NAV volatility than the broader sector however this volatility will carry less signal and more noise than the average BDC.
Systematic Income BDC Tool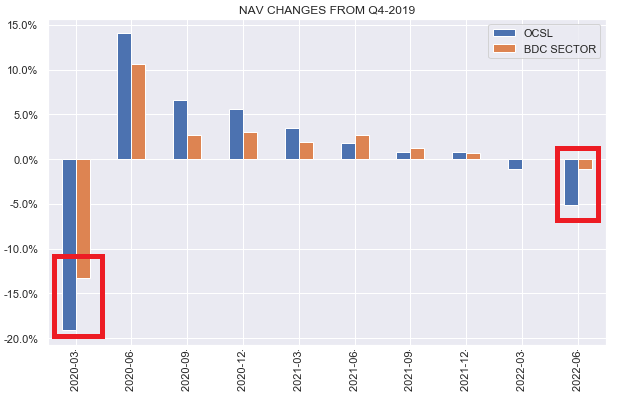
Income Dynamics
In this section we highlight some of the key factors that will drive net income over the medium term.
One takeaway from the management discussion was that the first half of 2022 was not unusually appealing to them. In other words, loan documentation did not “tighten” and spreads did not widen out significantly. This seems to be due to the combination of a large amount of capital that was raised over the last few years dedicated to the direct lending space as well as a drop in the level of deal flow, both in M&A / LBO volumes as well as less interest from private business owners to sell their business in the face of lower multiples. This view also explains why OCSL didn’t aggressively expand their asset base – net new investments were essentially flat over Q2 as the chart shows below. This view is not totally aligned with other BDCs, specifically ARCC which commented that it was seeing stronger documentation and wider spreads and which also had a large increase in net new investments.
Systematic Income BDC Tool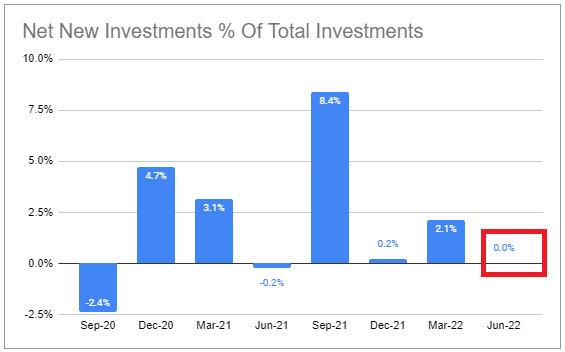
OCSL raised its leverage target range from 0.85-1.00x to 0.90-1.25x. This obviously gives the company some additional capacity to pursue attractive assets since it was already operating above the upper level of their previous range. It also mitigates the risk the company is forced to shed assets i.e. deleverage. This is because a drop in asset marks mechanically raises its leverage level. The company said its current leverage level appears appropriate and doesn’t expect to move up to the upper level of the range. The current leverage level is slightly above the BDC average.
Systematic Income BDC Tool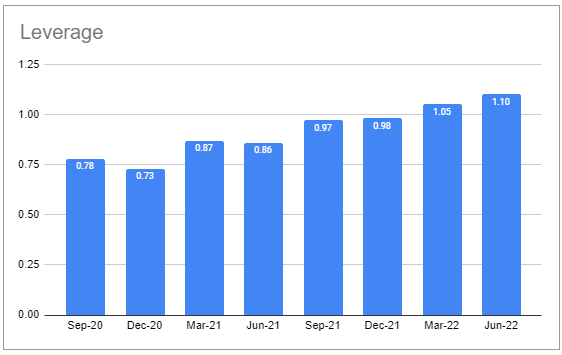
The company said that most of the portfolio resets on 30-June which means that the full rise in short-term rates over the quarter was not captured in its Q2 income. For example, a 3-month Libor linked loan that reset at the end of March would have accrued at a level of Libor of 0.96% for the entire Q2 whereas Libor finished Q2 at 2.3% (and is now even higher at 2.8%). In other words, the same position would have seen an increase in its coupon of 1.3%, assuming a Libor floor of 1% or below, if it accrued Libor at the Q2-end level. OCSL estimate that if the entire portfolio accrued at its Q2-end level of short-term rates net income would have been $0.18 vs $0.17. What this suggests is that we should continue to expect an uptick in net income over the rest of the year, all else equal, on the back of rising short-term rates. It also means that further dividend hikes are not out of the question.
Systematic Income BDC Tool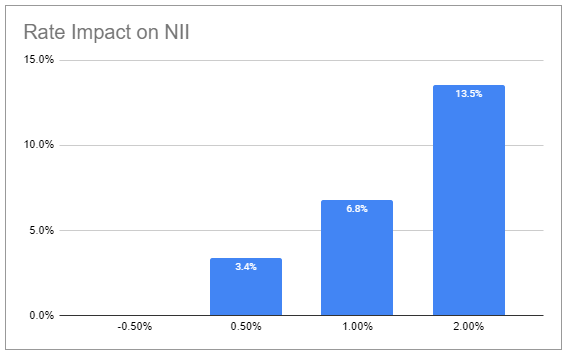
The weighted-average yield on its debt securities (blue bars) increased by 0.5% to 9.3% while its debt interest expense (red bars) increased by 0.7% to 3.2%. Debt interest expense increased at a faster pace because of the lack of Libor floors on liabilities however this velocity will now even out with the asset-side going forward. OCSL also saw a larger than average increase in debt costs because of its above-average level of floating-rate debt of 53% vs. 40%. Its strong credit profile, however, means its debt interest expense remains below the sector average by around 0.3-0.5%.
Systematic Income BDC Tool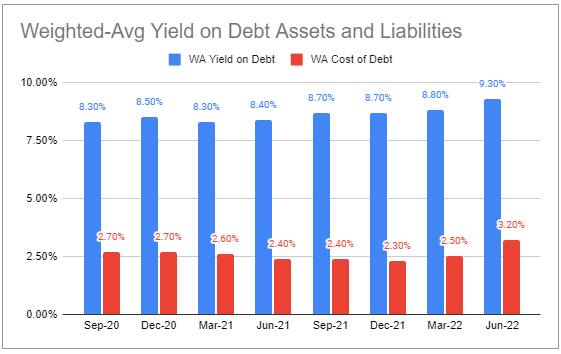
The company continues to carry about $100m of lower-yielding assets earning less than Libor + 4.5% which it plans to opportunistically rotate from into higher-yielding assets.
Portfolio Quality
Management did not indicate any portfolio concerns on the call. They indicated they were happy with the average level of interest coverage in the portfolio which was around 3x as well as the average leverage profile which was 4.9x.
Non-accruals continue to run at zero.
Systematic Income BDC Tool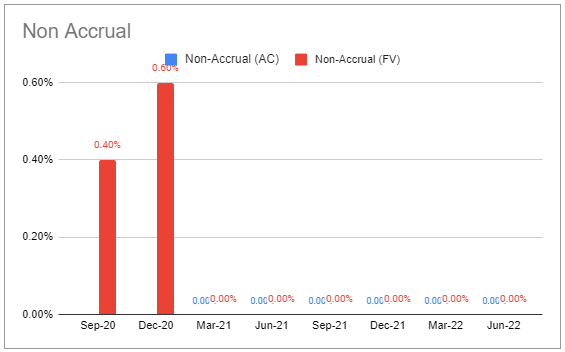
Net realized gains/losses have been uniformly positive over the last few years. Significant realized losses could be an indication the company was managing its non-accruals lower by selling off underperforming assets.
Systematic Income BDC Tool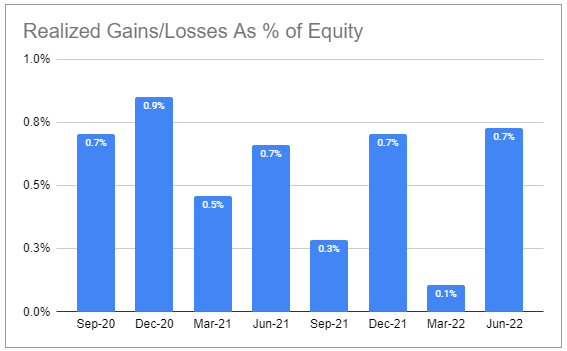
PIK income ticker higher and stands around 3% above the sector average which is worth keeping an eye on.
Systematic Income BDC Tool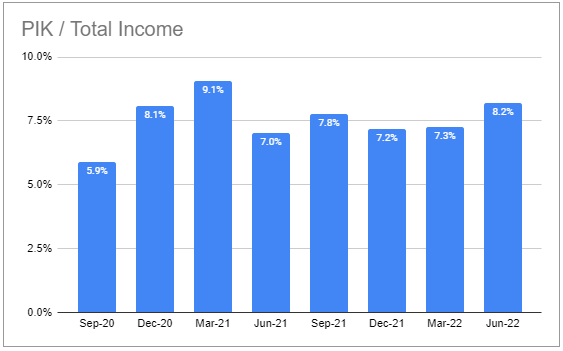
The allocation profile has not changed a whole lot. The company continues to run a light-equity allocation portfolio at about 5% (across warrants/common/preferred) versus about 10% for the sector average.
Systematic Income BDC Tool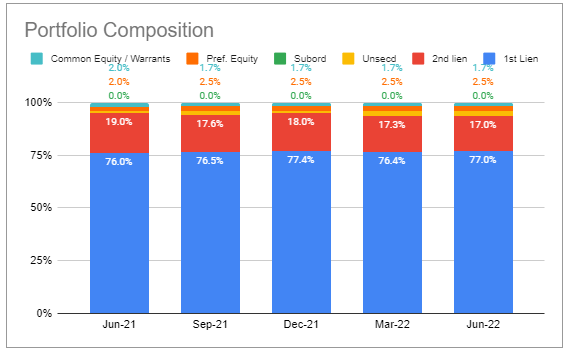
Valuation Profile
OCSL has tended to trade at a valuation below the sector average. This may have been due to portfolio concerns when it took over from Fifth Street as well as a lack of public track record. This has changed recently as OCSL has moved out to an above-sector valuation.
Systematic Income BDC Tool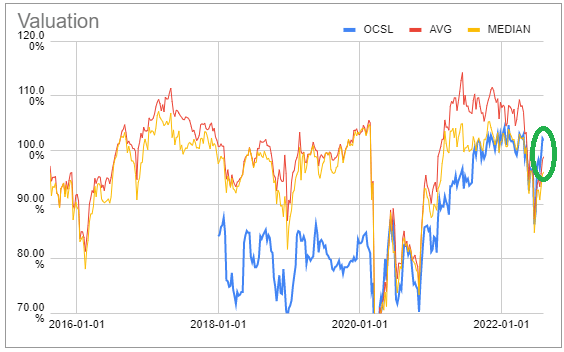
We can see this behavior more clearly in the following chart which plots the valuation differential between OCSL and the sector average and median valuations.
Systematic Income BDC Tool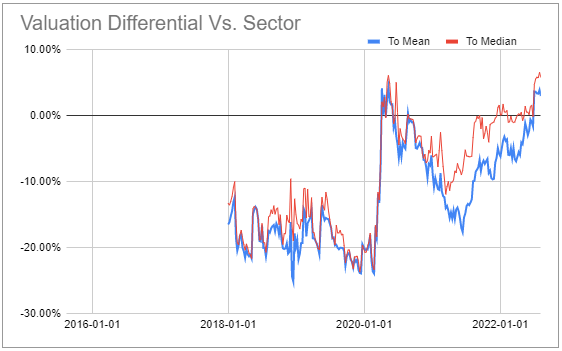
We should say that this is, arguably, overstated by 2-3% given the more conservative NAV marks process of OCSL which we discussed above. On an apples-to-apples basis OCSL would probably be trading much more in line with the sector. This makes it fairly-valued in our view given its above-sector total NAV return profile.
Systematic Income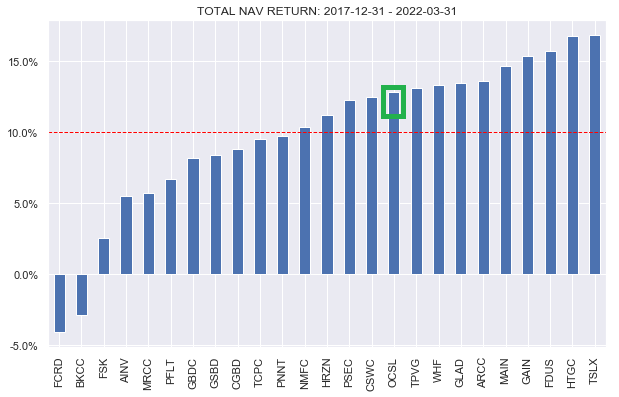
Given its track record, higher capital structure allocation profile and low non-accrual track record, it’s fair to say that OCSL runs a higher-quality portfolio and we expect it to be more resilient if we do enter a recession. The company was very resilient during the short-lived recession in 2020.
Systematic Income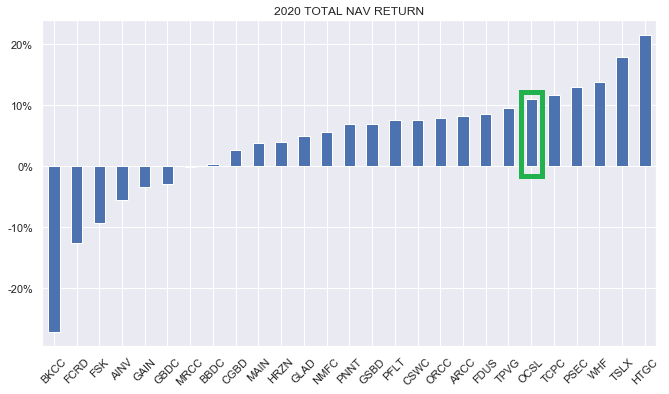
Takeaways
Overall, OCSL had a decent quarter in our view. Although NAV underperformed the sector and adjusted net income ticked lower there are good reasons why this was the case. Going forward we expect OCSL to put up further increases in net income which are likely to be followed by dividend increases. Investors do have to be prepared for potential NAV volatility if credit spreads rise above their Q2-end levels given the more conservative approach OCSL takes to their portfolio marks. OCSL has recently traded up strongly, rising 12% from its June trough so we downgrade it to a Hold from Buy.
Be the first to comment