

kyrien/iStock via Getty Images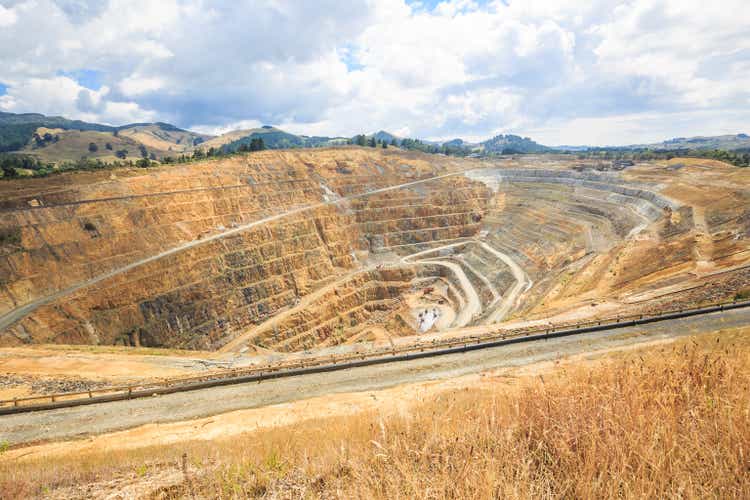
It has been a strong start to the year thus far for the Gold Miners Index (GDX), and one of the star performers has been OceanaGold (OTCPK:OCANF). This is based on the stock’s more than 80% rally off its January lows, with a nearly 6000 basis point outperformance vs. the S&P-500 (SPY). However, while the story is improving with increasing production, much of this positivity looks priced into the stock at ~1.17x P/NAV. Therefore, I see this rally above US$2.65 as an opportunity to book some profits.
Haile Mine Operations (Company Website)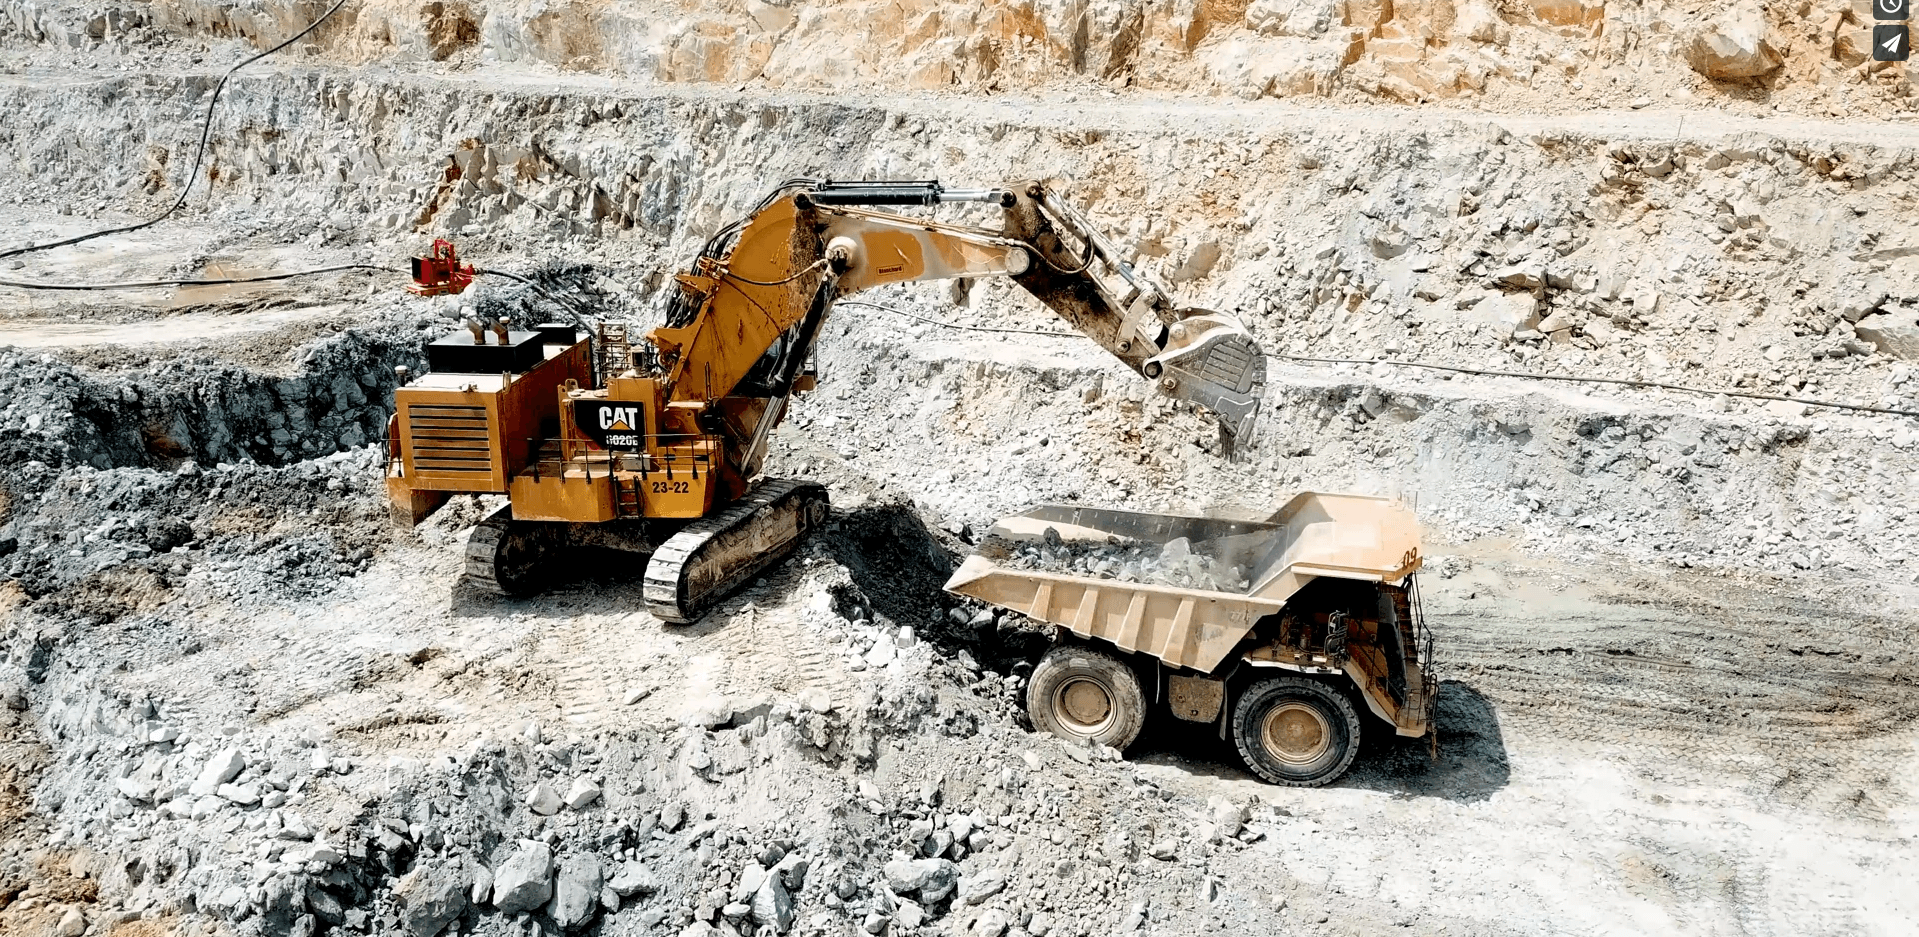
Just over five months ago, I wrote on OceanaGold, noting that the stock’s outlook was improving and that any pullbacks below US$1.60 would provide low-risk buying opportunities. After a brief stutter step in January with the stock dragged down due to sector-wide weakness, the stock has launched higher, helped by a solid Q4 report with gold production of ~106,600 ounces, translating to revenue of $208.5 million, and adjusted EBITDA of $92.6 million. The company also provided a 3-year outlook, which targets increasing production for the next three years. Let’s take a closer look below:
OceanaGold Quarterly Production (Company Filings, Author’s Chart)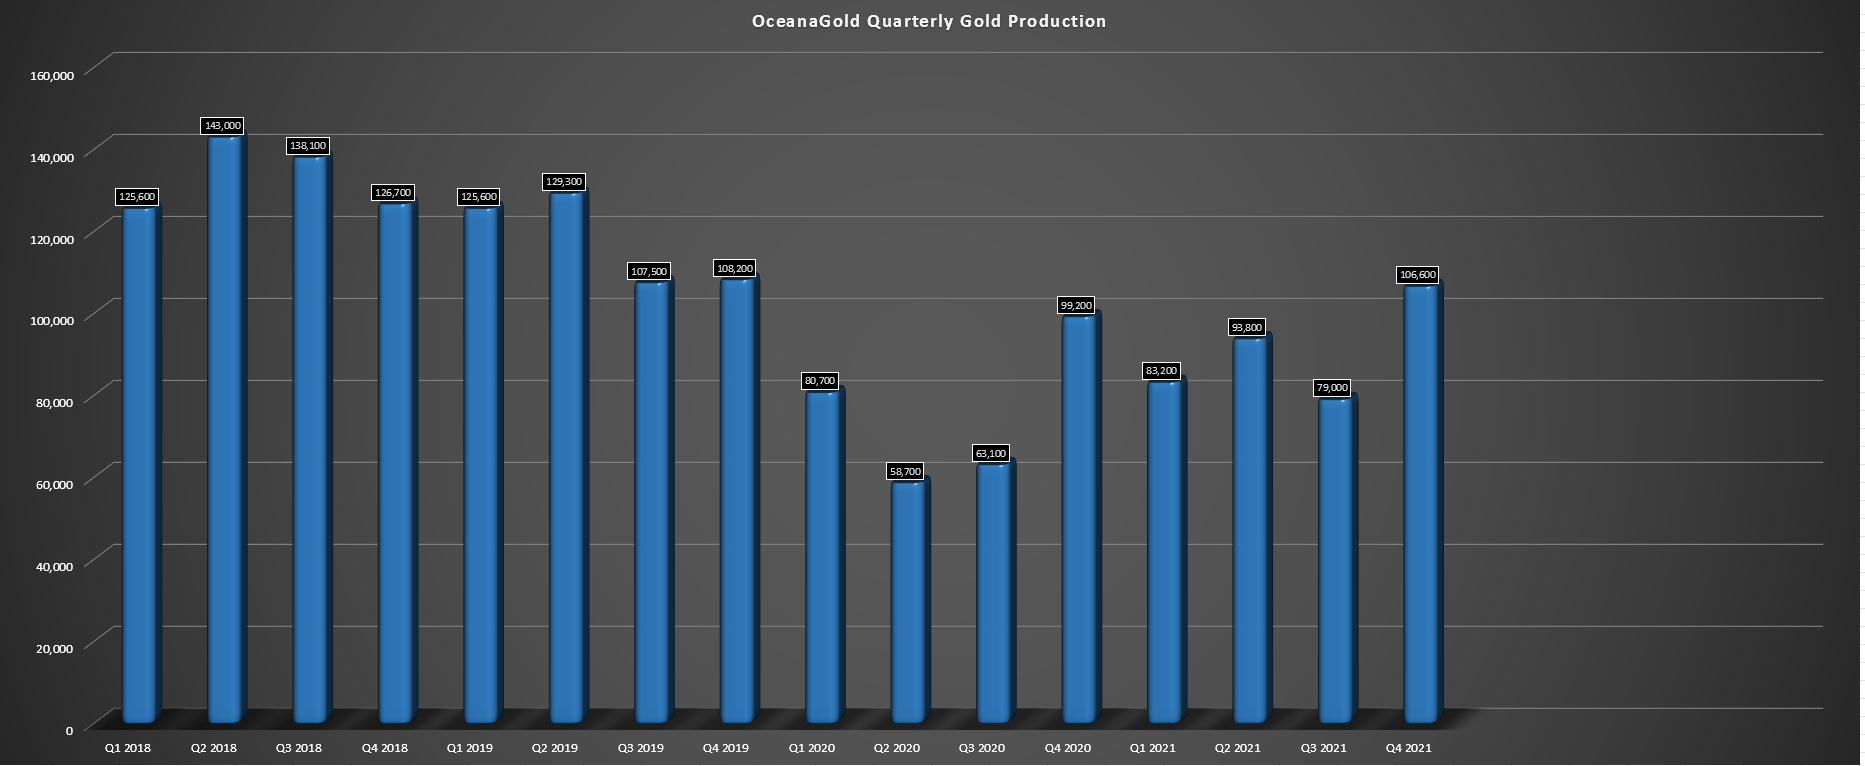
Increasing Production
Looking at the chart below, one might conclude that OceanaGold has near unparalleled growth sector-wide, with production set to increase from ~362,800 ounces in 2021 to ~470,000 ounces in 2022 ~510,000 ounces in 2023, and up to 620,000 ounces in 2024. This would represent an ~18.2% compound annual growth rate at the mid-point, which is very respectable for a sector where low to no growth is the norm. However, the start date to highlight this growth is key, and the chart below does not provide a complete picture.
OceanaGold – Production Profile & Guided Production (2021-2024) (Company Presentation)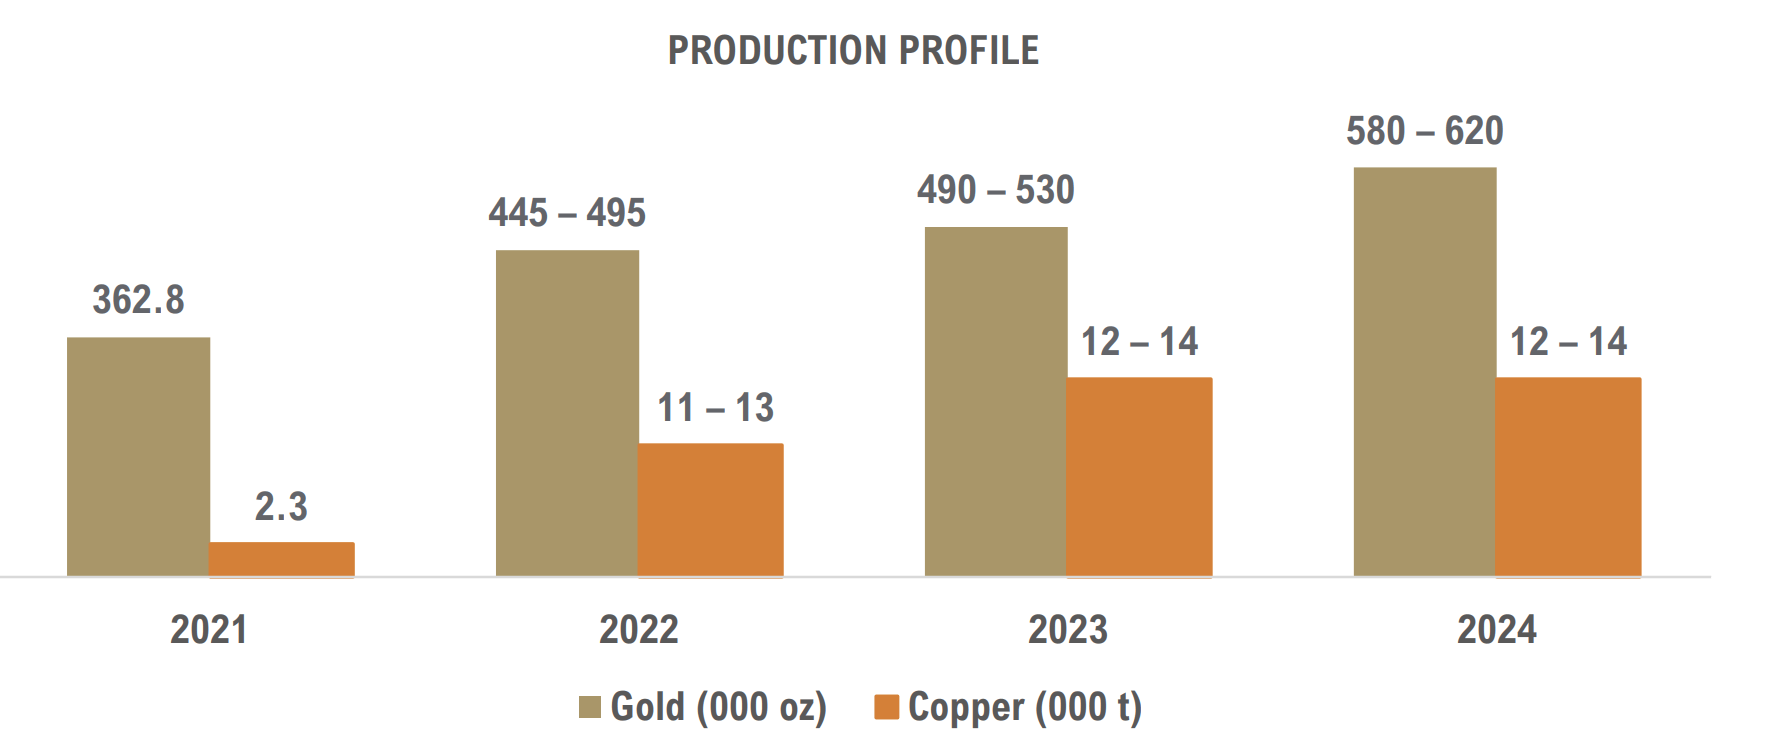
If we look at a long-term picture and don’t use an extremely easy comparison for the starting date, FY2022 production will still come in 18% below FY2017 levels at the mid-point, for a compound annual production growth rate of (-) 3.9% in the period. Meanwhile, looking out to FY2024 and assuming the mid-point is met, production will increase by just over 4%, translating to a compound annual production growth rate of 0.60%. Therefore, depending on which year one chooses to map out the production profile from in their estimates, one could argue that this is not so much a growth story as it is a recovery or turnaround story.
OceanaGold – Annual Production & Forward Estimates (Company Filings, Author’s Chart)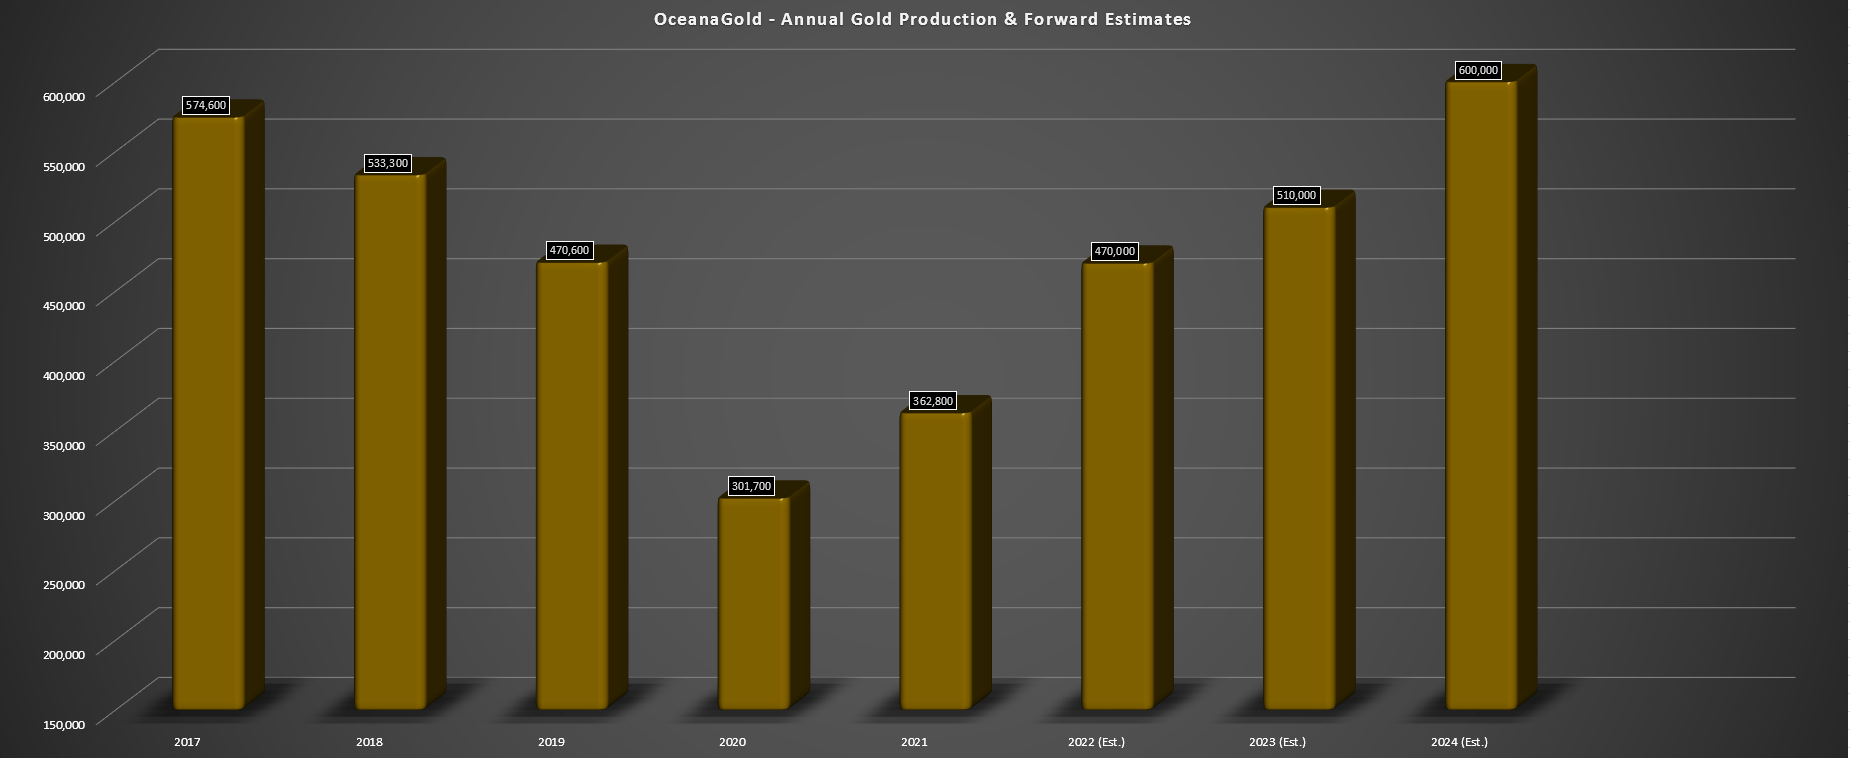
There is nothing wrong with a massive valley in production that is recovered over a several-year period. However, I think a more accurate assessment would be a recovery in production, given that FY2023 production will still be below 6-year earlier levels. Elsewhere in the sector, we have seen several real growth stories. Two examples are B2Gold (BTG) growing production from ~630,000 ounces in FY2017 to estimates of ~1.03 million ounces in FY2022, and Kirkland Lake Gold achieving an even higher growth rate, growing production from ~575,000 ounces to ~1.43 million ounces of gold in FY2021.
Some investors might argue that the semantics are irrelevant, and with production on a path to approach 2017 levels, the stock should respond accordingly and head back towards its highs near US$3.80 per share. However, I would disagree strongly with this assertion. This is because, while production has grown, the share count has also grown since 2017, and the company’s cost profile is completely different. This is displayed in the below chart, which shows that all-in sustaining costs [AISC] will be up 115% vs. FY2017 levels ($617/oz) if they come in at my estimates of $1,340/oz in FY2022.
OceanaGold – Production, Fully Diluted Shares & All-in Sustaining Costs Per Ounce + Forward Estimates (Company Filings, Author’s Chart)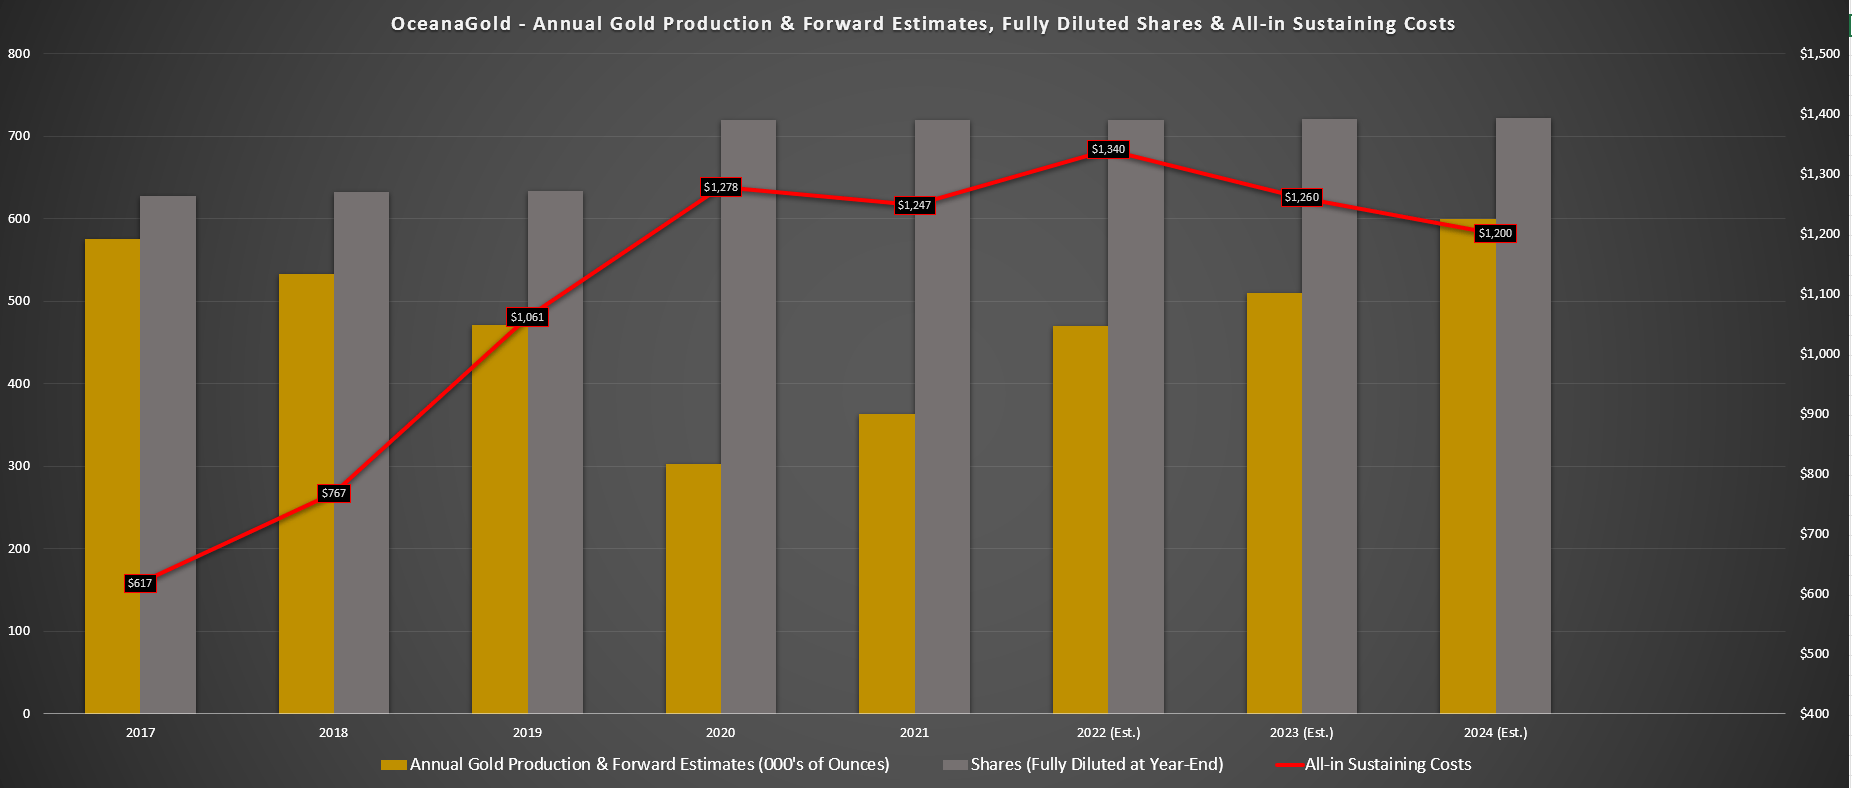
If we look out to next year, where I have estimated OceanaGold’s consolidated AISC of $1,260/oz, costs will still be up more than 100% vs. FY2017 levels. So, while the gold price has obviously risen sharply vs. FY2017 levels, OceanaGold will be a ~510,000-ounce producer in FY2023 with an AISC margin of $640/oz ($1,900/oz gold price assumption) vs. a ~575,000-ounce producer in FY2017 with an AISC margin of $644/oz. Finally, it has a 15% higher share count based on my estimated ~722 million fully diluted shares at year-end 2023.
So, with lower production, flat margins, and a higher share count, I don’t see any justification for using the previous high as an anchor for where the share price should be today, even with a higher gold price. This does not mean that the stock can’t go higher; it is merely to point out that while this recovery or growth in production is positive, the company has seen little to no margin expansion in the period, even with the gold price gaining more than $600/oz. Let’s dig into the valuation:
Valuation
Based on ~720 million fully diluted shares and a share price of US$2.65, OceanaGold currently trades at a market cap of ~$1.91 billion, or an enterprise value of just over $2.14 billion. Based on the company’s recent slide deck, the company argued that it was heavily undervalued, with a cash flow per share multiple well below that of the producers it chose to stack itself up against. However, I think the peer group was chosen quite favorably. This is because, if we look at FY2022 cost estimates, which I have added to the chart, 80% of the stocks that OceanaGold stacks itself up against have higher margins.
Cost estimates use the mid-point of FY2022 AISC guidance and my cost estimates for OceanaGold ($1,340/oz)
OceanaGold – P/CF vs. Other Gold Producers (Company Presentation, Author’s Notes)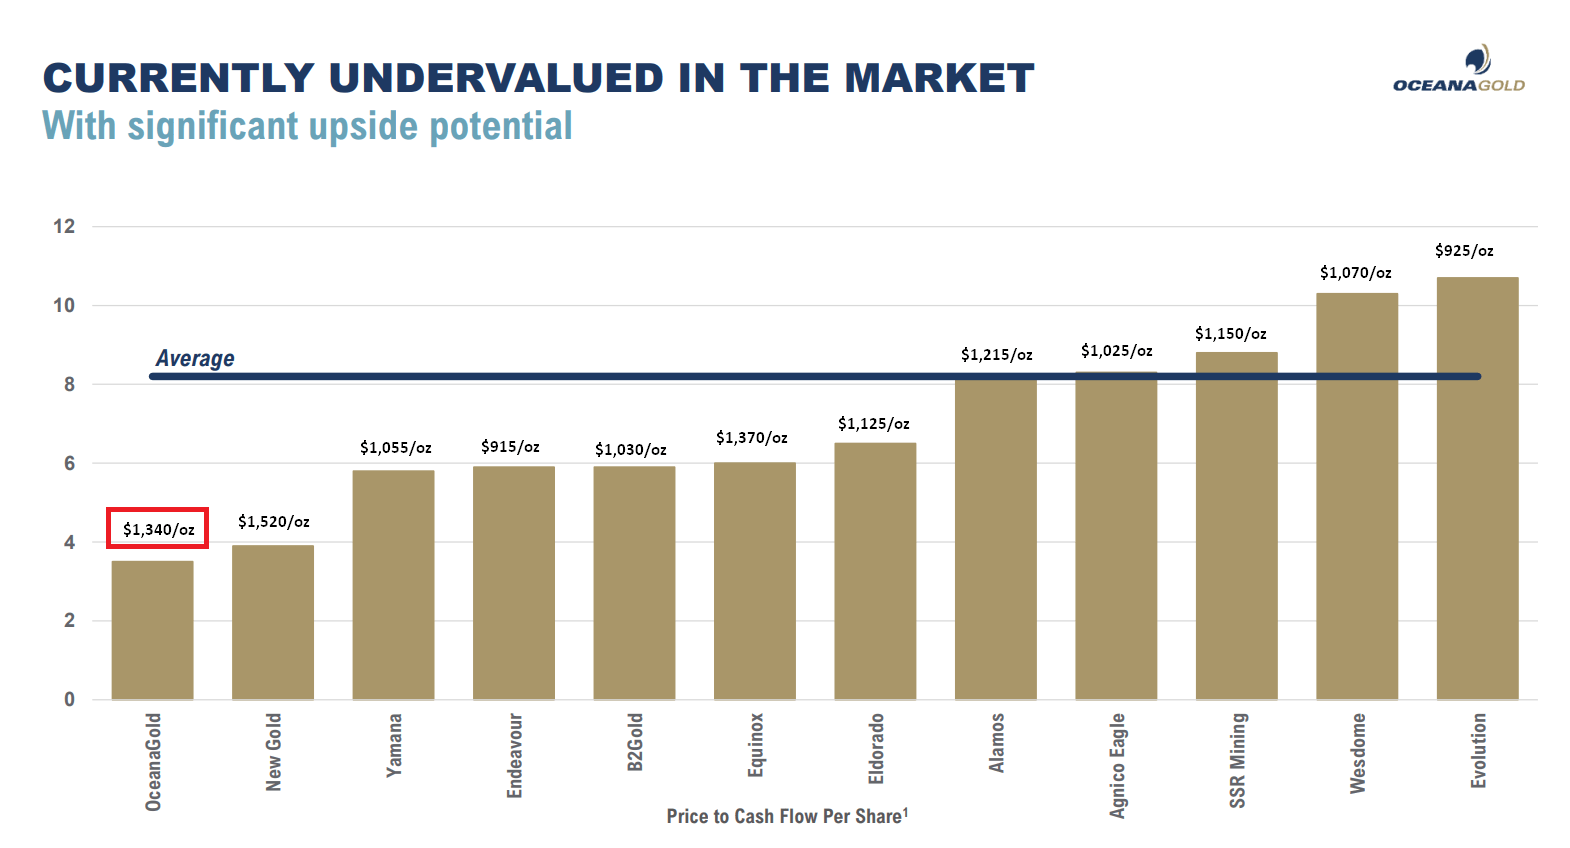
If we exclude 800,000+ ounce producers like Agnico (AEM), Evolution (OTCPK:CAHPF), and SSR Mining (SSRM) that don’t belong on this list either, both from a size and margin standpoint, we’re left with much fewer names. If we then adjust for companies with less than 600,000 ounces of production per annum, all-in sustaining costs above $1,200/oz, and at least one operation in a Tier-2 or Tier-3 ranked jurisdiction; three companies remain: Equinox (EQX), New Gold (NGD) and Eldorado Gold (EGO). As we can see, the average P/CF multiple for this more relevant peer group is much lower than the P/CF multiple of 8 implied by the above chart.
OceanaGold – P/CF vs. Peers Adjusted for Recent Performance (Company Presentation, Author’s Drawings & Notes)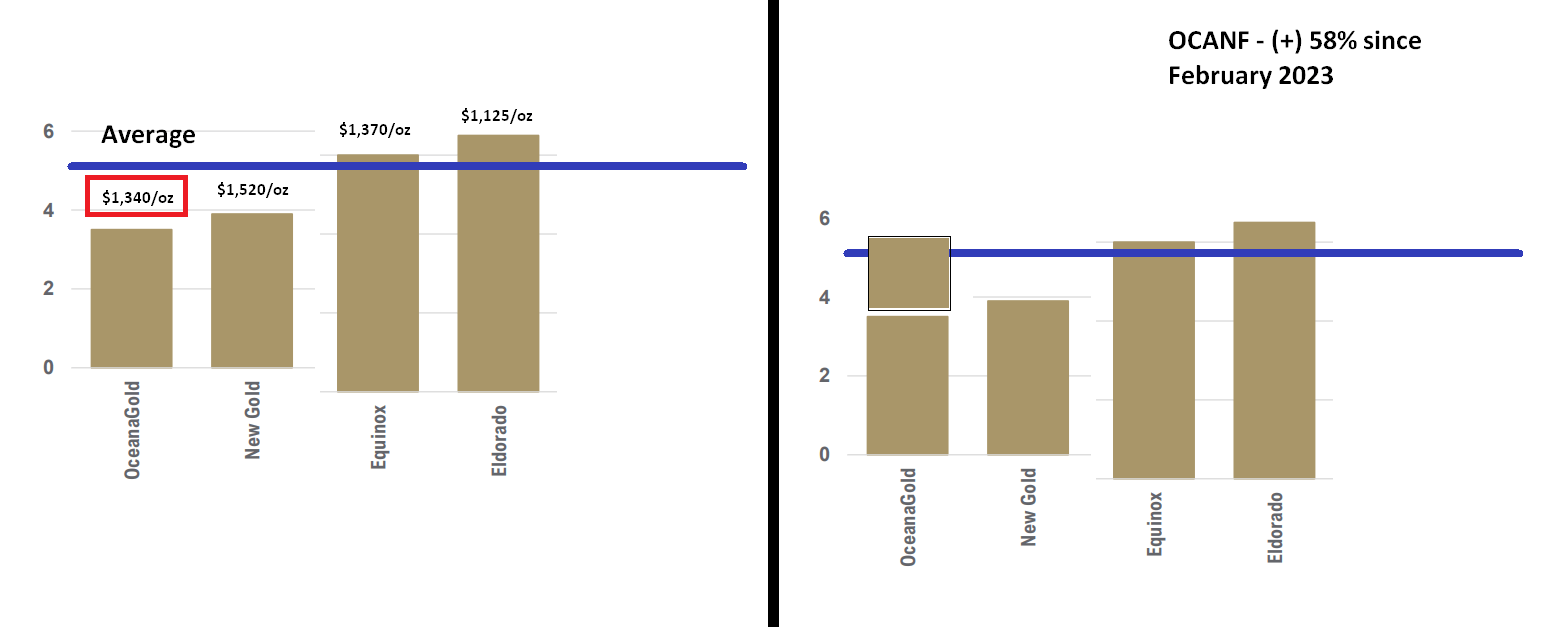
If we look at the chart of more relevant peers and adjust for the fact that OceanaGold is up 58% since February 23rd (the date the comps were posted), OceanaGold has filled in all of this valuation gap and then some. Hence, while the company was right to point out its undervaluation in mid-February, the recent outperformance has eroded any undervaluation argument. In fact, I would argue that OceanaGold is fully valued at current levels, based on my estimated net asset value of ~$1.64 billion, and the stock is currently valued at more than $1.91 billion. This translates to a P/NAV multiple just shy of 1.20, typically reserved for million-ounce producers.
Technical Picture
If we look at the technical picture, we can see that OceanaGold has soared by more than 85% from its recent lows and is currently sitting just shy of a potential resistance area at US$2.70. This resistance area is based on an assumed supply zone, with this area previously being a multi-year support level. Given that we saw three years of buying by investors at this level and investors/traders that recently bought the lows have found themselves at a significant profit in a short period, I would expect this area to be a sticky point for the stock.
OCANF Daily Chart (TC2000.com)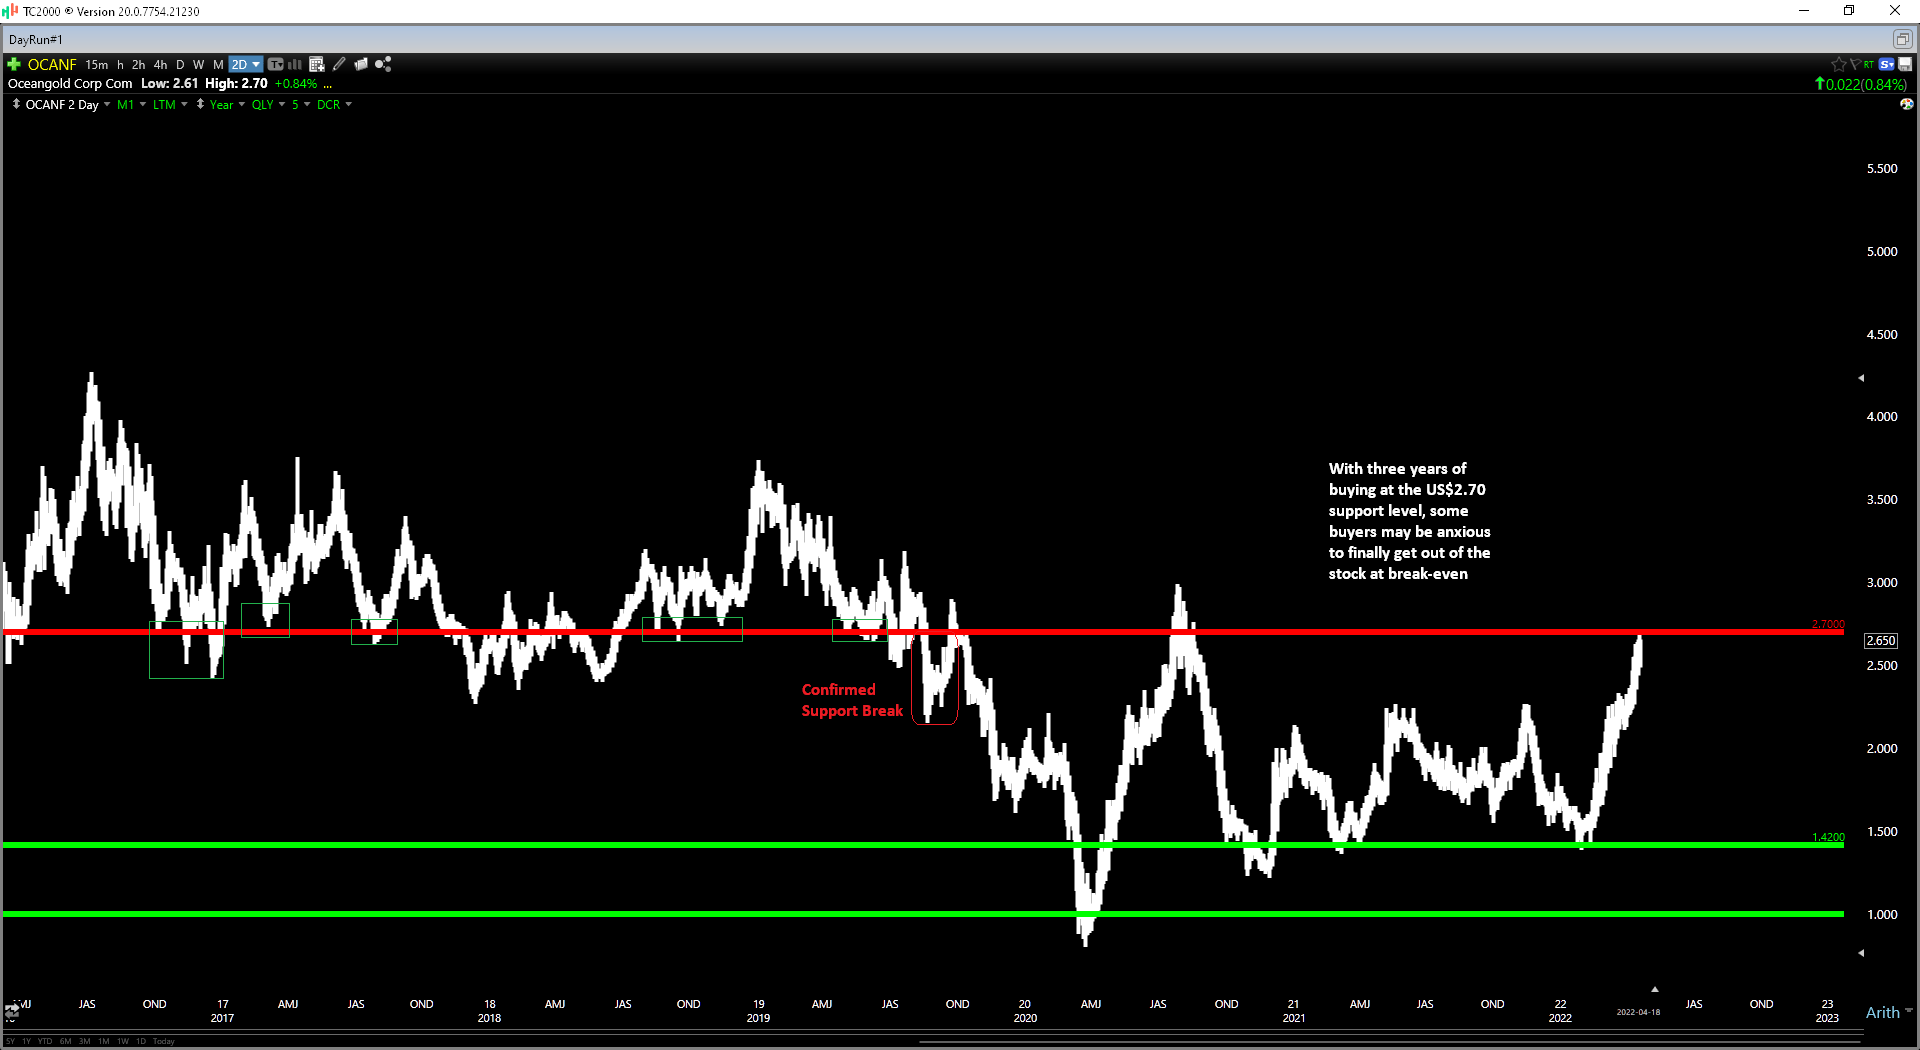
Meanwhile, the stock has pushed higher in a near parabolic fashion off its lows, with no strong support levels built on the way up. Therefore, the next support level doesn’t come in until US$1.74. This translates to a current reward/risk ratio of less than 0.10 to 1.0, with $0.06 in potential upside to resistance and $0.90 in potential downside to support. Obviously, the stock could blast through this level and go higher if gold continues to find a strong bid, but given the degradation in the reward/risk ratio, I don’t see any way to justify chasing the stock here.
OceanaGold Operations (Company Presentation)
OceanaGold undoubtedly has a brighter future than a year ago with its high-margin Didipio Mine restarted and continued exploration success at WKP. However, costs have risen sharply across the board, and while the company should see production recover to 2017 levels, margins have not improved materially, even under a $1,900/oz gold price assumption. Besides, if one is bullish on this increasing production, I would argue that much of this positivity is priced into the stock at US$2.65 (~1.17x P/NAV). Therefore, I see this rally above US$2.65 as an opportunity to book some profits.
Be the first to comment