

ssuaphoto/iStock via Getty Images
There’s an old joke about a Texas oilman who dies, goes to heaven and is told by St Peter that, sorry, the oilmen’s wing is full. He tells St Peter he can make some room, pokes his head into the oilmen’s wing and yells, “Oil discovered in hell!” The room empties as the oilmen chase the rumor. The Texan heads toward hell as well, causing a surprised St Peter to ask, “where are you going?” The oilman replies, “There might be something to this rumor!” – an example of oil industry humor
Occidental (NYSE:OXY) and Exxon Mobil (NYSE:XOM) are both integrated oil companies, but while their businesses are similar in broad contour they have significant differences. The differences start with the fact that XOM is more than five times the size of OXY. Size matters in the oil and gas business, but being larger isn’t necessarily better. Oil and gas companies of all sizes are under unrelenting pressure to replace reserves depleted by the ordinary flow of business. The challenges this presents to the largest energy companies are detailed in this Quarterly Letter entitled “The Incredible Shrinking Oil Majors” October 1, 2021, produced by natural resource research firm Goehring & Rozencwajg Associates, LLC. The article begins by noting that all the oil majors set a goal in 2000 for 5% annual increase in reserves. All the oil majors failed, with reserves actually declining. Here’s how the Goehring Letter details what happened over the ensuing 20 years::
Between 2000 and 2010, the four supermajors spent $615 bn on upstream capital expenditures. Over the same period, they produced 50.3 bn barrels of oil equivalent (BOE) and found 41.1 bn boe of new reserves, resulting in a reserve replacement ratio of 86% (not very good) at an average finding and development cost of $14.30 per boe.
Between 2010 and 2020, upstream capital expenditures surged to $1.15 tr. Over the same time, the companies produced 50.6 bn boe and found 43.3 bn boe of new reserves – very much in line with the decade prior. Even though upstream capital spending nearly doubled, the companies were still unable to replace production with new reserves. In fact, reserve replacement was unchanged at 85% despite the increase in spending. As a result, the cost to find and develop a new barrel of reserve nearly doubled from $14.30 per boe to $26.40.”
The reasons given by the Goehring Letter include the usual suspects: governments, courts, and activist ESG shareholders. All of these problems merely exacerbate the underlying fact that exploration and production have grown more difficult as the easy sources have already been discovered and exploited. The sheer size of the oil majors makes it difficult to move the needle. Exxon Mobil actually fared reasonably well by many metrics, being the only one of the majors whose reserves continued to be over ten times their annual production, but it still had negative BOE Production Growth (-0.7% annually) between 2000 and 2020 while its oil reserve growth was -27% over the two decades with the shortfall becoming an increasing factor in stock performance. As late as 2011 XOM was the #1 stock in the S&P 500. Since that time the entire industry has shrunk as a percentage of the S&P 500. Exxon has been removed from the Dow Jones Industrial Average (DJIA) and fallen to #15 in the S&P 500 while the current #1 stock, Apple (AAPL), has more than seven times its market cap.
Reserve replacement is central to the oil business. Integrated energy companies engage in three primary businesses: exploration and production (referred to in the business as Upstream), refining and marketing (referred to as Downstream), and Chemicals. The table below is constructed using data from Exxon, which is representative of the industry as a whole.
| Business Segment at XOM | % Of Revenue | % Of Profit |
| Upstream | 8% | 61% |
| Downstream | 79% | 8% |
| Chemical | 12% | 30% |
As the table shows, the Downstream business has the bulk of the revenues while the Upstream business generates the bulk of the profit and free cash flow. It’s easy to see why finding a way to replace the oil produced is the priority task, and this task becomes harder with each passing year. The Downstream and Chemical segments may be helpful when the price of oil is low, but they are no solution to the primary problem. The case of Exxon shows clearly that the real money is in the Upstream segment. To run out of oil and gas is to go out of business.
This somewhat lengthy introduction provides necessary background for understanding the advantages and disadvantages of Exxon Mobil and Occidental. Analyzing oil companies presents a unique challenge. To begin with, their results are heavily dependent on the commodity itself, which is highly cyclical and subject to extraneous events that can come at any time. The individual companies are hard to evaluate because the basic metrics for performance do not lend themselves to standard linear projection and analysis. Success and failure in the oil business is heavily dependent on reserve replacement which comes in lumps with the occasional large discovery of important new fields and increasingly from successful mergers and acquisitions, as well as disastrous failures. The importance of M&A has been a major factor for both Occidental and Exxon Mobil and is the starting point when it comes to weighing the two companies.
Exxon Mobil: The Narrative And The Numbers
For 150 years ExxonMobil and its predecessors have been the class act of integrated oil companies. It’s among the handful of companies with direct links to the original Standard Oil Trust put together by John D. Rockefeller. In my adolescence, I occasionally visited a brokerage with a ticker tape and recall the famous ticker symbol J, which seemed to cross the ticker every thirty seconds. That was the symbol for XOM’s direct precursor, Standard Oil of New Jersey (aka Jersey Standard). XOM has long been respected for its engineering excellence, and also for its skill in working within various countries and cultures. Once on a project in Indonesia (close to 50 years ago), I was given the phone number of an Exxon engineer who provided a better briefing about the culture and tricky political environment of the time than the briefing I received from the Embassy. He was stationed in Sumatra, where the oil is sulfurous and sour as he was delighted to explain. Exxon’s people were not only great engineers but also tough, courageous, and adaptable, having functioned through a revolution when bodies floated down the river near their houses.
Exxon is also famed for its capital discipline, with ROCE (Return On Capital Employed) being an acronym constantly employed by the legendary President/CEO Lee Raymond, who guided Exxon from 1993 to 2005, but capital discipline only goes so far. To add meaningful reserves even the most conservative companies sometimes take major risks and overpay for a potential game-changing asset. In 2009, about the mid-point in the decline of reserves described by the Goehring & Rozencwajg Letter, XOM made what proved to be a disastrous foray into reserve replacement by acquiring shale gas operator XTO. Even CEO Rex Tillerson admitted a decade later that XOM had overpaid. Paying $41 billion for XTO became a classic case study of the downside which comes when a big bet fails. Exxon’s stated purpose was to exploit XTO’s 45 TCF of natural gas reserves while benefiting from XTO’s expertise with shale, but the XTO disaster proved in the end to be the moment when Exxon threw in the towel on transforming itself with a merger.
As it turned out, natural gas prices declined for a decade and Exxon, which had used $30 billion of its own stock in the deal, spent several years using buybacks to get back to its previous share count. One analyst described the XTO acquisition as “the AOL/Time Warner merger of the energy sector.” A full account of the fiasco is provided in this December 16, 2019, article by Amanda Luhavalja entitled “How Not To Do M&A: A look back at Exxon’s deal for XTO 10 years later.”
The table that follows is made up of key data from SA covering the past decade at XOM. There is an orderly decline in most metrics reflecting the failure of the XTO deal and all other efforts to replace reserves.
| 2012 | 2013 | 2014 | 2015 | 2016 | 2017 | 2018 | 2019 | 2020 | 2021 | |
| REV | 419B | 390B | 365B | 240B | 201B | 237B | 279B | 256B | 178B | 277B |
| EPS | $9.70 | $7.37 | $7.59 | $3.85 | $1.88 | $4.63 | $4.88 | $3.36 | ($5.25) | $539 |
| DIV | $2.18 | $2.46 | $2.70 | $2.88 | $2.98 | $3.06 | $3.23 | $3.43 | $3.48 | $3.49 |
| FCF | $4.73 | $2.54 | $2.84 | $0.92 | $1.42 | $3.45 | $3.85 | $1.25 | ($0.61) | $8.43 |
| POR | 22% | 33% | 35% | 75% | 159% | 65% | 66% | 102% | NM | 65% |
| LTD | 7.5B | 6.5B | 11.3B | 18.7B | 27.8B | 23.1B | 19.2B | 24.7B | 45.5B | 41.7B |
| SHS | 4.6B | 4.4B | 4.3B | 4.2B | 4.2B | 4.3B | 4.3B | 4.3B | 4.3B | 4.3B |
Rev (Revenue), EPS (Earnings per share), DIV (Dividend), FCF (Free cash flow per share), POR (Payout ratio), LTD (Long term debt). SHS (Shares)
Some of the decline in revenue from 2014 is driven by a sharp decline in oil and gas prices, but not all. Even after the recovery in oil prices during 2021 the revenue number is still about 33% lower than the revenue number for 2012. Earnings per share similarly reflect prices but also a secular decline in volume. Free cash appears stronger than it is, using only the 2012 and 2021 numbers, to some degree reflecting less upstream expenditure, a fact noted in the linked Goehring Letter.
Dividends increased throughout the period, albeit at a slowing pace as the payout ratio tripled. Long-term debt increased by more than five times. Over the 2012-2021 period share buybacks were small. As the Luhavalja article on the XTO merger mentioned, the major period of buybacks was 2010 to 2012 in which XOM whittled down the number of shares from 5.1 billion to 4.6 billion in order to recapture the $30 billion worth of shares used in the merger.
In sum, Exxon Mobil has the look of a company fighting to make the most of its assets despite an orderly decline. The dividend seems safe for now and will likely increase slowly for several years, especially if oil prices remain high. The most important positive is that it is the only one of the oil majors to maintain a reserve-to-production ratio above 10. The most disturbing fact, and one to be watched closely, is the fact that an ESG group succeeded in replacing four members of the Exxon board. This suggests that XOM may no longer be able to take actions in the best interests of its shareholders, especially when it comes to drilling. Whether further restrictions on drilling are a net positive for global wellbeing is not a subject to engage here, although there is already some evidence that the current “tight” situation in energy is causing some rethinking. For now, Exxon is reduced to being a dividend stock, pure and simple, fighting the battle for survival on several fronts.
Occidental: The Narrative And The Numbers
The corporate culture at Occidental could hardly be more different from the classy conservatism of Exxon. The Wikipedia entry for Occidental is a compendium of erratic management decisions dating back to the 1957 ascension of CEO Armand Hammer. Hammer actually had some success building reserves by wheeling and dealing, including an asset swap of phosphate for oil with Russia and other deals struck with foreign governments. There were better options for reserve replacement in his day. To give OXY its due, it also took an interest in shale oil in 1972 making it one of the first oil companies to explore the new technique. Despite a few splashy successes, Hammer never really managed to develop either a strong corporate culture or a long-term strategy, at least in my opinion. OXY always looked like a company with potential but it lacked capital discipline and was run as a personal fiefdom of Hammer and his immediate successor, Ray R. Irani. Irani was ousted by the board in 2011 for excessive pay and lavish perks.
Vicki Hollub, a down-to-earth engineer from the production side, took over as CEO in 2016, becoming the first female CEO of a major oil and gas company. According to this long Texas Monthly article, the leaders of the oil and gas “boys club” refused to take her seriously. Hollub, whose experience was entirely on the operational side, made a stunning move in 2019 when OXY entered into a bidding war with Chevron (CVX) for Anadarko, an exploration and production company roughly the same size as OXY. Chevron is almost the same size as Exxon and struck a deal with Anadarko which had the potential to make it #1. They didn’t bother to inform Hollub, who had also been in talks with Anadarko. Hollub topped the Chevron bid and won the battle with the help of a cash infusion from Warren Buffett’s Berkshire Hathaway (BRK.A)(BRK.B). Buffett’s help came at a steep price in the form of a $10 billion preferred stock with an 8% yield and included the usual Buffett stock warrants. OXY ended up paying $72.34 per share largely in cash to top Chevron’s $65 per share of stock and cash. Everyone from institutional investors to business magazines to Carl Icahn felt OXY had overpaid.
The timing of the Anadarko purchase could not have been worse. The pandemic lockdown caused energy prices to crash and on April 20, 2020, the price of oil fell more than $37 per barrel into negative territory. Exxon was at least fortunate to have solid downstream operations and a disciplined corporate culture built over decades. It looked like one more Occidental catastrophe and one that produced a high probability of bankruptcy. Carl Icahn scooped up shares near the bottom and installed three members on the OXY board. OXY rushed to divest assets in order to survive.
Then the oil price bounced back from the April 20 low. It continued to rally as the economy reopened and entered a boom of sorts including a popular rush to travel. Oil became a hot commodity. Not only was OXY saved from bankruptcy, it was suddenly flush with cash. The table below provides hints about the scale of OXY’s turnaround and how it might continue in the future.
| 2012 | 2013 | 2014 | 2915 | 2016 | 2017 | 2018 | 2019 | 2020 | 2021 | |
| REV | 20.1B | 20.2B | 19.3B | 12.5B | 10.1B | 12.5B | 17.8B | 21.0B | 17.8B | 26.0B |
| EPS | 5.01 | 5.81 | 3.81 | (3.56) | (1.29) | .64 | 3.80 | .87 | (6.70) | 2.45 |
| DIV | 2.16 | 2.56 | 2.88 | 2.97 | 3.02 | 3.06 | 3.10 | 3.14 | .82 | .04 |
| FCF | 1.66 | 5.99 | .58 | (2.65) | (1.80) | 1.65 | 3.54 | 1.25 | 1.55 | 8.09 |
| POR | 46 | 26 | 359 | NM | NM | 179 | 57 | NM | NM | 36 |
| LTD | 7B | 7B | 7B | 7B | 10B | 9B | 10B | 39B | 36B | 29B |
| SHS | 810 | 804 | 781 | 766 | 764 | 766 | 763 | 819 | 919 | 959 |
There is very little use in attempting linear projection with the numbers because of the radical ups and down of recent years, first in oil prices alone and then in oil prices combined with the Anadarko deal. The things to focus on in the table have to do with OXY’s radically changed potential coming out of its near-death experience. The first number to notice is the 2021 figure for revenues. The same number for Exxon was down about one-third from 2012. With OXY it is up about 30%. That’s mainly the bump from Anadarko as the oil price for 2021 was actually lower than the price in 2012. The $29 billion jump in debt stems from the Anadarko deal, and the 140M jump in shares outstanding from 2019 to 2021 likewise largely reflects the shares used as part of the deal.
It’s not surprising that a good bit of the Q4 Earnings Call had to do with debt reduction along with the percentage of reserves replaced. These two factors tell the story of how OXY lucked out despite buying at what seemed the most inopportune time possible. Debt reduction is repeatedly cited as the most important ongoing financial goal and is specifically described as a higher cash flow priority than share repurchases. Debt reduction in 2021 was $6.7 billion. The first quarter objective is to reduce debt to $25 billion while the goal for the year is to drive debt down to the next “milestone” of $20 billion.
This aggressive debt reduction program suggests that by 2023-2024 the debt level (excepting the Berkshire Hathaway preferred) may be back to pre-merger levels. With share repurchases to follow it is the clear but unspoken purpose to treat the next few years as the payback period in which OXY’s capital structure returns to where it was pre-merger. A process like this is commonly used in merger calculations and the payback period defines the point where an acquisition has essentially paid for itself.
The operational side, meanwhile, appears to be doing its part. The most important fact, mentioned early in the CEO summary and featured prominently in slides, is that Occidental managed to replace 241% of reserves in 2021. Total reserves increased from 2.9 MM BOE to 3.5 MM BOE. Compared to the steady decline in reserves at Exxon and other oil majors, OXY’s increase in reserves makes the importance of the Anadarko acquisition clear. To accomplish all its goals, all OXY needs is for oil prices to do their part by staying reasonably high for a couple of years.
OXY Versus XOM: The Long Term And Short Term Performance In Two Charts
Many standard factor grades and ratings are less helpful than usual because of the somewhat chaotic results for companies in an industry dominated by a highly cyclical commodity. Oil prices have gone up and down and then up again wildly and presented an inescapable problem for both the companies and their analysts. Factor grades, for example, give both OXY and XOM an A+ for profitability. This is hard to understand for companies that are only one year removed from operating deeply in the red. The only true A+ is the overpowering gross margin on upstream operations and the huge cash from operations number. To get any grasp of the underlying story requires digging through the above tables with careful attention to the details.
The best visual comparison comes simply in two stock charts. The first, a 10-year chart, shows the gradual secular decline of the oil industry which correlates to the stock performance of both companies before the 2020 lockdown. In 2020 the oil collapse followed by a huge oil rally swept away all other factors. First the long term:
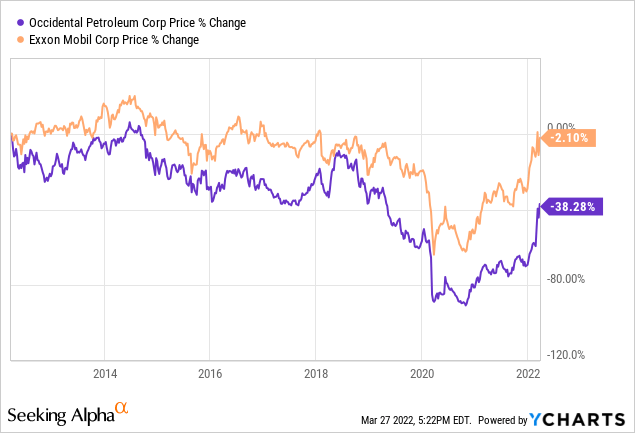
The above chart shows Exxon to be a more stable company than Occidental, although it is the stability of a giant company unable to overcome a long-term negative trend. OXY shares this decline with slightly greater volatility until the Anadarko merger. The long-term chart thus gives XOM the edge for stability which is likely to continue with a slow decline continuing for some years. The second chart takes a more immediate look at the performance from the beginning of 2021.
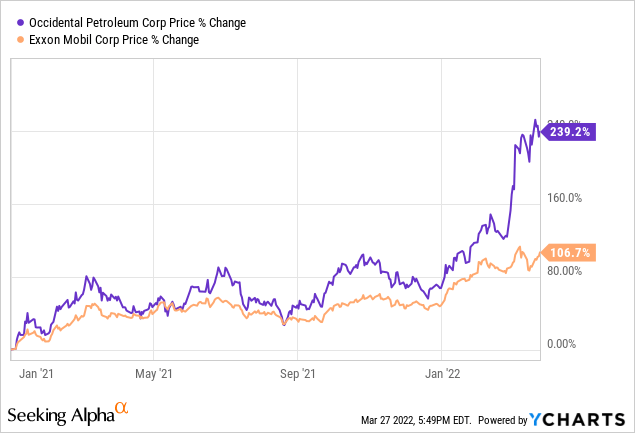
The period from January 1, 2021, coincides with the rising oil price. OXY stock tracks the oil price including the modest fall from its November high to the end of the year. The swift run-up in oil price beginning in January 2022 separates the performance of the two companies. Instead of stable, Exxon Mobil looks stodgy, unable to capitalize in an aggressive way. By January 2022 OXY’s crisis was behind it and the sudden price jump in 2022 shows the agility of a much smaller company which was able to take a risk and do something transformative. That’s one way to look at it. Perhaps reading the stock chart one can also see the heavy foot of Warren Buffett snatching up OXY stock.
What Warren Buffett May See In Occidental
Occidental is not quite a classic value stock. What it provides is a hedge against commodity-driven inflation and a call option designed to capitalize on oil prices which stay high for a while. Now that OXY has withstood the worst, the rewards are asymmetrically in favor of a large return if things go even a little bit right. That’s the sort of situation which has been known to appeal to Warren Buffett.
Buffett clearly has a current interest in energy. He has owned Exxon Mobil within the last decade but sold the entire position. More recently Berkshire Hathaway bought a stake in Chevron and its most recent 13F filing showed that the position had increased to about 38 million shares currently valued at $6.5 billion. That’s about 2% of Chevron. The same filing revealed a holding of 140 million OXY shares currently worth about $8.4 billion, or 14.6% of Occidental. That’s a large enough stake that some articles have speculated about OXY being a potential takeover candidate for Berkshire. It certainly amounts to a substantial piece of a company which seemed close to bankruptcy less than two years ago.
The original deal with which Berkshire helped enable the Anadarko deal was just under $10 billion in the form of 100,000 shares of preferred stock at an 8% interest rate. On top of the interest income, Berkshire received 80,000 warrants to buy OXY common stock at the price of $62.50 per share, close to what it was trading for at the time. As the oil price collapsed OXY stock collapsed with it, briefly trading below $10 per share. What had made the deal palatable for Buffett was the fact that preferred stock came before common in the event of bankruptcy and there was a good chance of coming out OK even if common shareholders were wiped out. When OXY paid the 8% dividend in shares rather than cash near the oil market bottom, Buffett sold them immediately implying that he thought it possible that OXY might indeed go bankrupt.
Little by little, it became clear that OXY was a survivor and possibly a big winner. Buffett grasped the implication of the numbers and began to buy. If oil prices held up for a year or two the debt created to buy Anadarko would disappear. Even if oil resumed its historic cyclicality, OXY would reap the full benefits of the merger and continue to thrive. The combined OXY and Anadarko holdings in the Permian basin would be profitable and sustain dividends at an oil price as low as $40 per barrel (a number reiterated by Vicki Hollub at the Q4 Earnings Call), and the new Occidental would be in business with twice its previous shale reserves.
What did Buffett have in mind as he bought? Will he eventually make a bid for OXY? The odds are hard to calculate. An acquisition would involve a bid above market price, leaving little margin for error. How would CEO Vicki Hollub feel about becoming head of a Berkshire subsidiary? Do the corporate cultures fit? Maybe, maybe not. What Buffett undoubtedly saw was that OXY stood a good chance of returning to its pre-pandemic price in the 80s as a minimum. It would soon return to paying a healthy dividend. By turning his warrants into common shares Buffett would be very close to owning 20% of OXY which is the ownership threshold at which the dividend reduction rate of 65% kicks in. Dividends from OXY would then be taxed at a minimal 7% rate – the same situation Berkshire enjoys with Kraft Heinz (KHC).
But what if oil declined dramatically once again? Toward the end of February, a number of sources including this Barron’s piece pointed out the fact that Brent futures contracts were in the most extreme backwardation ever. Backwardation means that contracts settling in future months are going for a lower price than those in near months. The futures market is betting on a decline in price. (The normal condition is contango, when futures prices are higher than present prices.) The April contract for Brent crude was going for $98.55 while the October contract was going for $87.81.
The market may well be right about this, although in fact, the oil price has risen since late February to $113.90 as of last Friday. This increase pulled the entire futures curve up with it, although it remained in backwardation. Yet even if the market fell to the prior October contract price of $87.81, the impact on Occidental would be acceptable. Throughout 2021, when OXY enjoyed record free cash flow and reduced overall debt by $6.7 billion, the price of oil had ranged from a low of $47.62 to a high of $84.65, ending the year at $75.21. The average oil price in 2021 was $68.17. OXY, in other words, has quite a significant margin of safety when it comes to the intermediate future of oil prices.
For Buffett, OXY is the perfect hedge. If the present era proves to be an extended period favoring commodities and the inflation that comes with them, OXY will occupy a helpful niche in Berkshire’s portfolio. The likelihood that relatively high oil prices will continue for at least a year or two provides the margin of safety that he likes. The preferred stock deal with attractive warrants is similar in outline to the deal Buffett struck with Bank of America (BAC) in 2011, when his imprimatur assured its survival. The fact that he continues to add to his position also resembles his actions once BAC was out of the woods but still a bit suspect as far as the market was concerned. One did well to follow Buffett on Bank of America and might do well to follow him on OXY as well.
Is XOM Or OXY Stock The Better Buy?
There’s no doubt where Buffett stands on this question. Then again. he started with a deal you and I can’t get and can probably look forward to a solid OXY dividend with a tax treatment that you and I also can’t get. Exxon will give you that dividend starting right now, and the higher oil prices which have juiced the performance of OXY make the Exxon dividend look more secure for a longer period. For conservative dividend investors, it’s hard to choose against XOM.
Where OXY shines is in its potential it has to win big in several ways. Exxon is a stable business pulling oil out of the ground, processing it, and selling it in a variety of forms from aviation fuel to chemicals. OXY is a company defined by a single risky act which transformed its future prospects with a tremendous increase in reserves. Its oil in the ground serves as a hedge against commodity inflation and a call option on oil prices. It has already proved its ability to survive under the worst of conditions. It can juice its profits by cost-cutting and debt reduction. Share repurchases and much higher dividends are probably in the not-too-distant future.
Because the oil industry is so cyclical and may also face secular decline, neither Exxon Mobil nor Occidental should be considered core positions in your portfolio. OXY seems to me the most interesting as a niche position offering leverage. Where it beats XOM is in offering more bang for the buck. Consider following Buffett. OXY is the better buy as an inflation hedge and a leveraged call on oil prices.
Be the first to comment