

Evgenii Mitroshin
The oil and gas markets in the fourth quarter of 2022 were not as strong as in the previous quarters. Thus, despite higher production volumes, due to significantly lower oil and gas prices, I expect Occidental Petroleum Corporation’s (NYSE:OXY) 4Q 2022 financial result to be weaker than in 3Q 2022. Also, I don’t expect the company’s 1Q 2023 financial results to be stronger than in 4Q 2022. However, due to falling oil inventory levels in the world and China’s reopening that support oil prices, and increasing oil and gas production in the Permian region, OXY’s financial results in the second quarter of 2023 should improve. Furthermore, the company’s leverage ratios indicate that Occidental Petroleum has a healthy ability to cover its current and future obligations. Occidental Petroleum Corporation stock is a hold.
Quarterly results
In its 3Q 2022 financial results, OXY reported a 3Q 2022 net income of $2546 million, compared with a 2Q 2022 net income of $3555. Occidental’s income from operating operations decreased from $3755 million in 2Q 2022 to $2746 million in 3Q 2022, driven by lower domestic oil & gas sales. The company’s daily production volume (worldwide) increased from 1147 MBOE/d in 2Q 2022 to 1180 Mboed in 3Q 2022 (exceeded production guidance midpoint by 25 Mboed)
OXY’s worldwide sales increased from 1150 Mboed in 2Q 2022 to 1179 Mboed in 3Q 2022. The company’s oil realized price decreased from $107.72/Bbl in 2Q 2022 to $94.89/Bbl in 3Q 2022. Also, its NGL realized price decreased from $42.04/Bbl in 2Q 2021 to $35.22/Bbl in 3Q 2022. Finally, OXY’s domestic gas realized price increased from $6.25/Mcf in 2Q 2022 to $7.06/Mcf in 3Q 2022. The company increased its capital expenditures from $972 million in the second quarter of 2022 to $1147 million in the third quarter of the year. It is worth noting that OXY’s capital expenditures in the first nine months of the year 2022 were $107 million higher than in the full-year 2021. The company’s operating cash flow decreased from $5329 million in 2Q 2022 to $4247 million in 3Q 2022. Again, OXY’s operating cash flow in the first nine months of 2022 was $2582 million higher than in the full-year 2021.
“The excellent operational performance of our businesses in the third quarter was a key driver of our strong financial results, enabling us to raise our full-year guidance for all of our business segments and generate free cash flow to advance our shareholder returns and deleverage our balance sheet,” the CEO commented.
The market outlook
According to EIA’s short-term energy outlook, total world petroleum and other liquids production increased from 101.02 mb/d in 3Q 2022 to 101.29 mb/d in 4Q 2022. EIA projects that total world production to decrease to below 101 mb/d in the first half of 2023. However, in the second half of 2023, total world petroleum and other liquids production will increase again (see Figure 1). U.S. petroleum and other liquids production in 4Q 2022 is higher than in 3Q 2022. Also, it is expected to increase further in the first half of 2023.
Figure 1 – International petroleum and other liquids production and consumption
EIA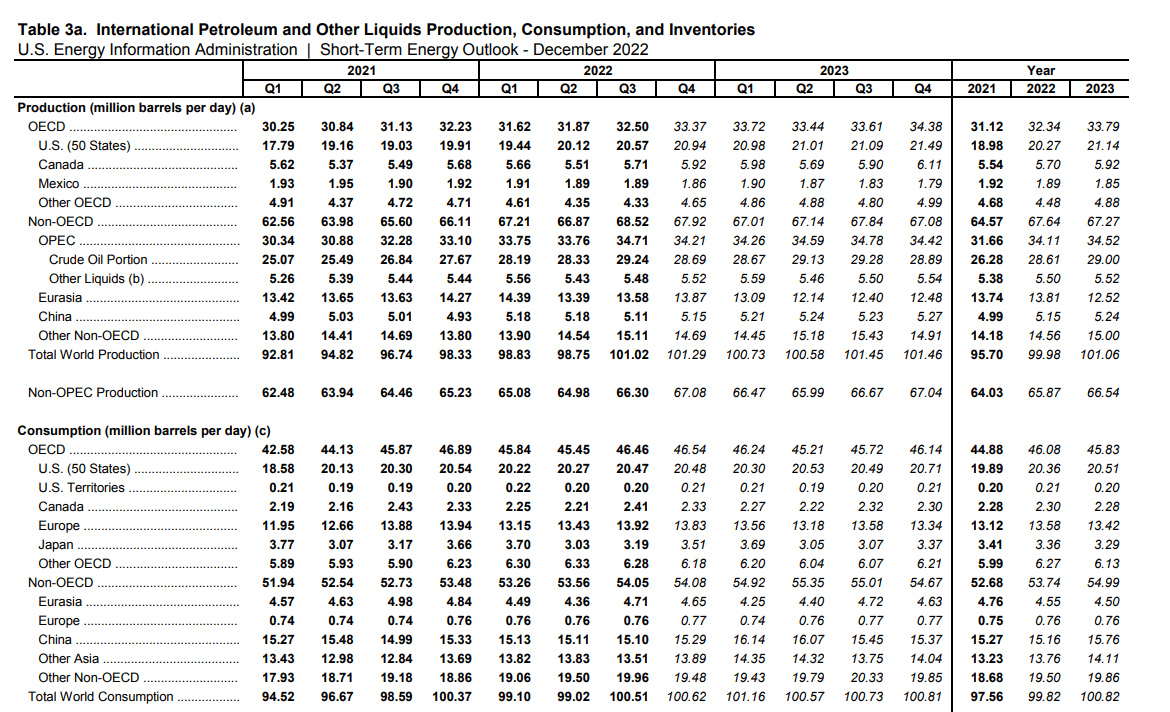
In the first nine months of 2022, OXY’s U.S. oil and gas production per day was 80% of its total production (see Figure 2). Also, OXY’s oil and gas production is mainly affected by the company’s continuing operations in the Permian Basin. According to EIA’s drilling productivity report, oil production in the Permian Basin in January 2023 is projected to be 37 thousand barrels per day higher than in December 2022. Also, gas production in the Permian Basin is projected to increase by 119 million cubic feet per day in January (see Figure 3). Thus, I expect OXY’s oil and gas production in 4Q 2022 to be higher than in 3Q 2022. Also, I expect the company’s oil and gas production to increase further in 1H 2023.
Figure 2 – OXY’s oil & gas production volumes
3Q 2022 financial results
Figure 3 – Oil and gas production in the Permian region
EIA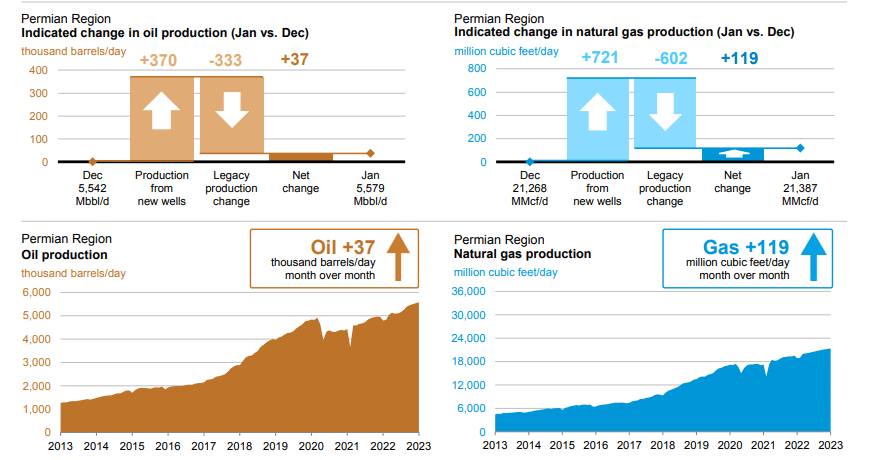
Due to the global recession, the demand outlook for oil is not strong. Thus, crude oil prices will not increase to their significantly high levels in the first nine months of 2022. According to EIA, Brent crude oil spot price in 4Q 2022 is 10% lower than in 3Q 2022. However, due to falling global oil inventories in early 2023 (see Figure 4), China’s reopening, and OPEC+ further production cuts, crude oil prices are supported. Brent crude oil spot price is projected to remain below $90 per barrel in 1Q 2023. However, it is expected to increase in the second quarter of 2023. Moreover, according to EIA, Henry Hub’s natural gas price in 4Q 2022 was significantly lower than in 3Q 2022. As a result of rising natural gas production in the United States, decreased natural gas prices in the European Union (see Figure 5), and the EU’s recent measures to combat the energy crisis, Henry Hub’s natural gas prices in 2023 should be lower than in 2022. However, it is worth noting that due to the winter demand, Henry Hub’s natural gas price in 1Q 2023 may be higher than in 4Q 2022.
Figure 4 – Brent crude oil spot price and global inventory changes
EIA
Figure 5 – Dutch TTF natural gas price
tradingeconomics.com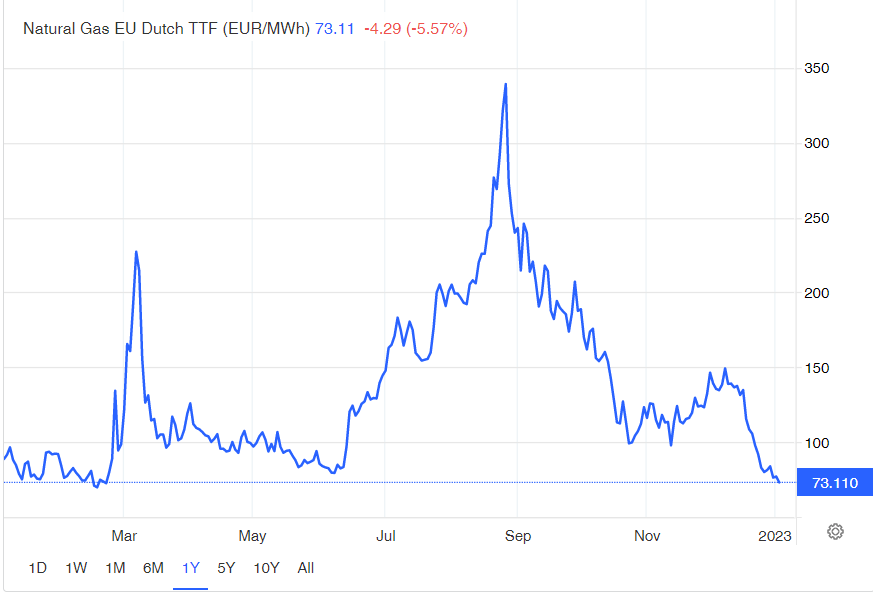
OXY performance outlook
In the following section, I provided some leverage and return ratios to illustrate the credit ratings of Occidental Petroleum Corporation. In the energy sector, one key way for investors to keep an eye on each company’s performance outlook is by considering their debt levels. Since the sector is capital-intensive, high debt levels may lead to a lower ability to purchase new equipment or meet other obligations. Thus, I catered to specific leverage ratios to assess the financial health of an energy company.
Figure 1 shows OXY’s net debt-to-EBITDA ratio during the recent quarters. This ratio determines the probability of defaulting on issued debt, and as energy companies often have a great amount of debt on their balance sheet, this ratio could be of help to determine how many years of EBITDA would be necessary for Occidental Petroleum to be able to pay back its debt. It is observable that the company’s net debt-to-EBITDA has been almost on decreasing path through the previous year. Its amount was less than 4x, which is over half year-over-year compared with its level of 9x at the end of September 2021 (see Figure 6).
Figure 6 – OXY’s debt-to-EBITDA
Author (based on SA data)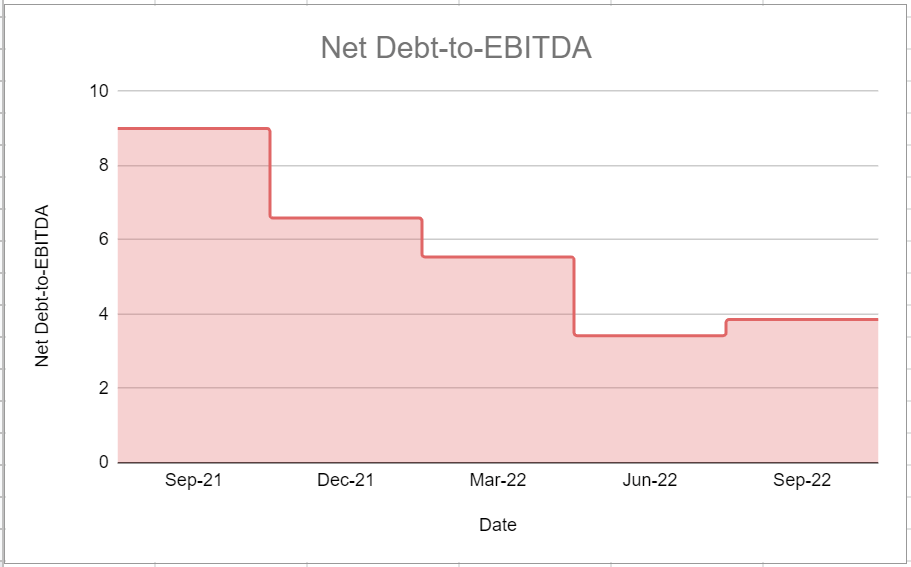
Moreover, Figure 2 is a picture of the company’s debt-equity or risk ratio. The debt-to-equity ratio is a leverage ratio that measures the weight of total debt and financial liabilities compared with total shareholders’ equity. Generally, this ratio determines whether a company’s capital structure is toward debt or equity financing. Figure 2 indicates that during recent quarters OXY had the lowest amount of debt-to-equity ratio in the third quarter of 2022. Its amount sat at 0.75x at the end of September 2022 year-over-year compared with 1.76x in the third quarter of 2021. Moreover, the company’s risk ratio decreased by 10% from 0.84x in the second quarter of 2022 (see Figure 7).
Figure 7 – OXY’s debt-to-equity ratio
Author (based on SA data)
On the other hand, to represent the ability of Occidental Petroleum Corporation to cater returns to its shareholders, I have investigated its return on assets. The return on assets ratio reflects how much profit a company is able to generate for every dollar of its assets. ROA of OXY was on a decreasing path in 2022 and sat at 4% at the end of the third quarter versus its previous levels of 5% and 8% at the end of the first and second quarters, respectively (see Figure 8).
Figure 8 – OXY’s ROA ratio
Author (based on SA data)
Summary
Occidental Petroleum Corporation’s oil realized oil price in 4Q 2022 is lower than in the previous quarter, and I don’t expect it to increase in 1Q 2023. However, oil prices should increase in the second quarter of 2023 due to lower inventory levels and China’s reopening. Also, Occidental Petroleum Corporation’s leverage ratios improved in 2022, implying the company is healthy. Occidental Petroleum Corporation is a hold.
Be the first to comment