

dszc
Introduction
On Friday, August 19, 2022, Warren Buffett’s Berkshire Hathaway (BRK.B, BRK.A) won approval to buy an equity stake of up to 50% in Houston-based Occidental Petroleum (NYSE:OXY).
The Federal Energy Regulatory Commission approved the request from Warren Buffett’s Berkshire Hathaway and said it was “consistent with the public interest” and subject to various conditions.
Furthermore, Berkshire disclosed it bought 6.68 million common shares of Occidental, representing a stake of 20.1% (based on 939.2 million basic shares outstanding). Berkshire acquired OXY shares in the range of $57 to $60. One crucial element is that Buffett has rarely bought OXY above $60. Berkshire now owns 188.366 million shares of OXY.
The 20% threshold is meaningful for Berkshire Hathaway because the company can incorporate a proportional amount of the OXY’s earnings in its financial results – valid to sub-20% holding – potentially raising its annual earnings by about $2 billion.
It was an important motivation to cross the 20% level for Buffett’s Berkshire Hathaway, and it made sense. However, I was not expecting Berkshire to acquire a much more significant stake. I was surprised by the 50% equity stake approval, which was not immediately logical unless Berkshire intended to exercise the warrants. And I think it was the key here.
In this case, it would make more sense because it could exercise them below $60 (which is the price Buffett is willing to pay) and increase Buffett’s Berkshire Hathaway stake from 20.1% to potentially 26.6% (based on 939.20 million shares plus the new 83.859 million additional). The 26.6% is above the 25% threshold authorized previously, which justifies an increase of 50%.
A reminder, Buffett’s Berkshire Hathaway owns preferred stocks with an 8% interest payable every quarter and can be paid either in cash or shares. Also, a crucial element here is that they came with warrants for 83.859 million at an exercise price of $59.624 per share (see SEC Form 4 filing link indicated above).
The warrants were issued on August 8, 2019 and are exercisable at the applicable holder’s option, in whole or in part, until the first anniversary of the date on which no shares of the issuer’s series A preferred stock remain outstanding, at which time the warrants expire.
As expected, OXY rallied strongly on the news and closed on Friday at just below $71.29, which was a strong signal for me to sell most of my remaining position keeping only 5% of my initial investment. Thank you, Monsieur Buffett.
Also, on August 3, 2022, Occidental Petroleum released its second-quarter 2022 earnings results. I will detail the results to show why I decided to exit OXY above $71.20, keeping less than 5% of my initial holding.
Per my preceding article, I have indicated that I sold about 30% just above $64, including my trading position, which means I sold another 65% on Friday.
It doesn’t mean I will not buy back shares in the future, but I am not willing to jeopardize my gain while oil prices are dropping, and we may face a severe recession by 2023 triggered by the FED’s hawkish attitude towards inflation.
Moreover, Buffett’s Berkshire Hathaway has demonstrated what it considers the company’s fair value by rarely buying above $60. Thus, I will start buying back slowly below $60 again.
Finally, technically we have reached a double top at $72.
Stock Performance
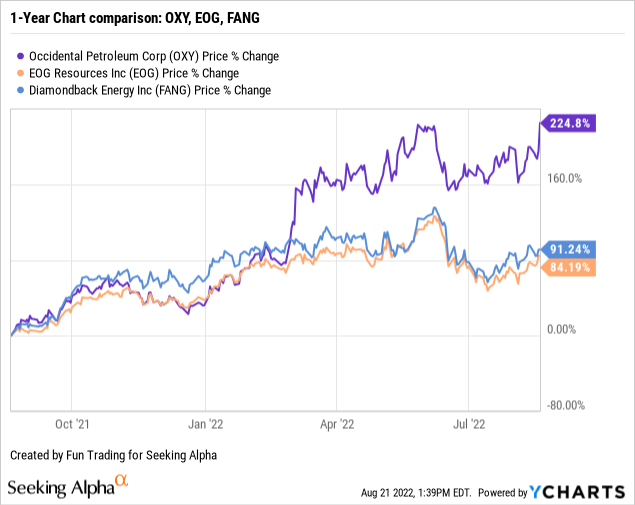
Occidental Petroleum has outperformed its peers and is up 225% on a one-year basis. The excellent recovery was led by higher commodity prices, reaching over $130 per barrel, and predominantly Buffett’s increasing its stake in the company to 20.2%.
Occidental Petroleum – 2Q’22 Quarterly Financial Table: The Raw Numbers
| Occidental Petroleum | 2Q21 | 3Q21 | 4Q21 | 1Q22 | 2Q22 |
| Revenues in $ billion | 5.96 | 6.79 | 7.91 | 8.35 | 10.68 |
| Total Revenues and others in $ Billion | 6.01 | 6.82 | 8.01 | 8.53 | 10.74 |
| Net income in $ Million | 103 | 828 | 1,537 | 4,876 | 3,755 |
| EBITDA $ Million | 2,720 | 3,582 | 4,381 | 5,097 | 6,627 |
| EPS diluted in $/share | -0.10 | 0.65 | 1.37 | 4.65 | 3.47 |
| Operating cash flow in $ Million | 3,314 | 3,118 | 3,092 | 3,239 | 5,329 |
| Capital Expenditure in $ Million | 717 | 645 | 757 | 897 | 1,001 |
| Free Cash Flow in $ Million | 2,597 | 2,473 | 2,335 | 2,342 | 4,328 |
| Cash and cash equivalent $ Billion | 4.57 | 2.06 | 2.76 | 1.91 | 1.36 |
| Total debt in $ Billion | 35.35 | 30.92 | 29.43 | 25.87 | 21.56 |
| Dividend per share in $ | 0.01 | 0.01 | 0.13 | 0.13 | 0.13 |
| Shares outstanding (diluted) in Million | 934.2 | 957.7 | 972.6 | 936.70 | 1,018* |
| Oil Production | 2Q21 | 3Q21 | 4Q21 | 1Q22 | 2Q22 |
| Oil Equivalent Production in K Boe/d | 1,203 | 1,160 | 1,189 | 1,079 | 1,147 |
| Global oil price (world) ($/b) | 64.18 | 68.74 | 75.39 | 91.91 | 107.72 |
| Global Natural gas price (world) ($/MMBtu) | 2.34 | 2.89 | 3.86 | 3.66 | 5.03 |
Source: Occidental Petroleum and Fun Trading
* Basic shares outstanding in 2Q22 was 939.20 million.
Short Analysis: Revenues, Free Cash Flow, Net Debt, and Oil & Gas Production
1 – Quarterly revenues and others were $10,735 million in 2Q22 (net sales were $10,676 million)
OXY Quarterly Revenues history (Fun Trading)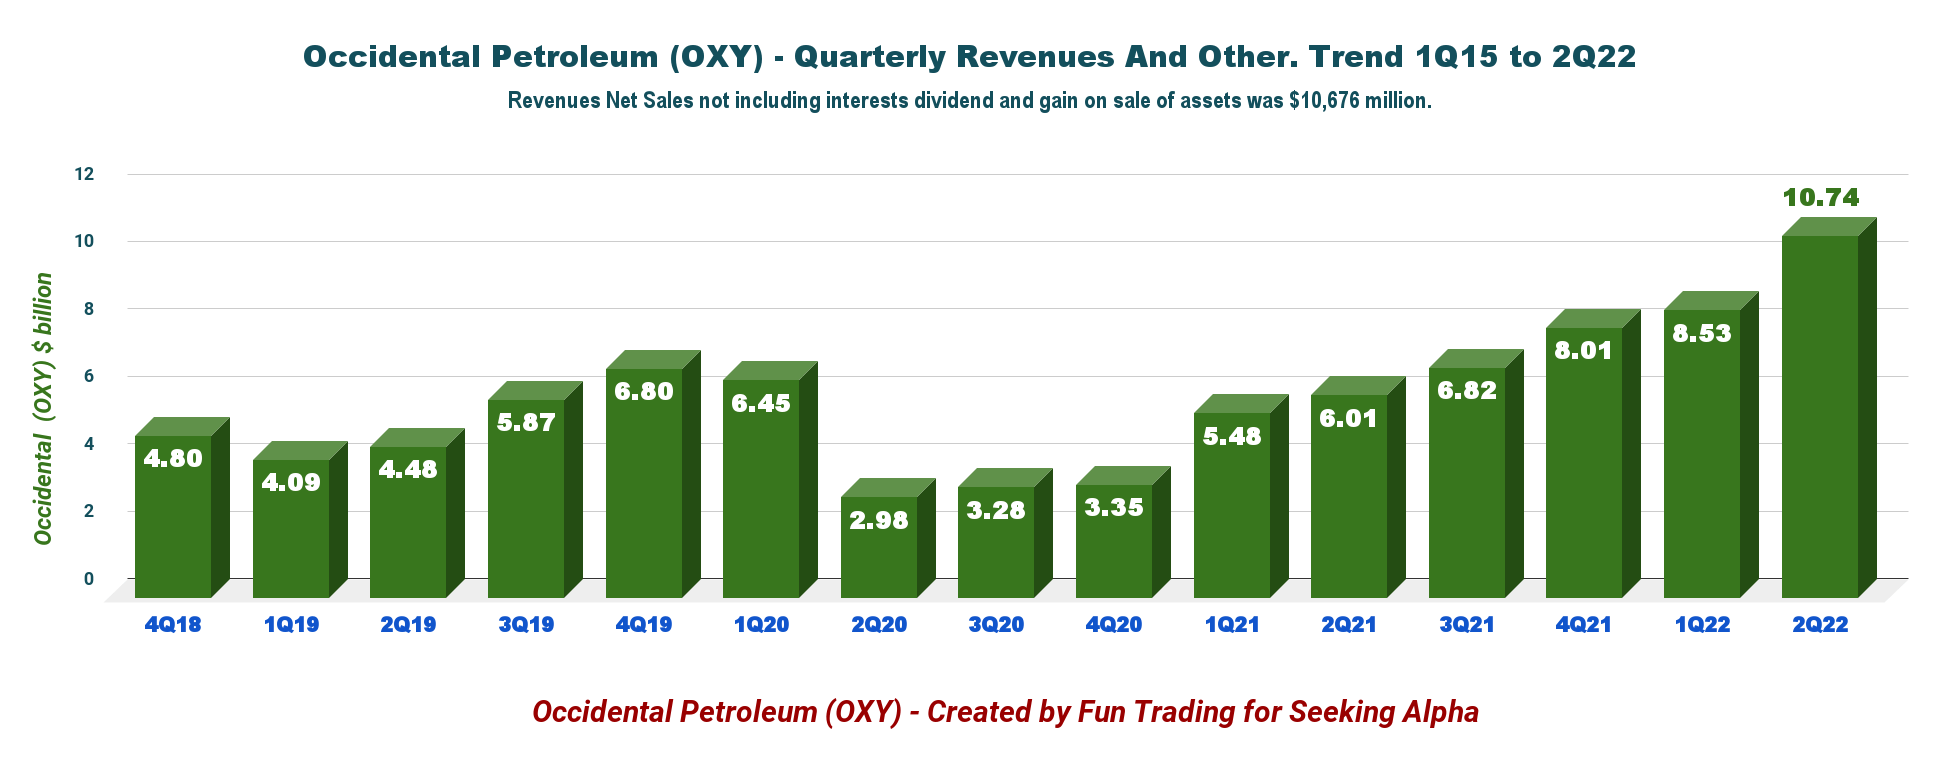
Occidental Petroleum’s 2Q22 total revenues and others were $10.735 billion, up significantly from $6.01 billion a year ago and up 25.9% QoQ. Excellent results driven by high commodities prices and higher margins.
- Oil and gas pre-tax income on continuing operations for the second quarter of 2022 was $4.1 billion, compared to pre-tax income of $2.9 billion for the first quarter of 2022.
- Chemical pre-tax income of $800 million for the second quarter of 2022 exceeded guidance of $775 million.
- Midstream and marketing pre-tax income was $264 million for the second quarter of 2022, including net derivative gains of $96 million. WES equity income was $159 million in 2Q22.
2 – The free cash flow was $4,328 million in 2Q’22
Free cash flow was $4,328 million in 2Q’22 compared to $2,597 million in 2Q’21. Trailing 12-month free cash flow is $11,478 million.
OXY Quarterly Free cash flow history (Fun Trading)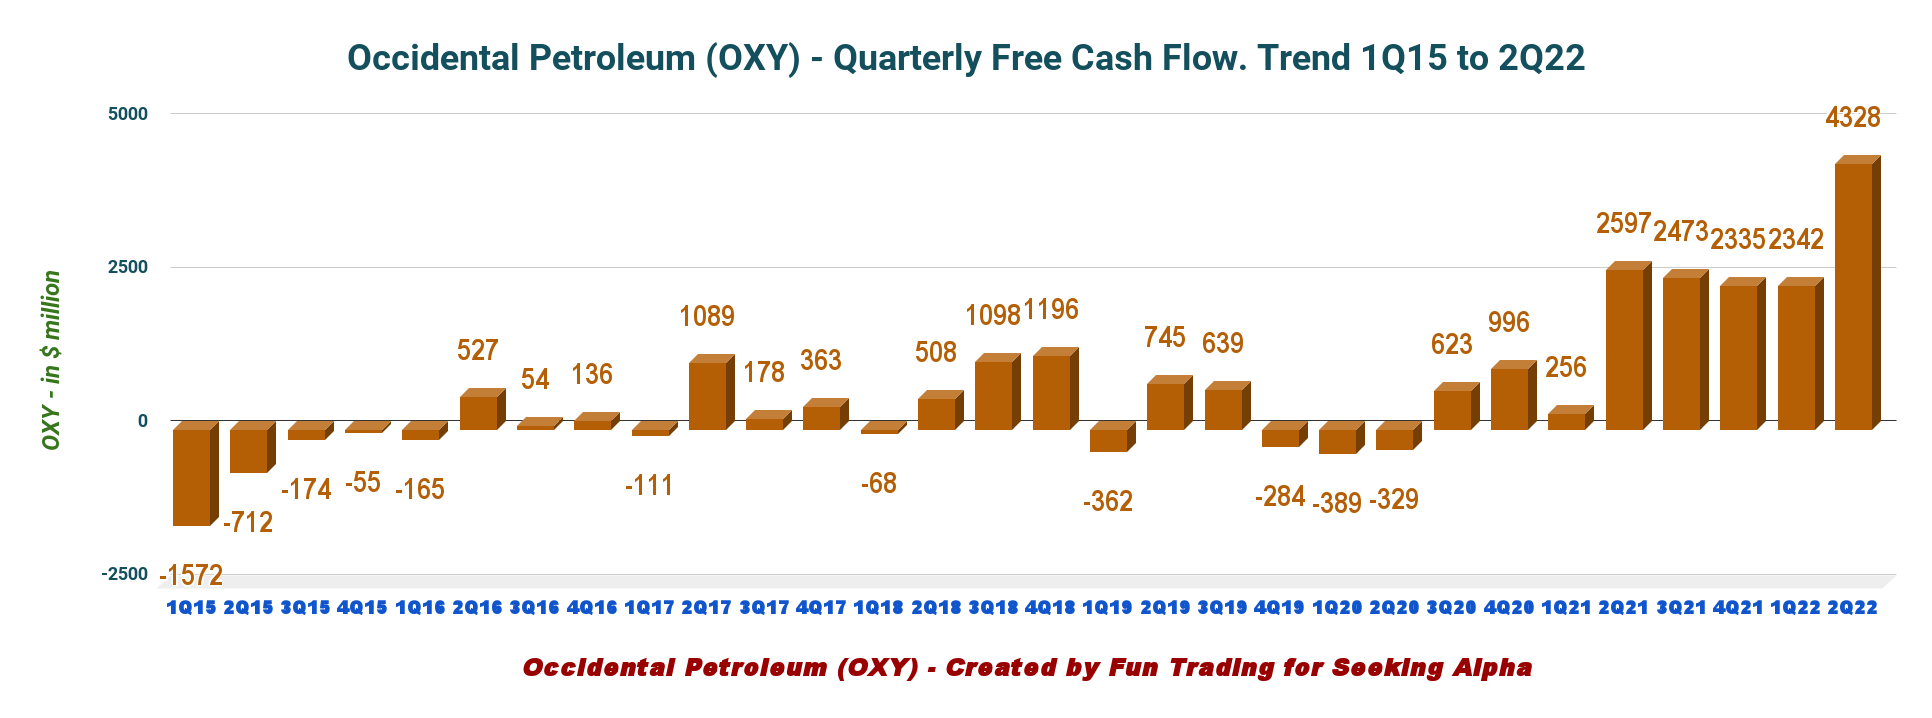
Occidental repurchased over 18 million shares for approximately $1.1 billion through August 1, 2022.
3 – Net debt is down to $20.2 billion at the end of June 2022
Good ongoing progress here. Occidental Petroleum cut the debt to a more acceptable level. The company’s net debt is now $20.2 billion as of June 30, 2022. OXY repaid $4.8 billion of debt, representing 19% of the total outstanding principal in 2Q22.
OXY Quarterly Cash versus Debt history (Fun Trading)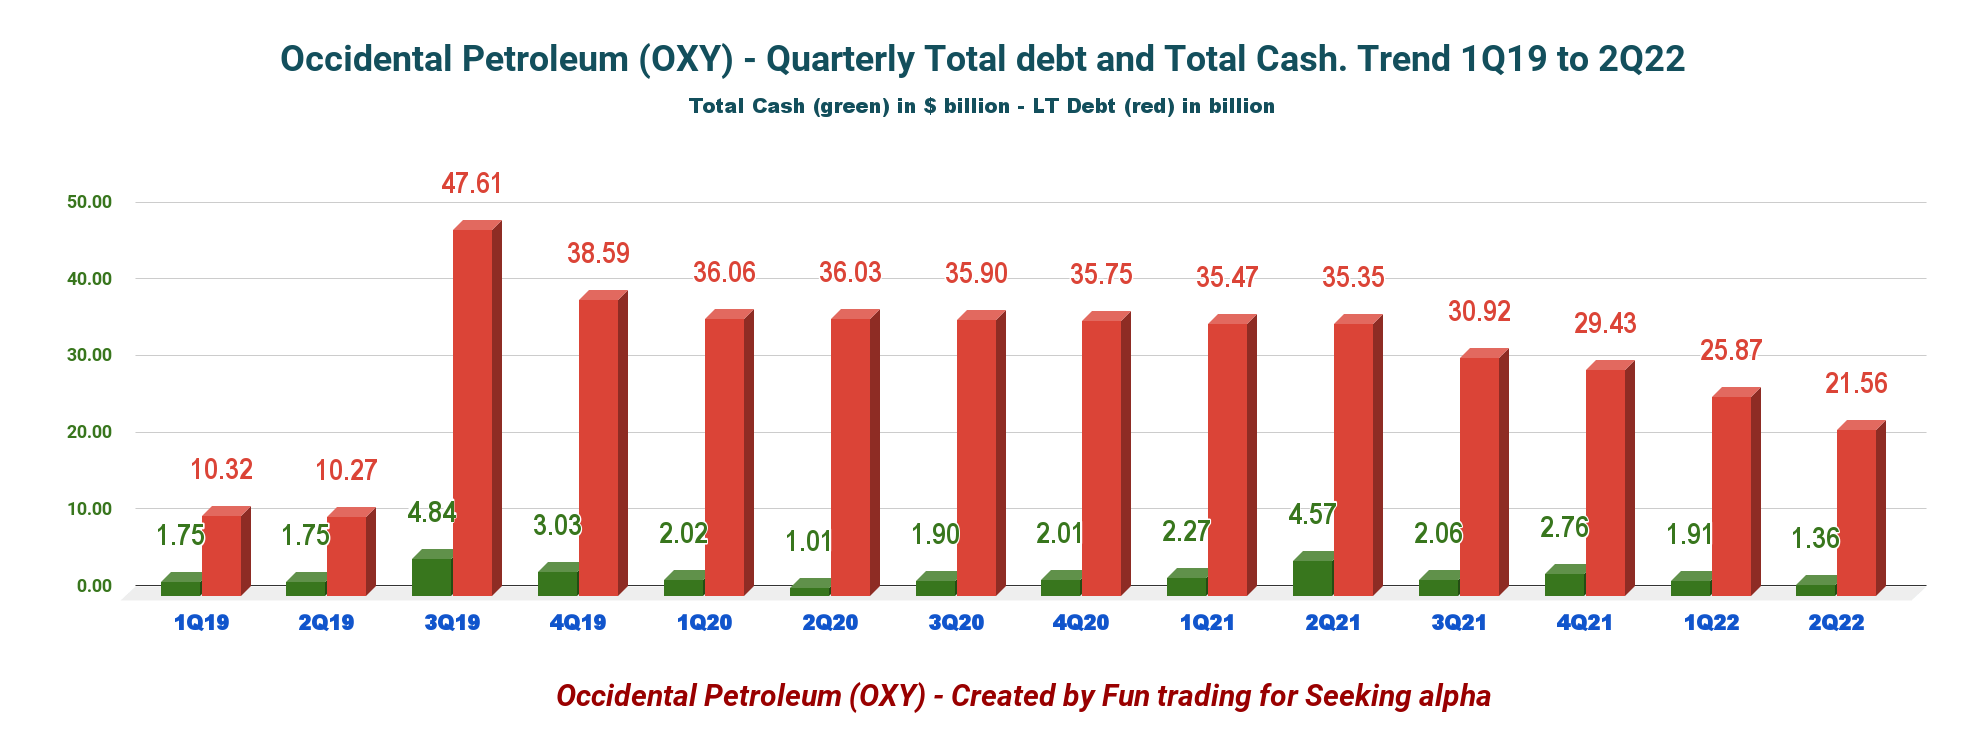
4 – Quarterly production was 1,147K Boepd in 2Q22
4.1 – The total output was 1,147K Boep/d in 2Q22. The Permian operations accounted for about 41.2% of the company’s total production. OXY’s output was down 4.7% compared to the same quarter a year ago.
OXY Quarterly Production equivalent history (Fun Trading)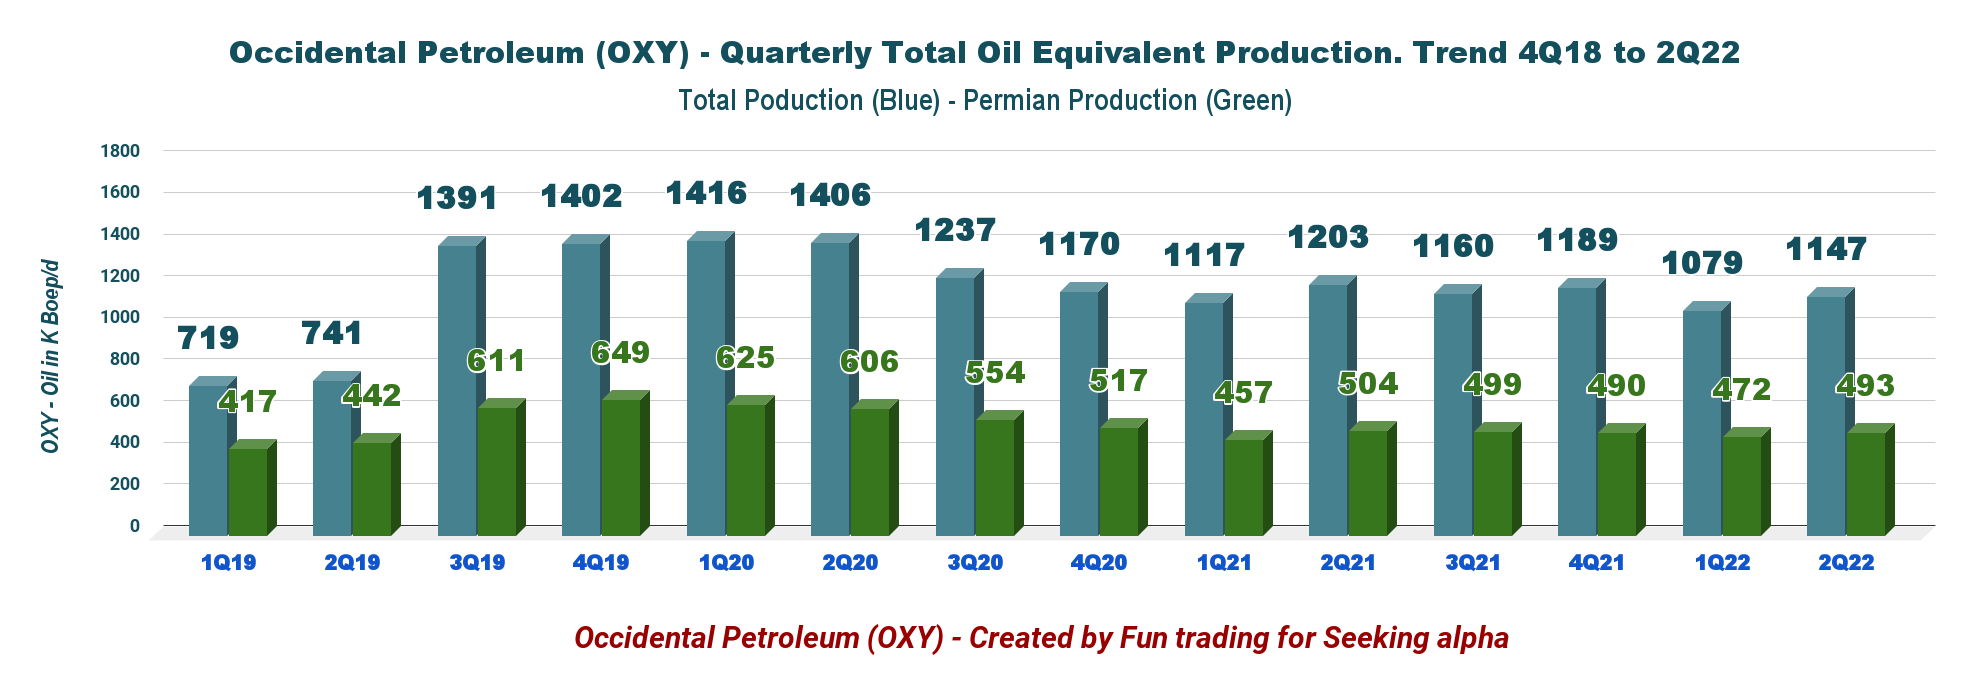
4.2 – Production in the USA totaled 919K Boep/d (including the Permian Basin production), up from 896K Boep/d in 1Q22.
The entire production in the USA represents the Gulf of Mexico, the Permian Basin, the DJ Basin in Colorado, and others.
4.3 – Production for the second quarter was 53.3% of oil.
OXY Quarterly production Oil, NGL, NG in 2Q22 (Fun Trading)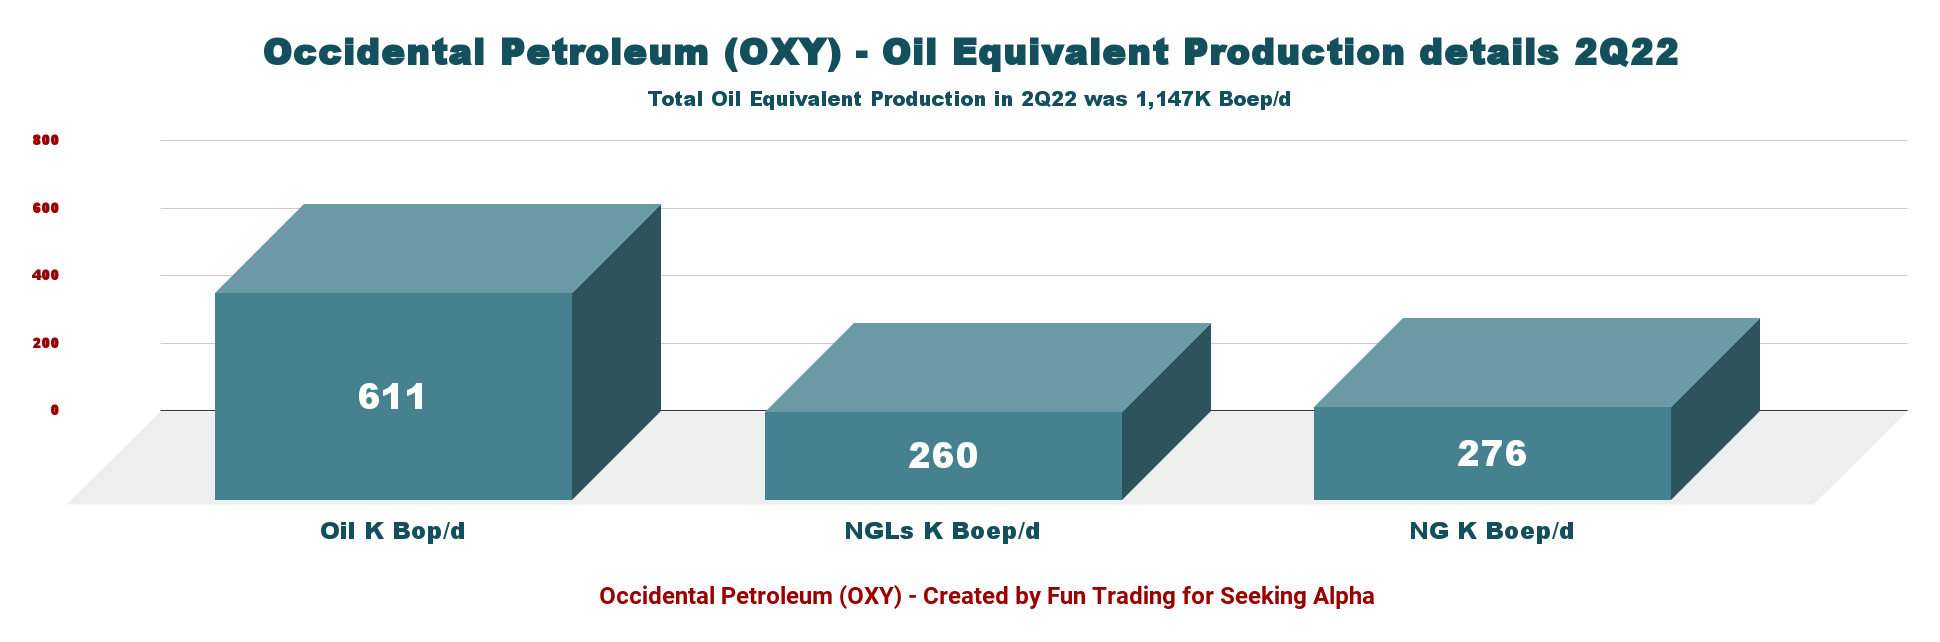
4.4 – Realized oil prices in 2Q22 were $107.72 per barrel compared to $64.18 last year. Natural gas was $5.03 per Mcf, up from $2.34 in the previous year. NGL price was $42.04 per Boe, up from $25.06 last year.
OXY Quarterly oil and gas history (Fun Trading)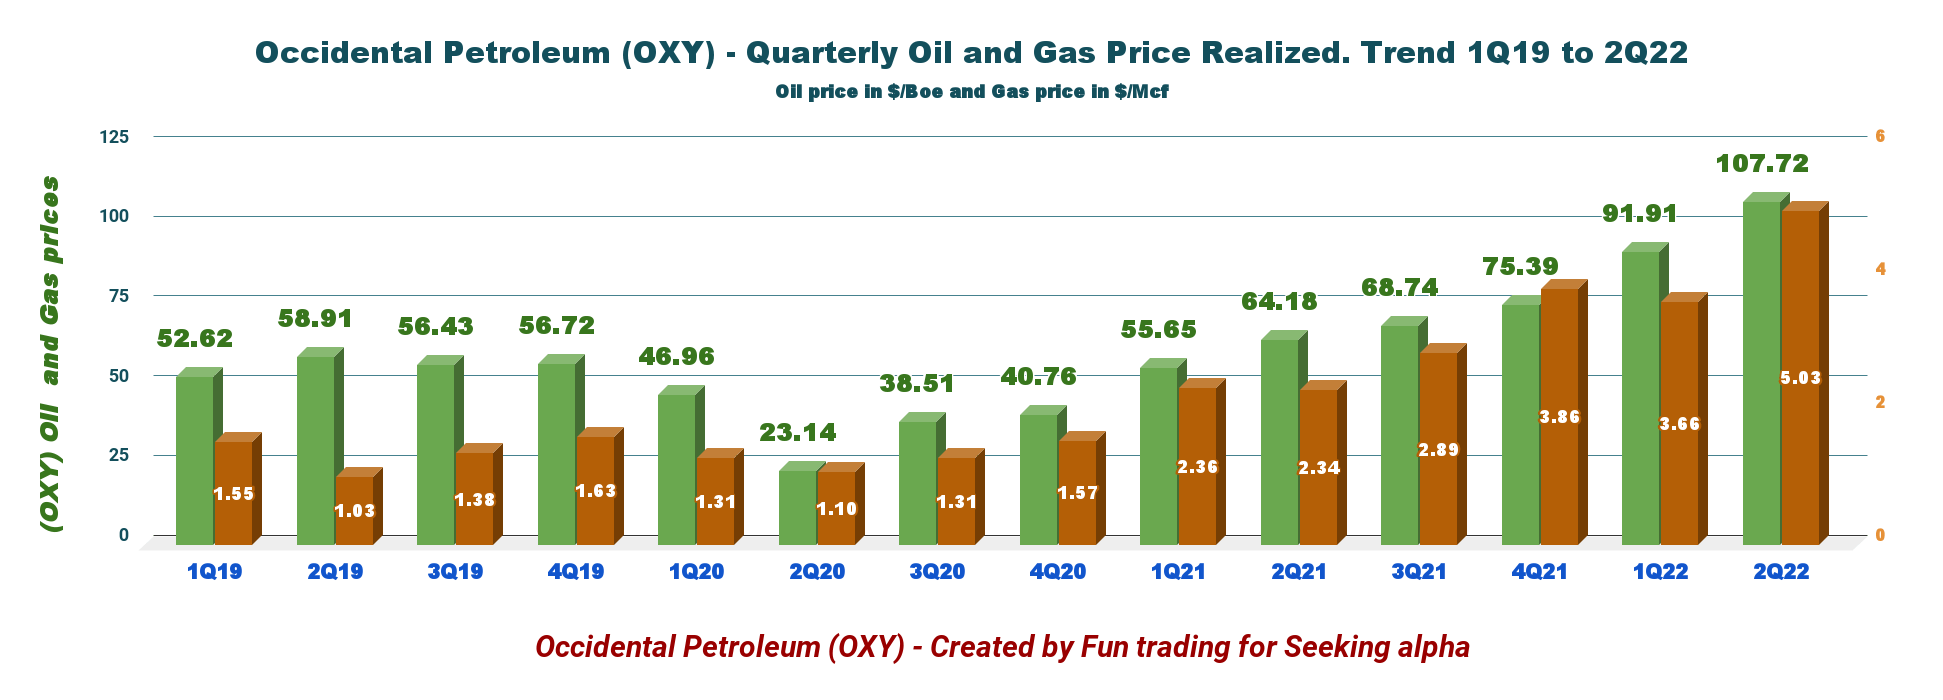
Note: Total production in the Permian Basin includes the Permian Resources, and the Permian EOR is consolidated.
Commentary and Technical Analysis (Short Term)
OXY TA chart short-term (Fun Trading)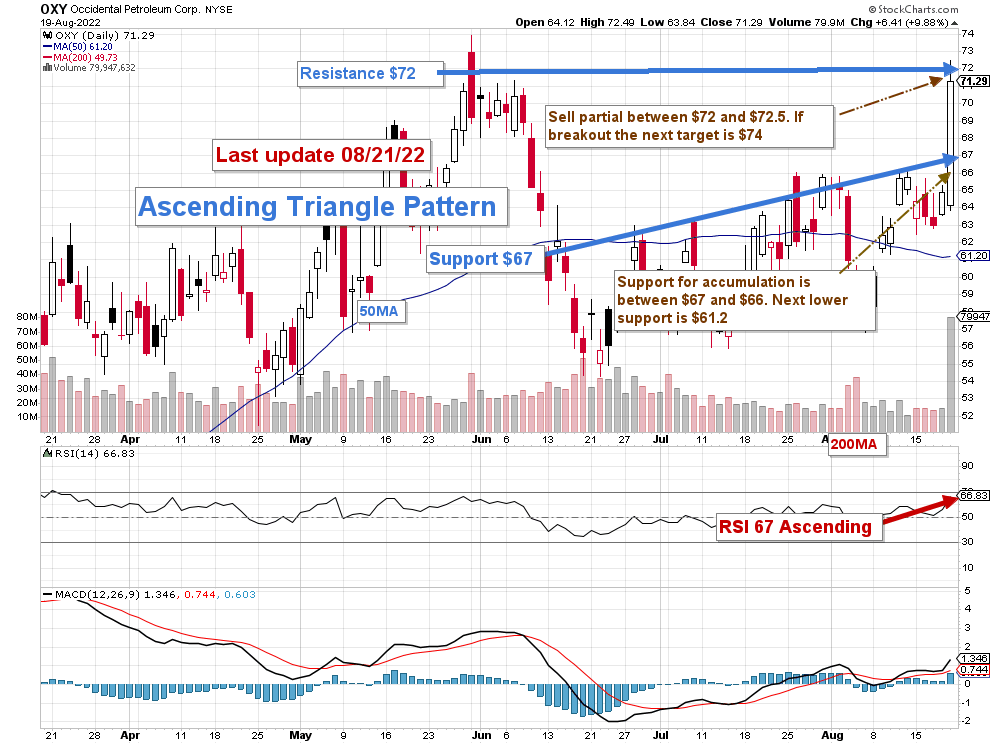
Note: The chart is adjusted for the dividend.
OXY forms an ascending triangle pattern with resistance at $72.0 and support at $67. Ascending triangles are bullish formations that anticipate an upside breakout.
As indicated in my preceding article, the trading strategy is to take profits (25%-50% seems reasonable) between $72 and $72.5 and wait for a retracement below $67 with potential lower support at $61.25 to consider adding again. Technically, the pattern may indicate a breakout to potentially $74-$76.
However, I nearly sold out my entire position on Friday at just above $71.25, and I am delighted with my decision and the staggering profit. I will occasionally trade OXY but will not add to my long remaining position until I see a sufficient retracement.
I recommend trading OXY LIFO, which lets you keep a core position for a much higher target.
Note: The LIFO method is prohibited under International Financial Reporting Standards (IFRS), though it is permitted in the United States by Generally Accepted Accounting Principles (GAAP). Therefore, only US traders can apply this method. Those who cannot trade LIFO can use an alternative by setting two different accounts for the same stock, one for the long term and one for short-term trading.
Warning: The TA chart must be updated frequently to be relevant. It is what I am doing in my stock tracker. The chart above has a possible validity of about a week. Remember, the TA chart is a tool only to help you adopt the right strategy. It is not a way to foresee the future. No one and nothing can.
Author’s note: If you find value in this article and would like to encourage such continued efforts, please click the “Like” button below as a vote of support. Thanks.
Be the first to comment