

Pgiam/iStock via Getty Images
Investment Thesis
This article is about coming stock prices, not about past and present bookkeeping profit & loss entries.
Retirement-contemplating investors confront impending needs to finance biotech-lengthened survival years with inadequate “income” investment strategies hoping for dividend yields not seen since the 1950’s.
The oversupply of need for personal financing coupled with shortage of income years begs for the capture of more bite-sized uncertainty price volatility payoff morsels. Opportunities ignored out of misplaced loyalty to an investment time environment no longer present can’t be endured by many.
So we turn to identifying the conditions producing (or at least commonly-occurring) at those points in time when stock profit satisfactions are available to be had.
They appear to be found in the actions of market participants more regularly than solely in the intentions of corporate management engineers and accountants. Our analysis of the self-protective actions of market-makers provides a balance between upside and downside price-change limit expectations. These are not usually found in ordinary single-price target-P/E evaluations.
The advances in information and communications technology which produced the “transaction-commission-free” competitive environment for smaller-size-trade individual-investors make practical a holding-period-limited strategy of effective risk management.
That risk treatment’s outstanding accomplishment is in producing a common user-oriented measure of investor appeal for widely-varied underlying equity investments. That is illustrated in this article by comparing energy-source stocks subject to widely-varying competitive environments – fuels, consumers, and regulators.
Here beside several oil/gas producers are coal, solar, and electricity converter utilities stocks. All with investors looking for stock price increases to capture and decreases to avoid. The following brief descriptions highlight some of their competitive differences.
Company descriptions
Occidental Petroleum Corporation (NYSE:OXY), together with its subsidiaries, engages in the acquisition, exploration, and development of oil and gas properties in the United States, the Middle East, Africa, and Latin America. It operates through three segments: Oil and Gas, Chemical, and Midstream and Marketing. The company’s Oil and Gas segment explores for, develops, and produces oil and condensate, natural gas liquids (NGLS), and natural gas. Its Chemical segment manufactures and markets basic chemicals, including chlorine, caustic soda, chlorinated organics, potassium chemicals, ethylene dichloride, chlorinated isocyanurates, sodium silicates, and calcium chloride; vinyls comprising vinyl chloride monomer, polyvinyl chloride, and ethylene. The Midstream and Marketing segment gathers, processes, transports, stores, purchases, and markets oil, condensate, NGLs, natural gas, carbon dioxide, and power. This segment also trades around its assets consisting of transportation and storage capacity; and invests in entities. Occidental Petroleum Corporation was founded in 1920 and is headquartered in Houston, Texas.
Peabody Energy Corporation (BTU) engages in coal mining business in the United States, Japan, Taiwan, Australia, India, Indonesia, China, Vietnam, South Korea, and internationally. The company operates through Seaborne Thermal Mining, Seaborne Metallurgical Mining, Powder River Basin Mining, and Other U.S. Thermal Mining segments. It is involved in mining, preparation, and sale of thermal coal primarily to electric utilities; mining bituminous and sub-bituminous coal deposits; and mining metallurgical coal, such as hard coking coal, semi-hard coking coal, semi-soft coking coal, and pulverized coal injection coal. The company supplies coal primarily to electricity generators, industrial facilities, and steel manufacturers. As of December 31, 2021, it owned interests in 17 coal mining operations located in the United States and Australia; and had approximately 2.5 billion tons of proven and probable coal reserves and approximately 450,000 acres of surface property through ownership and lease agreements. The company also engages in direct and brokered trading of coal and freight-related contracts, as well as provides transportation-related services. Peabody Energy Corporation was founded in 1883 and is headquartered in St. Louis, Missouri.
Tesla, Inc. (TSLA) designs, develops, manufactures, leases, and sells electric vehicles, and energy generation and storage systems in the United States, China, and internationally. The company operates in two segments, Automotive, and Energy Generation and Storage. The Energy Generation and Storage segment engages in the design, manufacture, installation, sale, and leasing of solar energy generation and energy storage products, and related services to residential, commercial, and industrial customers and utilities through its website, stores, and galleries, as well as through a network of channel partners. This segment also offers service and repairs to its energy product customers, including under warranty; and various financing options to its solar customers. The company was formerly known as Tesla Motors, Inc. and changed its name to Tesla, Inc. in February 2017. Tesla, Inc. was incorporated in 2003 and is headquartered in Austin, Texas.
FirstEnergy Corp. (FE), through its subsidiaries, generates, transmits, and distributes electricity in the United States. It operates through Regulated Distribution and Regulated Transmission segments. The company owns and operates coal-fired, nuclear, hydroelectric, natural gas, wind, and solar power generating facilities. It operates 24,074 circuit miles of overhead and underground transmission lines; and electric distribution systems, including 273,295 miles of overhead pole line and underground conduit carrying primary, secondary, and street lighting circuits. The company serves approximately 6 million customers in Ohio, Pennsylvania, West Virginia, Maryland, New Jersey, and New York. FirstEnergy Corp. was incorporated in 1996 and is headquartered in Akron, Ohio.
Edison International (EIX), through its subsidiaries, generates and distributes electric power. It delivers electricity to 15 million residential, commercial, industrial, public authorities, agricultural, and other customers across Southern, Central, and Coastal California. The company also provides energy solutions to commercial and industrial users. Its transmission facilities consist of lines ranging from 55 kV to 500 kV and substations; and distribution system consists of approximately 39,000 circuit-miles of overhead lines, approximately 31,000 circuit-miles of underground lines, and 800 substations. The company was founded in 1886 and is headquartered in Rosemead, California.”
Source: Yahoo Finance
Risk versus Reward is the Pervasive Contest
Figure 1 shows how that current struggle is reflected in coming price-change expectations for various stocks.
Figure 1
blockdesk.com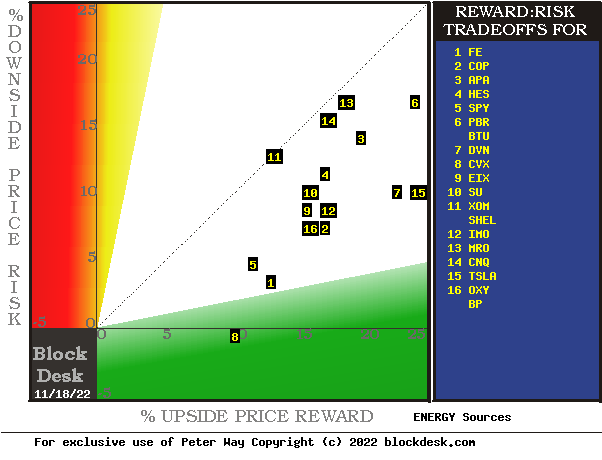
(used with prior permission)
The tradeoffs here are between near-term upside price gains (green horizontal scale) seen worth protecting against by Market-makers with short positions in each of the stocks, and the prior actual price drawdowns experienced during holdings of those stocks (red vertical scale). Both scales are of percent change from zero to 25%.
The intersection of those coordinates by the numbered positions is identified by the stock symbols in the blue field to the right.
The dotted diagonal line marks the points of equal upside price change forecasts derived from Market-Maker [MM] hedging actions and the actual worst-case price drawdowns from positions that could have been taken following prior MM forecasts like today’s.
Our principal interest is in OXY at location [16]. A “market index” norm of reward~risk tradeoffs is offered by SPDR S&P500 index ETF at [5]. Best positions are down and to the right as suggested by FirstEnergy utility at Location [1] near the 5 to 1 Risk-to-Reward area in green, and by TSLA at location [16] near the right-hand margin. The location of CVX at [8] is a product of the moment, caused by not previously having had as low-risk a set of price expectations as they do now.
Those forecasts are implied by the self-protective behaviors of MMs who must usually put firm capital at temporary risk to balance buyer and seller interests in helping big-money portfolio managers make volume adjustments to multi-billion-dollar portfolios. The protective hedging actions taken with real-money bets define daily the extent of likely expected specific price changes for thousands of stocks and ETFs.
This Figure 1 map is a good starting point, but it can only cover some of the investment characteristics that often should influence an investor’s choice of where to put his/her capital to work. The table in Figure 2 covers the above considerations and several others.
Comparing Alternative Investments
Figure 2
blockdesk.com
(used with permission)
Why do all this math?
Figure 2’s purpose is to attempt universally comparable answers, stock by stock, of a) How BIG the prospective price gain payoff may be, b) how LIKELY the payoff will be a profitable experience, c) how SOON it may happen, and d) what price drawdown RISK may be encountered during its holding period.
Readers familiar with our analysis methods after quick examination of Figure 2 may wish to skip to the next section viewing price range forecast trends for OXY.
Column headers for Figure 2 define investment-choice preference elements for each row stock whose symbol appears at the left in column [A]. The elements are derived or calculated separately for each stock, based on the specifics of its situation and current-day MM price-range forecasts. Data in red numerals are negative, usually undesirable to “long” holding positions. Table cells with yellow fills are of data for the stocks of principal interest and of all issues at the ranking column, [R]. Pink-filled cells in [T] caution disadvantages of risk exposure experience greater than reward prospects.
The price-range forecast limits of columns [B] and [C] get defined by MM hedging actions to protect firm capital required to be put at risk of price changes from volume trade orders placed by big-$ “institutional” clients.
[E] measures potential upside risks for MM short positions created to fill such orders, and reward potentials for the buy-side positions so created. Prior forecasts like the present provide a history of relevant price draw-down risks for buyers. The most severe ones actually encountered are in [F], during holding periods in effort to reach [E] gains. Those are where buyers are emotionally most likely to accept losses.
The Range Index [G] tells where today’s price lies relative to the MM community’s forecast of upper and lower limits of coming prices. Its numeric is the percentage proportion of the full low to high forecast seen below the current market price.
[H] tells what proportion of the [L] sample of prior like-balance forecasts have earned gains by either having price reach its [B] target or be above its [D] entry cost at the end of a 3-month max-patience holding period limit. [ I ] gives the net gains-losses of those [L] experiences.
What makes OXY most attractive in the group at this point in time is its ability to produce earnings most consistently at its present operating balance between share price risk and reward, the Range Index [G]. Credibility of the [E] upside prospect as evidenced in the [I] payoff is shown in [N]. While occasional large price drawdowns have occurred during holding periods on the way to payoffs, none of those resulted in any closeout losses and average gains have been substantially larger than comparable stocks.
Further Reward~Risk tradeoffs involve using the [H] odds for gains with the 100 – H loss odds as weights for N-conditioned [E] and for [F], for a combined-return score [Q]. The typical position holding period [J] on [Q] provides a figure of merit [fom] ranking measure [R] useful in portfolio position preferencing. Figure 2 is row-ranked on [R] among alternative candidate securities, with OXY in top rank.
Along with the candidate-specific stocks these selection considerations are provided for the averages of some 3200 stocks for which MM price-range forecasts are available today, and 20 of the best-ranked (by fom) of those forecasts, as well as the forecast for S&P500 Index ETF (SPY) as an equity-market proxy.
As shown in column [T] of figure 2, those levels vary significantly between stocks. What matters is the net gain between investment gains and losses actually achieved following the forecasts, shown in column [I]. The Win Odds of [H] tells what proportion of the Sample RIs of each stock were profitable. Odds below 80% often have proven to lack reliability.
Recent Forecast Trends of Primary Subject OXY
Figure 3
blockdesk.com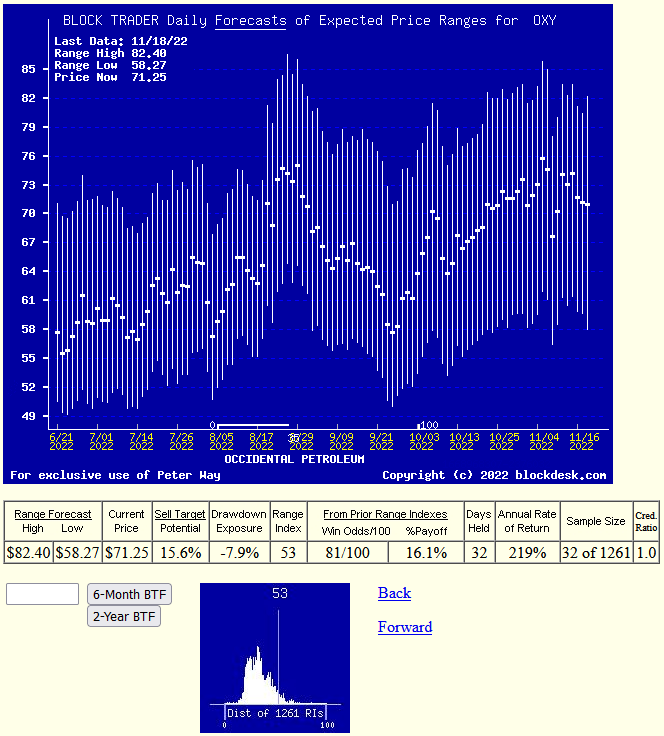
(used with permission)
No, this is not a “technical analysis chart” showing only historical data. It is a Behavioral Analysis picture of the Market-Making community’s actions in hedging investments of the subject. Those actions define expected price change limits shown as vertical bars with a heavy dot at the closing price on the date of the forecast.
It is an actual picture of experienced market professionals’ expected future prices, not a simple hope of a recurrence of the past. These expectations are backed up by significant bets of investment capital made to protect market-makers or to earn a proprietary profit from risk-taking.
The special value of such pictures is their ability to immediately communicate the balance of expectation attitudes between optimism and pessimism. We quantify that balance by calculating what proportion of the price-range uncertainty lies to the downside, between the current market price and the lower expected limit, labeled the Range Index [RI].
Prior periods where price is at or even below the bottom of the forecast range, have typically been followed by higher market prices and forecast price ranges.
In this structure a RI at zero indicates no further price decline is likely, but not guaranteed. The odds of 3 months passing without either reaching or exceeding the upper forecast limit or being at that time below the expected lower price (today’s) are quite slight.
The probability function of price changes for OXY are pictured by the (thumbnail) lower Figure 3 frequency distribution of the past 5 years of RI values with the today value indicated. The closeness of upper price limits adds to the prospect of their being reached in time periods similar to the 6+ week prior experience average following current Range Indexes previously noted .
Conclusion
The multi-path valuations explored by the analysis covered in Figure 2 is rich testimony to the near-future value prospect advantage of a current investment in Occidental Petroleum Corporation over and above the other compared alternative investment candidates.
Be the first to comment