

Anchiy
Investment Summary
We continue to critically evaluate the broad healthcare sector for selective opportunities offering differentiated growth potential. Since our last review of Oak Street Health, Inc. (NYSE:OSH), we note there’s little changed from our original position. The stock is down 36% from the date of that publication.
In the previous report [which you can see here by the way Oak Street Health: Comments On Q2 Earnings Report] we noted OSH’s lack of profitability and EPS upside, despite printing $523mm in quarterly revenue – more than $2Bn annualized. Whilst management updated FY22 guidance on the Q3 earnings call to ~$2.15Bn, we note this growth doesn’t appear to carry vertically down the P&L. Alas, without the EPS and ROIC upside to bite into, we reaffirm our neutral thesis and believe the stock is fairly value at $19.40 based on its latest financial results.
Q3 financial results continued previous growth trends
Turning to OSH’s financial results for the quarter, we noted similar trends in earnings and profitability found in our last report. Revenue growth of 40% YoY came into $545.7mm, a record turnover for the company.
On this, medical claims expense lifted 38% YoY to $427.4mm, however, when OSH adjusts for “prior period changes” its medical claims expense lifted 47% YoY. Consequently, we note the 35.7% YoY increase in OpEx, driven by the major increase in medical claims expense.
We also noted the cost of care [excluding non-cash items] pulled in 49% higher than the previous year to $113.6mm, as the company increased its patient and staffing base.
What wasn’t as satisfying to see, is the company’s $81.7mm print at the SG&A line, a YoY increase of 600bps – comprised mainly of stock-based compensation. This was “inflated due to the treatment of [its] pre-IPO management equity plan”. Management do see stock-based compensation reducing in periods to come. Although, we’d prefer to see some stock price performance instead, in all honesty.
A review of OSH’s quarterly numbers from FY20–date is observed in Exhibit 1.
Exhibit 1. Sequential revenue growth flattened in FY21 whilst EBITDA, operating losses, FCF outflows continue to widen.
Data: HBI, OSH SEC Filings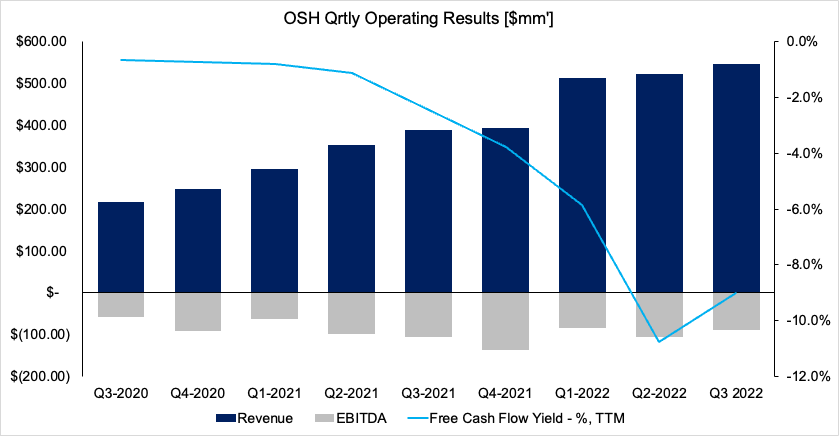
Turning to the operational highlights, our findings are as follows:
- We see OSH’s at-risk patient base stretched up by 44% YoY to 145,000 patients. Management note this is a key driver to the company’s financial performance. Driving this number was its growth in facilities, now resting at 161 centers – up from 110 sites the year prior.
- Capitated revenue was also a standout with 53% YoY upside to $537.9mm. Underpinning this movement was again the growth in OSH’s at-risk patient base. We’d also note that CMS made retrospective adjustments in removing a small number of patients from the company’s revenue clip “following a review of [its] patient panel”.
- It’s also worth noting some non-GAAP measures. We see that patient contribution lifted 65% to $110.5mm. It is defined as capitated revenue less medical claims expense. Meanwhile, platform contribution pulled in to $6mm for the period, up c.95% over the year. It recognized these numbers on adjusted EBITDA loss of $88.3mm, versus a $64.4mm loss this time last year.
- One important factor we’d also highlight is around liquidity. OSH opened a $300mm revolver facility which it can draw in tranches or as a waterfall over time. It says the debt raise was important to fund its growth vision of 30–40 new centers in FY23,24′ respectively. We believe the company won’t need additional equity capital as a result of this.
- Finally, we should also note OSH paid the RubiconMD contingent earnout after all performance milestones were met. The earnout was paid in a cash-scrip consideration of $27.5mm in cash and $32.5mm or 1.2mm shares.
OSH technical data unsupportive of immediate entry
We’ve been actively reviewing chart studies for all the names under our coverage universe since we entered bear market territory this year.
For OSH, we looked at the following 3 charts as standouts. You can see in Exhibit 2 that the stock has traded in a descending channel for 66 weeks after breaking downwards in August FY21.
Despite 2x breakout attempts from its bottom-base both attempts have met heavy resistance and failed to rally above previous highs [seen between the two red trend lines]. It now continues in sideways consolidation, backing and filling between the support and resistance levels shown.
In addition, the 50DMA crossed beneath the 250DMA in April this year and this trend has remained in situ to date. At the same time, we’ve yet to see any major reversal or breakouts in weekly volume trends either.
To us, the fact OSH failed at both attempts to breakout above resistance aligns with our findings in the company’s fundamentals.
Exhibit 2. OSH 24-month price evolution [weekly bars, log scale] demonstrating heavy resistance within latest consolidation.
Data: Updata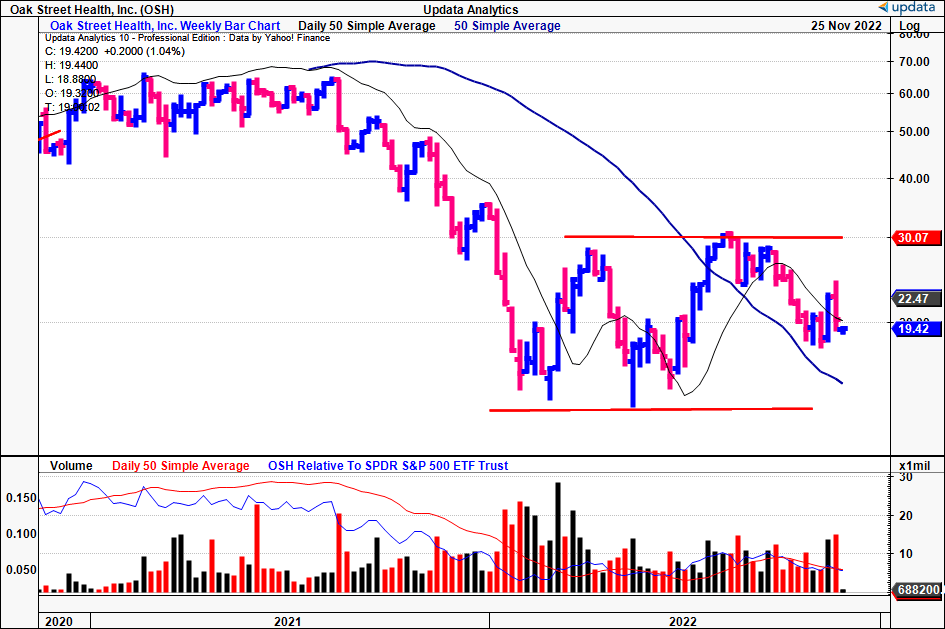
Subsequently, we identified technical price targets as low as $16.75, which has yet to be taken out. To date, the targets identified from our point and figure studies [Exhibit 3] have served us well, giving greater confidence in their predictiveness.
Exhibit 3. Downside targets to $16.75, multiple inner/outer resistance lines to overcome
Data: Updata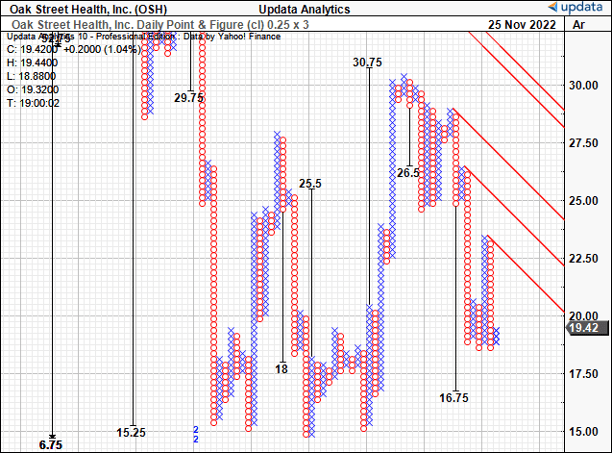
Raised guidance not enough to reverse mid-term capital growth
We should also point out that management raised FY22 guidance to $2.15Bn–$2.155Bn. This calls for 54.2% YoY growth at the upper end. It sees this on an at-risk patient base of 157,000–159,000, whilst projecting 169 centers under its umbrella for the year. It hopes to achieve these revenues on adjusted EBITDA of negative $292.5–$287.5mm for the year.
These are impressive growth numbers that suggest OSH is confident on hitting its growth targets at the top line looking ahead.
The issue for us when peering down the line is when we look further down the P&L to FCF and EPS. In fact, we see an ongoing period of EPS losses into the coming 2 years, both on quarterly and annual basis.
Specifically, we estimate FY22 EPS of negative $2.28, only improving to a negative $1.28 in EPS by FY24. It’s not unreasonable to expect OSH’s quarterly EPS losses blowing to $0.57 in our opinion. You can see our full stream of EPS projections for OSH in Exhibit 4.
Our full income projections from top-bottom are observed in Appendix 1.
Exhibit 4. OSH FY22–24′ EPS assumptions
Data: HBI Estimates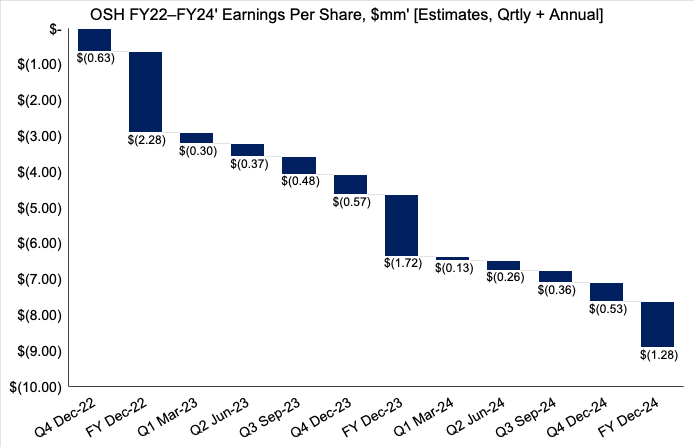
Valuation and conclusion
The lack of EPS upside has us less constructive on the stock looking ahead. Last time, we saw OSH trading at 5x sales, and it now trades at just 2.19x sales. The question is if this represents value of not. Firstly, OSH has negative shareholder equity of $155.6mm, and it projects 54% growth at the top in FY22.
Moreover, we estimate, there’s a slew of macro-risks that we believe the company isn’t factoring into its revenue assumptions. Specifically, around rates and the broad healthcare market. Hence, we believe it will print $2.145Bn in FY22 and $3Bn in FY23 [Appendix 1].
Alas, we believe the market has OSH valued correctly at ~2.2x sales. Rolling our FY22 revenue assumptions forward, we’d suggest a price range for OSH of $19.40 and therefore believe it is fairly valued.
Appendix 1. OSH FY22–24′ growth assumptions [internal estimates]
Data: HBI Estimates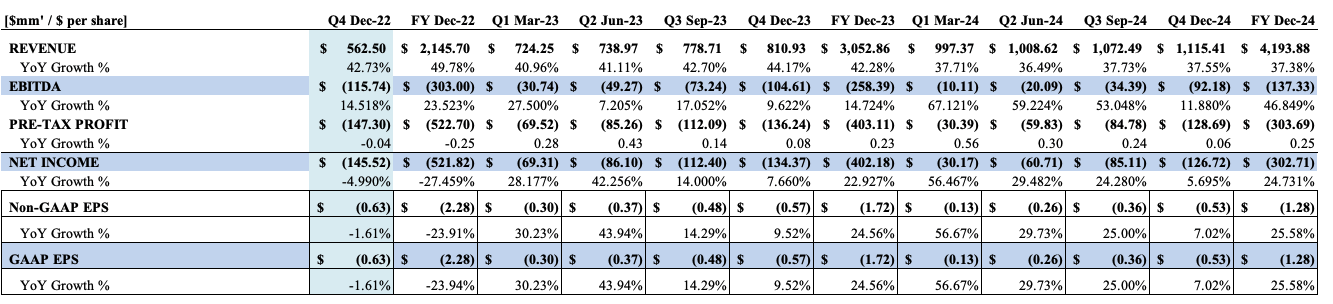
With the findings of this report in mind, we reaffirm our hold thesis on OSH and look forward to the company’s next financial results in order to re-evaluate our position. Until then, we encourage investors to remain patient with this name.
Be the first to comment